Table of Contents
Run 62 Summary
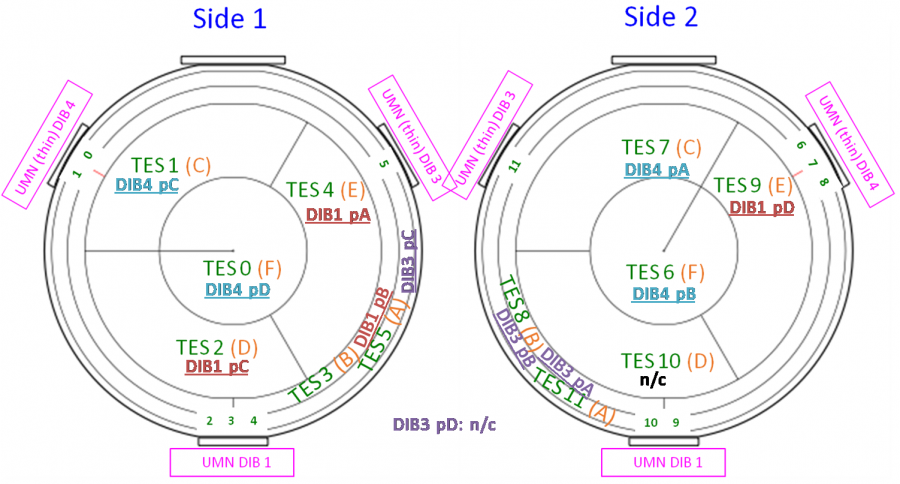
| pA | pB | pC | pD | |
|---|---|---|---|---|
| DIB1 | TES4 | TES3 | TES2 | tes9(-tes10) |
| DIB3 | tes8(d4) | tes11 | TES5 | n/c |
| DIB4 | tes7 | tes6 | TES1 | TES0 |
| CAPITAL = Side 1, lowercase = Side 2 “-” indicates a non-readout channel shorted to a readout channel for biasing purposes |
||||
5 Side 2 channels are available for readout, 6 Side 1 channels are available.
| Channel map for 2-sided 0-Volt mode |
|
|---|---|
| DCRC1 pA | Side1 pE |
| DCRC1 pB | Side1 pB |
| DCRC1 pC | Side1 pD |
| DCRC1 pD | Side2 pE |
| DCRC2 pA | Side2 pB |
| DCRC2 pB | Side2 pA |
| DCRC2 pC | Side1 pA |
| DCRC2 pD | n/c |
| DCRC3 pA | Side2 pC |
| DCRC3 pB | Side2 pF |
| DCRC3 pC | Side1 pC |
| DCRC3 pD | Side1 pF |
| HV side 2, Readout Side 1 Map | ||
|---|---|---|
| DIB channel | Detector channel | DCRC channel |
| DIB1 PA | S1 PE | HV1 PA |
| DIB1 PB | S1 PB | HV1 PB |
| DIB1 PC | S1 PD | HV1 PC |
| DIB3 PC | S1 PA | HV2 PB |
| DIB4 PC | S1 PC | HV2 PC |
| DIB4 PD | S1 PF | HV2 PD |
| SQUID settings as of Feb 8 | |||
|---|---|---|---|
| Channel | SQUID Bias (uA) | Lockpoint (mV) | Polarity |
| DIB1 pA | -91.2 | -4.3 | non-inverted |
| DIB1 pB | -78.8 | -3.3 | non-inverted |
| DIB1 pC | -82.0 | -4.8 | non-inverted |
| DIB1 pD | -85.2 | -2.7 | non-inverted |
| DIB3 pA | -54.0 | -1.8 | non-inverted |
| DIB3 pB | -60.3 | -1.8 | non-inverted |
| DIB3 pC | -46.3 | -2.0 | non-inverted |
| DIB3 pD | N/A | N/A | non-inverted |
| DIB4 pA | -81.8 | -3.3 | non-inverted |
| DIB4 pB | -78.3 | -2.9 | non-inverted |
| DIB4 pC | -85.0 | -3.5 | inverted |
| DIB4 pD | -85.0 | -5.7 | inverted |
Critical Temperatures
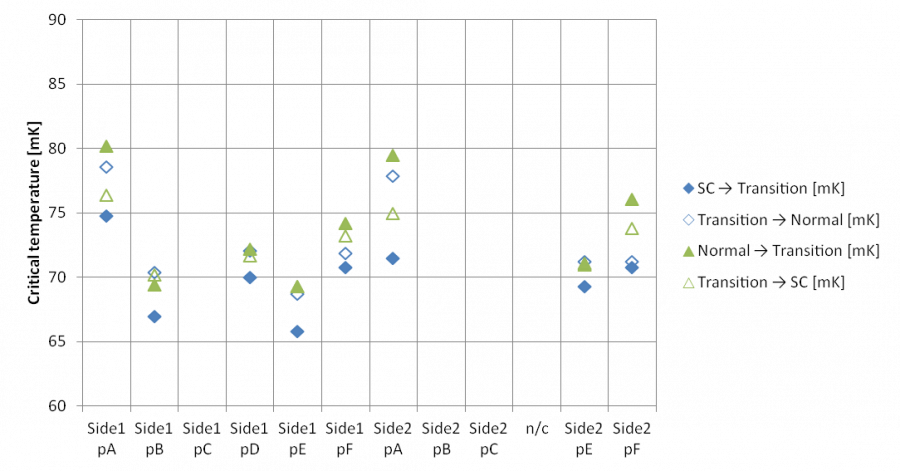
The critical temperatures in the plot above were measured on January 26, January 30, and February 1. At the start of this period the tower temperature was still rather high (62 mK) and the standard technique of measuring Tc by applying a test signal to the QET bias did not work - apparently the test signal was driving the TESs normal. So a technique was used in which a small DC QET bias current was applied and the channels were observed as the temperature was raised and lowered.
The range of Tc values is smaller than in Run 61 with G101c (HV#2), with no outlier channels of those measured. The transition widths appear larger, but this may be an artifact of the method. It may be worth remeasuring these.
Three of the connected channels were not working so no Tc was measured. Some time after these measurements were taken, Side1 pC was found to be operational, so its Tc should be measured.
Normal Resistances
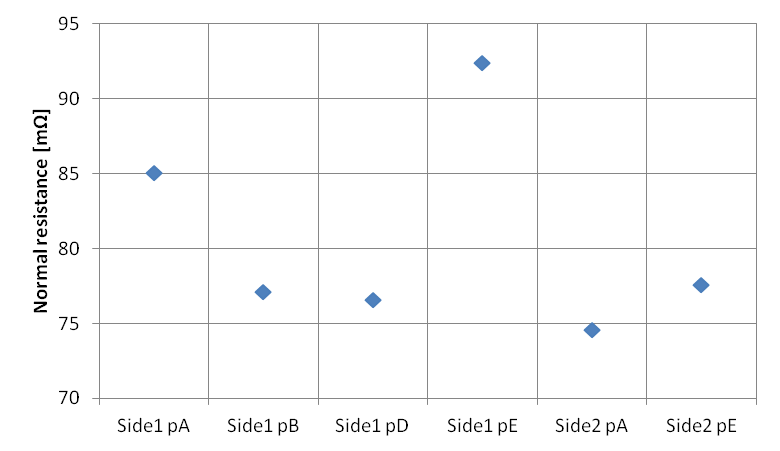
Normal resistances were measured from IbIs data. Total resistance was measured using the slope from the offset to the point in question, and the normal+parasitic was taken to be either the maximum or, if the resistance continually increased with increasing QET bias, the value at 300 μA. The parasitic resistance was measure based on the slope of the IbIs curve near 0 QET bias and then subtracted to get the normal resistance.
dP/dI
Below links to an attempt to characterize dP/dI for all good channels on DIBs 1 and 3 measured in 2-sided mode. The intent was to select a dP/dI value and take data at that setting. However it turned out that as in the last run the IbIs behavior was not very stable so this was not useful.
First attempts to see calibration lines
Spectra from biased data
Pu/Be Data Analysis
Phonon Collection Efficiency
dP/dI study
See analysis note "Correcting the dP/dI Absolute TES Calibration"
dPdI variation with baseline
Noise Study
HV board leakage
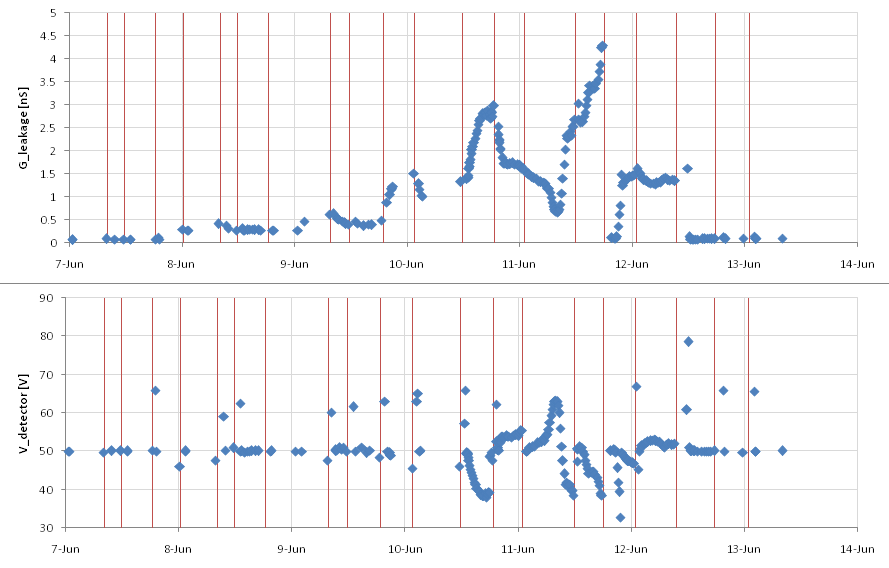 |
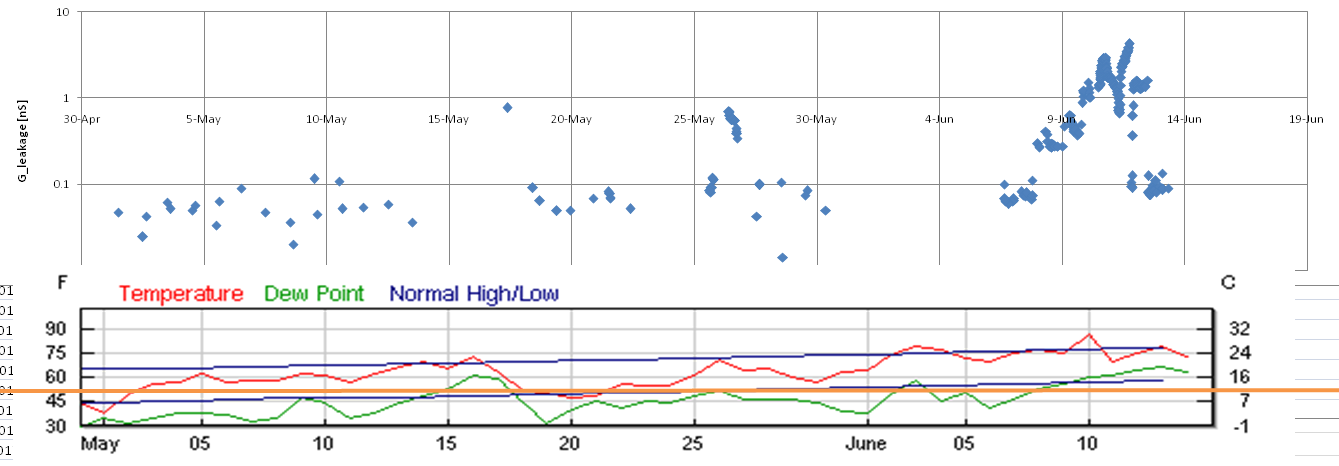
| For most of the run the current leakage through the HV board was low, less than 0.1 nS. But on occasions it rose an order of magnitude higher. At its worst near the end it was mitigated by rigging a nitrogen purge bag around the ebox and the cable ends to the ebox. The first usage was on June 11 and was short-lived because we ran out a cylinder of N2. It was repeated on June 13 using boiloff from the LN2 Dewar. |
 |
Spreadsheet