Table of Contents
Resolution and threshold
This is a closer study of our 0-energy resolution, related to the noise threshold, with the Si HV prototype detector. Apart from general interest this study is motivated by the question of whether we have sufficiently low threshold for a proper n,γ coincidence measurement to study the low-energy NR calibration.
First attempt: calibrating directly to lines in OF amplitude
Earlier looks at the noise threshold for this run involved calibrating the OF amplitude to the integral amplitude first, then making a second nonlinear calibration to keVee. Here I take a more direct approach and look directly at the OF quantities and calibrate from the visible peaks.
At this point I'm using a default single analytical template OF and no relative calibration. Nick has made better templates and performed relative calibrations. He has also constructed two-template OF quantities but these seem to give biased results for the noise blob. So I will use the total-phonon single-template OF quantity with fixed time (PTOFamps0).
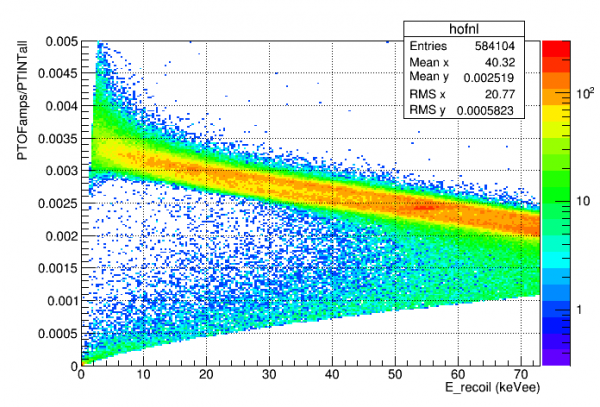
It is important to point out the nonlinearities in the calibration. First, the integral quantities themselves are not linear with energy, as seen in the phonon collection efficiency study. This is thought to be a consequence of local saturation.
Secondly, the OF amplitude does not track linearly with the integral amplitude. This must be due to the fact that the pulse shape varies with energy, so that a fixed template will not fit all pulses. Higher energy pulses are visibly wider.
| Figure 1 |
|---|
 |
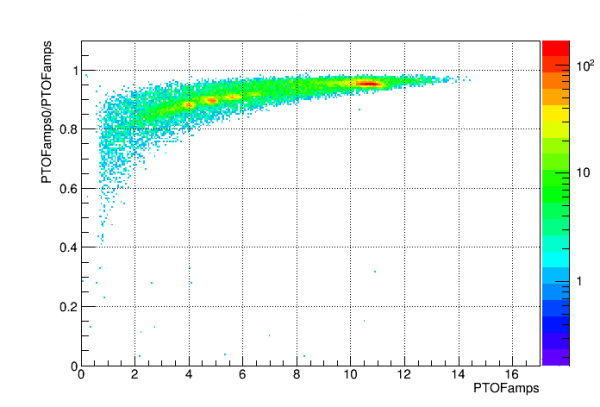
Third, the fixed-time OF amplitude deviates noticeably from the fit-time OF amplitude.
| Figure 2 |
|---|
 |
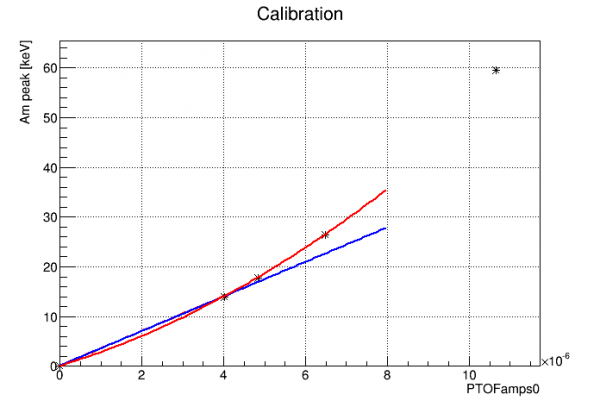
Originally I calibrated the fixed-time quantity by fitting the visible peaks. This gives a more conservative estimate of the noise width. But it is not the most accurate way to express the noise amplitude in OF energy units - it makes more sense to use a calibration based on the fit-time OF quantity, which finds the greatest amplitude. Here are the original plots using a fixed time (PTOFamps0) calibration.
To calibrate I used the fit-time OF quantity and fit the visible peaks. To see the peaks it was necessary to apply a cut for high pF partition. I tried both a quadratic fit using the 14 and 18 keV peaks and a linear cut using only the 14 keV peak, in each case fixing the calibration so that 0 amplitude = 0 keV. The quadratic is probably closer to the true calibration - the linear case is more conservative, i.e. it results in a larger width noise blob in energy units. So if the quadratic fit is too optimistic, the linear gives a sense of how much worse it could be.
| Figure 3 |
|---|
 |
| Figure 4 | |
|---|---|
 |  |
| Figure 5 |
|---|
 |
| threshold = mean + 3sigma |
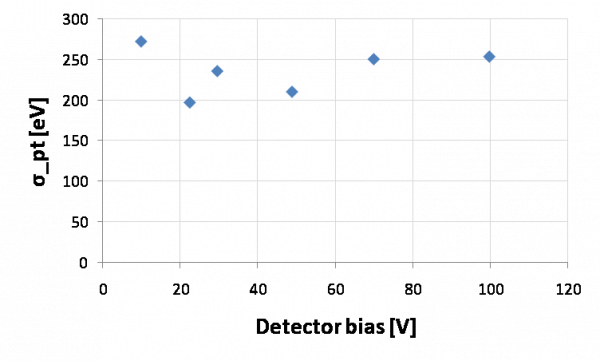
There are two data series that have resolutions that are worse than the general trend: the one at 70V and one of the two at 100V. They were both done late in the run, and it's possible that noise (e.g. from oscillations) was worse then - this could be studied further. If we ignore those points then the σ_pt is remarkably flat with HV, suggesting no measurable increase in noise with applied HV (and pure Luke-gain improvement in S/N).
Second attempt (improved): cross-calibrating OF amplitude to absolutely-calibrated integral amplitude
Because it's difficult to know the true shape of the nonlinear OF calibration from 0 to 20 keV, it is probably better to calibrate based first on the relatively well-behaved integral quantities. The phonon collection efficiency study showed a fairly regular PCE-versus-energy trend:
| Figure 6 |
|---|
 |
There is some scatter between datasets but there is a clear trend. Plotting this instead as total energy versus calibrated absorbed energy Eabsorbed, I produced a calibration curve:
| Figure 7 |
|---|
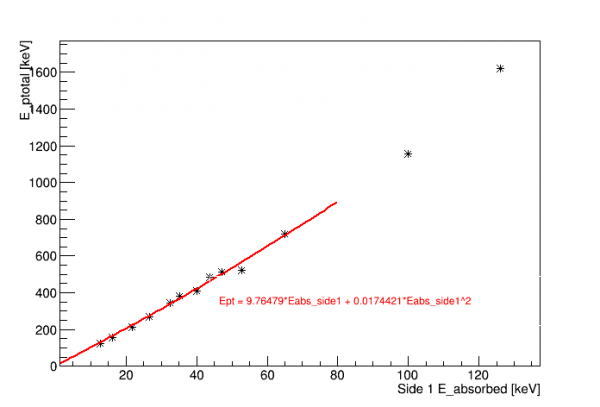 |
For each dataset I produced a quadratic fit (fixed at the origin) of PTOF to the Side1 E_absorbed quantity. Then I applied the above formula to calibrate to E_ptotal. Then I applied a proportional correction so that the 14 keV and 18 keV lines were in the correct place. This was the basis for the PTOF calibration to E_ptotal.
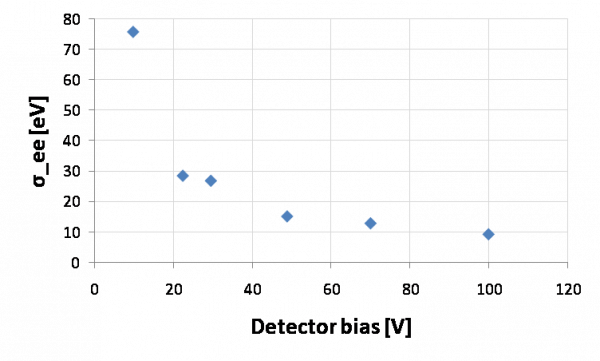
After that I applied the same calibration to the fixed-time OF quantity PTOF0 and measured the width and center of the randoms noise peak for each voltage bias. Results below:
| Figure 8 | |
|---|---|
 |  |
| Figure 9 |
|---|
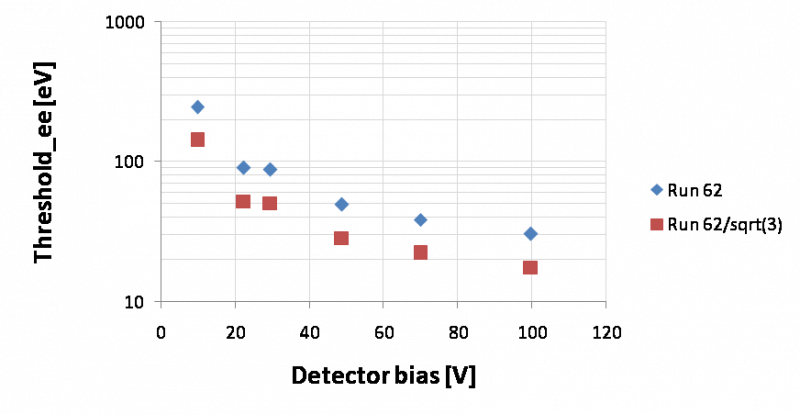 |
The results here are similar to the more optimistic quadratic-fit results in the previous section.
The calculated mean+3sigma threshold for 100V data in Run 62 is 30.4 eV. If we assume a sqrt(3) improvement after reducing the shunt resistances, the projected threshold is 17.5 eV.