Table of Contents
Run 61 Summary
Setup
Run 61 is the first test of G101c, the first SNOLAB HV prototype detector (known as HV#2 in project schedule documents).
The channel layout is as follows:
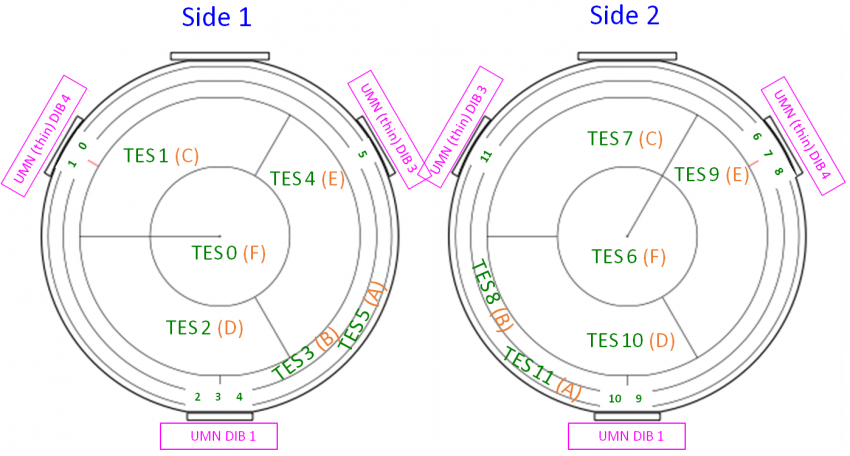 |
| G101c SNOLAB HV prototype channel layout. Also shown are the positions of the bond pads near each DIB. Two DIBs are thinner than standard because they are not at the detector flats. |
|---|
As mounted in the housing, Side 1 is the toward-tower side and Side 2 is the away-from-tower side
Wirebond repairs were performed at UMN and a rewiring of DIB4 was done to map to our HV boards without the need of external rerouting boards. The detector wiring scheme is
| pA | pB | pC | pD | |
|---|---|---|---|---|
| DIB1 | TES4 | TES3 | TES2 | TES9(-TES10) |
| DIB3 | n/c | TES11 | TES5 | n/c |
| DIB4 | n/c | TES8(-TES7-TES6) | TES1 | TES0 |
| Bold = Side 1, Italic = Side 2 “-” indicates a non-readout channel shorted to a readout channel for biasing purposes |
||||
Note that only three Side 2 channels are available for readout. All six Side 1 channels are available.
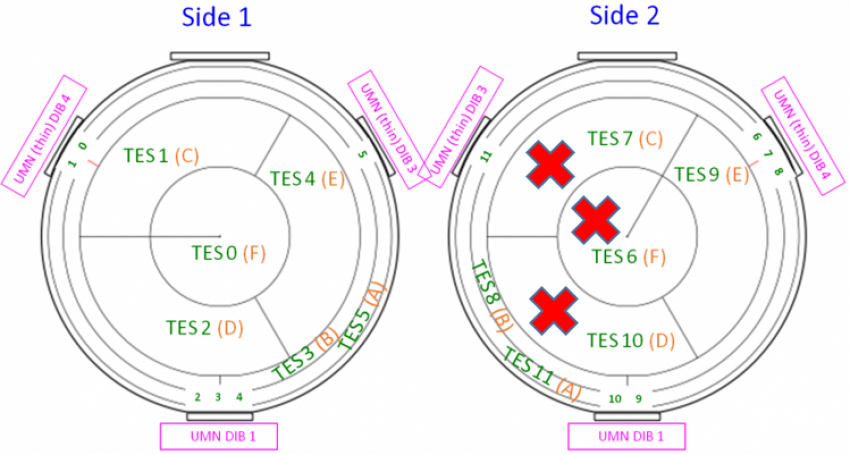 |
| Available channels for this wiring scheme |
|---|
| Channel map for 2-sided 0-Volt mode |
|
|---|---|
| DCRC1 pA | Side1 pE |
| DCRC1 pB | Side1 pB |
| DCRC1 pC | Side1 pD |
| DCRC1 pD | Side2 pE |
| DCRC2 pA | n/c |
| DCRC2 pB | Side2 pA |
| DCRC2 pC | Side1 pA |
| DCRC2 pD | n/c |
| DCRC3 pA | n/c |
| DCRC3 pB | Side2 pB |
| DCRC3 pC | Side1 pC |
| DCRC3 pD | Side1 pF |
| HV board wiring map, for either side | ||||||||
|---|---|---|---|---|---|---|---|---|
| Side 1 channels | Side 2 channels | DIB connections | HV board input | Readout 1, Bias 2 HV output | Readout 2, Bias 1 HV output |
|||
| TES4 | pA | DIB1 | CONN 1 | CONN 4 | pA | |||
| TES3 | pB | DIB1 | CONN 1 | CONN 4 | pB | |||
| TES2 | pC | DIB1 | CONN 1 | CONN 4 | pC | |||
| TES9 | pD | DIB1 | CONN 1 | CONN 4 | pD | |||
| LEDs | DIB1 | CONN 1 | CONN 4 | LEDs | ||||
| pA | DIB3 | CONN 3 | CONN 5 | pA | ||||
| TES11 | pB | DIB3 | CONN 3 | CONN 5 | pB | |||
| TES5 | pC | DIB3 | CONN 3 | CONN 5 | pB | |||
| pD | DIB3 | CONN 3 | CONN 5 | pD | ||||
| LEDs | DIB3 | CONN 3 | CONN 5 | LEDs | ||||
| pA | DIB4 | CONN 2 | CONN 4 | pA | ||||
| TES8 | pB | DIB4 | CONN 2 | CONN 4 | pB | |||
| TES1 | pC | DIB4 | CONN 2 | CONN 5 | pC | |||
| TES0 | pD | DIB4 | CONN 2 | CONN 5 | pD | |||
| LEDs | DIB4 | CONN 2 | CONN 5 | LEDs | CONN 4 | LEDs | ||
| Channel map for Side1-readout HV mode |
|
|---|---|
| DCRC1 pA | pE |
| DCRC1 pB | pB |
| DCRC1 pC | pD |
| DCRC1 pD | n/c |
| DCRC3 pA | n/c |
| DCRC3 pB | (pA) |
| DCRC3 pC | pC |
| DCRC3 pD | pF |
| due to noise issues, pA was generally not used in this run. |
|
note that Side2-readout was never tested in this run.
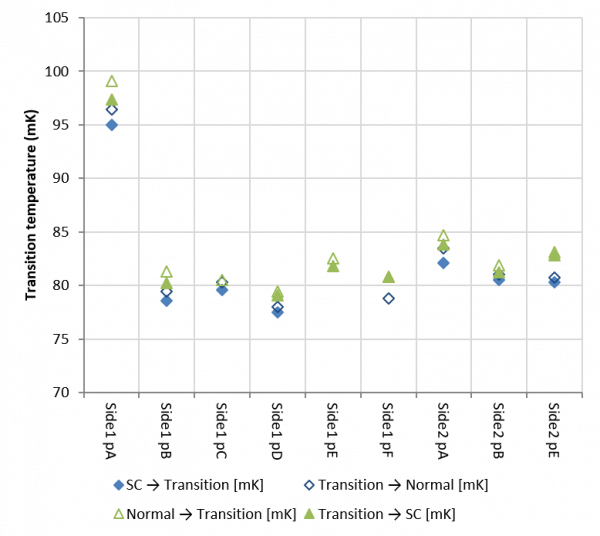
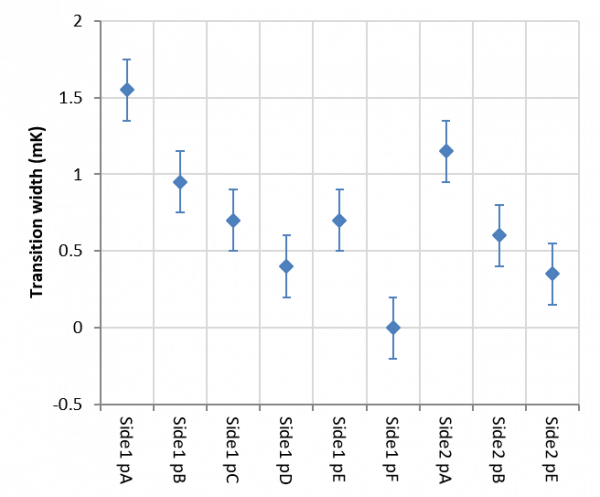
Critical temperatures, Normal resistances
 |  |
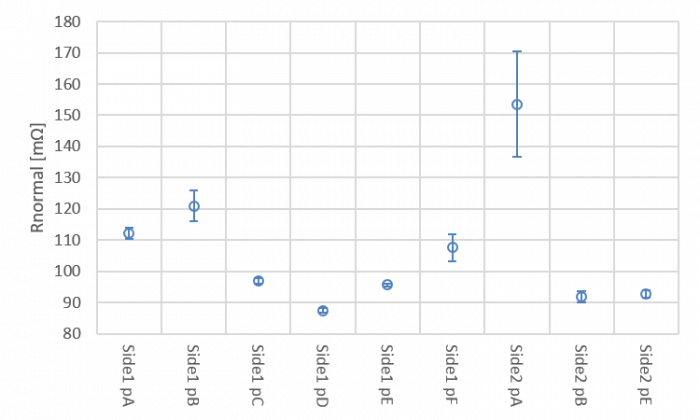 |
The normal resistances above were derived from IbIs fits, measuring the absolute TES+parasitic resistance at 300 uA, then subtracting the measured parasitic resistance.
Electrothermal Oscillations
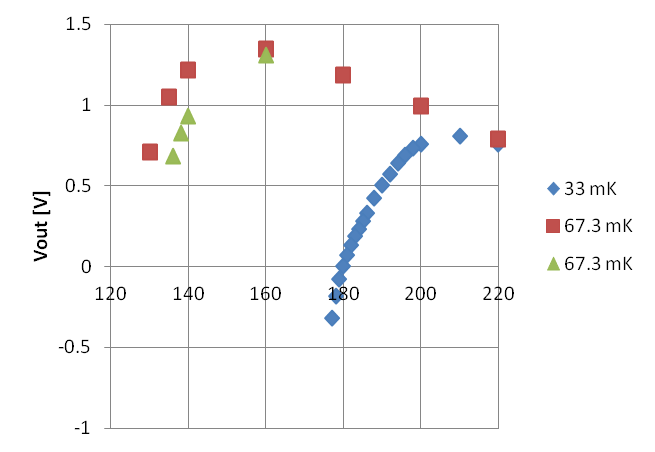
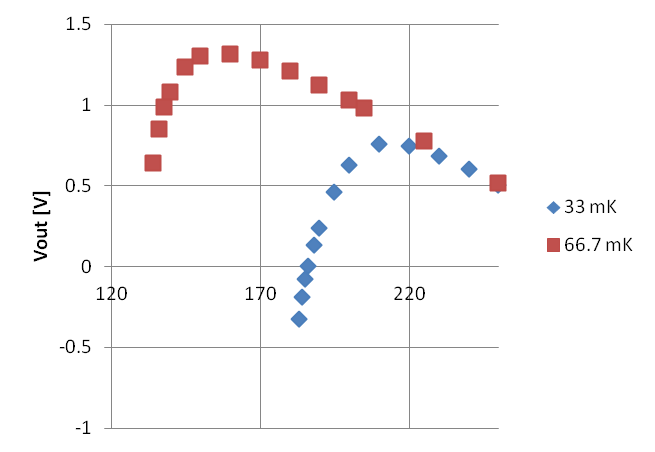
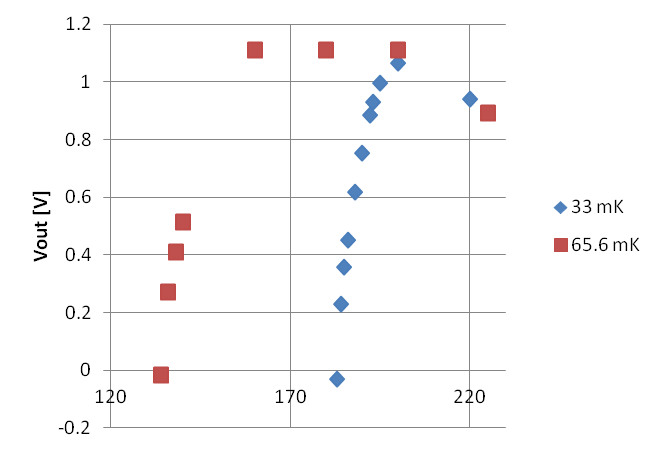
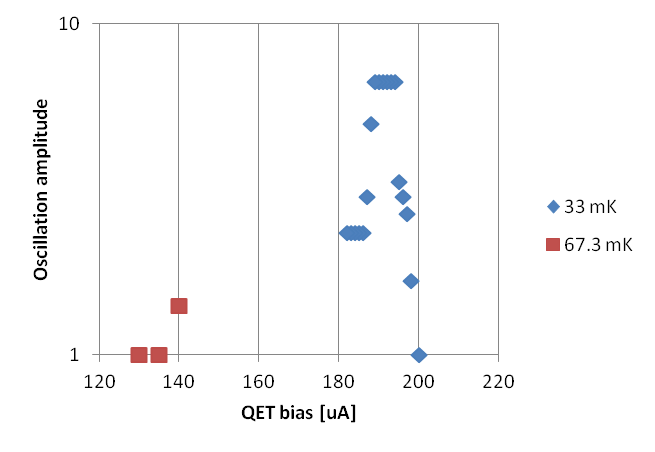
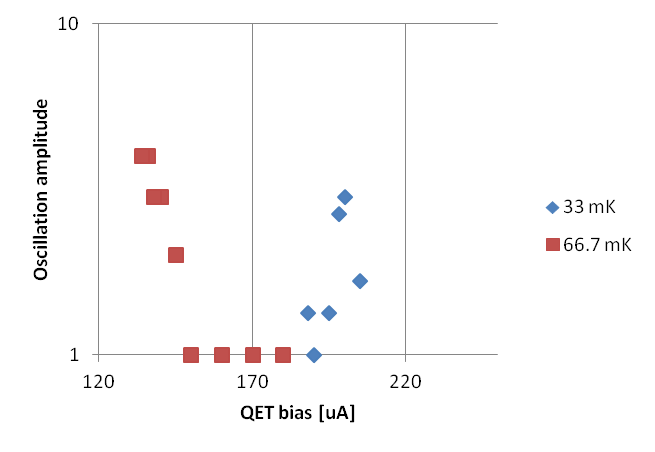
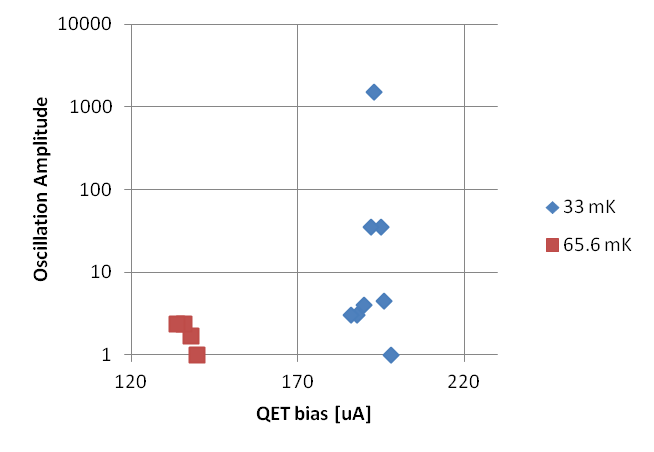
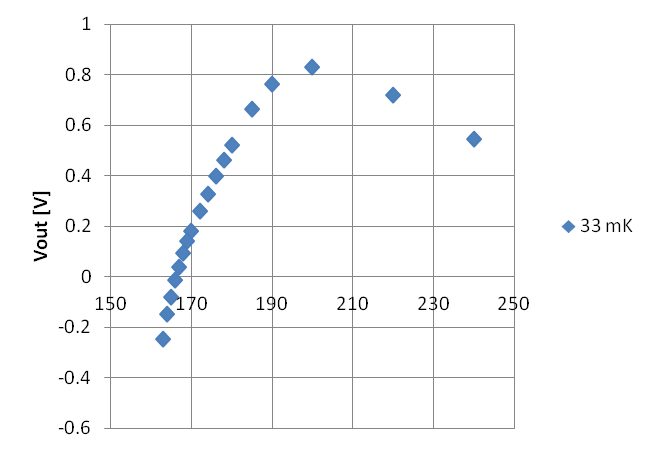
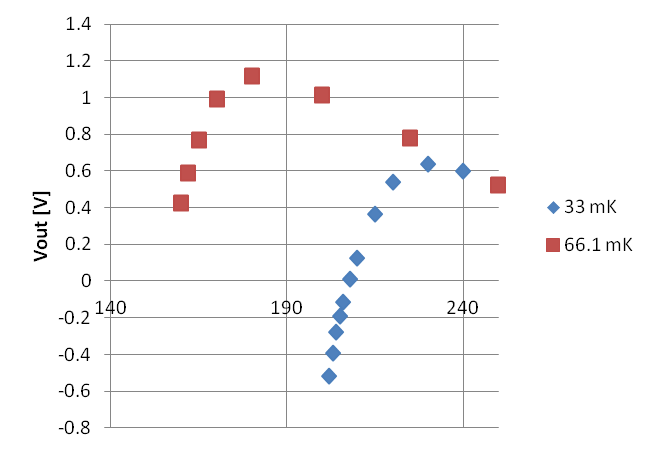
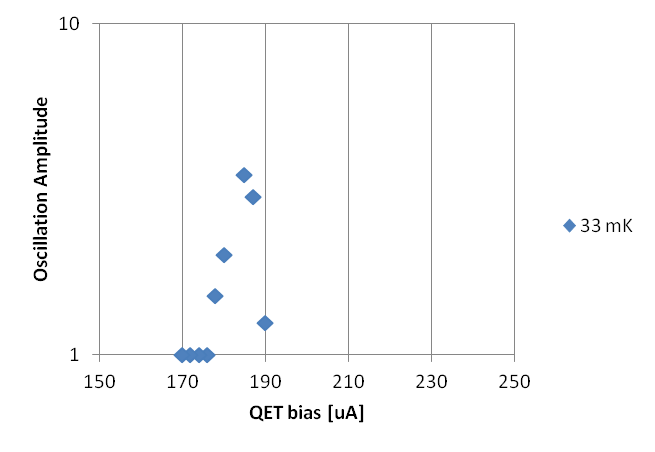
Sinusoidal oscillations around 10kHz were seen in most phonon channels over a range of QET biases. Generally we had to bias below this range to avoid the oscillations. Running at an elevated base temperature essentially eliminated the oscillations. A few sample channels are shown here:
| Side1 pE | Side1 pB | Side1 pD | ||
|---|---|---|---|---|
 |  |  |
||
 |  |  |
||
| This channel showed noticeable oscillations at the lower temperature, with the amplitude rising to about 7 times the minimum. No noticeable oscillations were seen at the higher temperature. | This channel did not show much 10kHz oscillation at either temperature. The peak structure in amplitude at low temperature suggests that maybe there was some but it was hard to see. In contrast, at low temperature the amplitude increases as the QET bias decreases, which may simply be due to the TES gain increasing as the bias point moves down toward the bottom of the transition. | This channel shows strong oscillations at the lower temperature, with the amplitude rising 3 orders of magnitude above the minimum. No noticeable oscillations were seen at the higher temperature. |
| Side1 pC | Side1 pF | |
|---|---|---|
 |  |
|
 |  |
|
| We skipped high-T measurements with this channel. The 10kHz oscillations were not very strong at low temperature. | This channel shows strong oscillations at the lower temperature, with the amplitude rising 3 orders of magnitude above the minimum. At the higher temperature there may also have been some hint of a peak in the PSD near 10kHz. |
Increased parasitic power with HV bias
| Phonon baseline shift with applied HV bias | Parasitic power in one channel versus applied HV bias |
|---|---|
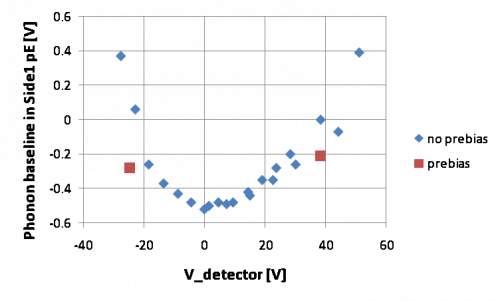 | 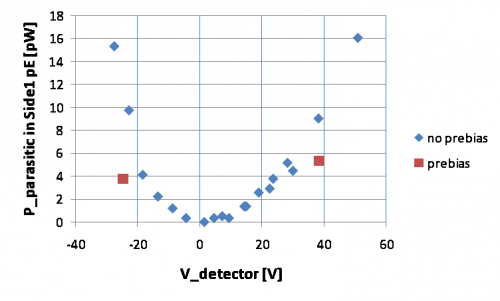 |
| RevC.1 with driver gain x8, in transition at QET bias 182 uA | From IbIs. At 0V the TES power is 52.9 pW |
Noise PSDs
Early noise PSDs, not as good as Bill's, cuts aren't as carefully constructed. Includes comparisons of noise with and without HV board.
Noise fits
Noise versus HV Bias
- Link to Bill Page's analysis of noise versus bias.
- Plots of Noise versus time after applying HV. Can see the ramp-up in biasing and a period of elevated noise for about 10 minutes.
Increased parasitic power with HV bias revisited
As described in the Run 54 summary the dark current at a certain HV bias can be estimated from the change in the noise spectrum.
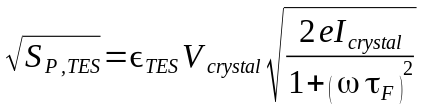
The power noise (in W/rthz) from a dark current is derived above in terms of detector bias, single-TES phonon collection efficiency, the electron charge, and the phonon channel fall time. At low frequency components (ω → 0) the power noise should be flat and elevated from the HV=0 case. From the plots in Bill's note we can see the shift in low-frequency noise at various HV biases.
Converting to power noise (using a dP/dI estimate from IbIs), and estimating the single-channel efficiency as 1%, I've estimated the dark current, and from that the total power dissipation in the detector due to the dark current, then again using the estimated efficiency I calculate the parasitic power in the TES (using Side1 pE). I find the following:
| Parasitic power in one channel versus applied HV bias |
|---|
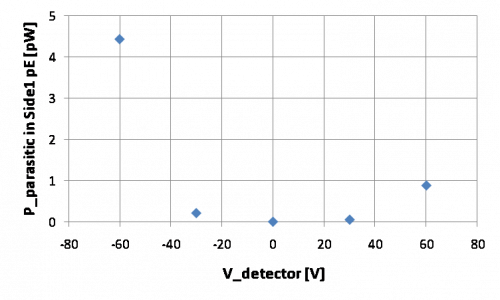 |
| From shot noise calculation. Assume 0.01 single-channel phonon collection efficiency |
The result is hugely different from that derived from baseline shifts and IbIs - at +/- 30 V these estimates are two orders of magnitude smaller. The shape is also different - in the parasitic power plot from IbIs the curve is very nearly quadratic (although asymmetric - it's quadratic on each side). Hear however the parasitic power seems to increase as the 4th power of HV.
These calculations should be re-examined to make sure they're correct.
Calibration
K - 10.367 keV
L - 1.3 keV
M - 0.16 keV
Pl/Pk = 0.12
Pm/Pl = 0.17
Ongoing notes on energy and position reconstruction:
- HV Pulse Shape Analysis. First looks at pulse shape variations.
- Pulse Shapes Cont. Returned to look at pulse shapes again.
- HV2 Data Analysis. Position reconstruction etc.
- 2-template HV work. Improvements in OF fitting with multiple templates.
Phonon Collection Efficiency
Phonon collection efficiency was estimated using the following strategy:
- Identify 10.37 keV activation line in 2-sided HV=0 data
- Take data at two different sets of QET biases, to verify that the dP/dI calculations from IbIs are consistent
- Use symmetry arguments to infer energies absorbed in the three non-connected channels, to get an estimated 12-channel collection efficiency
- assumed that there is a z-bias because we trigger on Side1 pF, so events far from that channel are under-sampled
- but assume x-y symmetry (since Side1 pF is in the center)
- do not apply position cuts
- assume each of the two unconnected inner-ring channels on Side2 has the same efficiency as the connected one
- assume the unconnected Side2 pF (inner) channel has the same efficiency as Side1 pF scaled to the ratio of the Side2-to-Side1 inner ring channels
| Absorbed phonon energies from 10.37 keV events, November 11 data, standard QET biases (average prefactor = 0.20) | ||
|---|---|---|
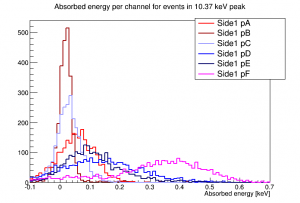 | 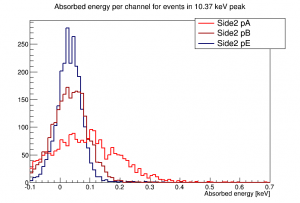 | 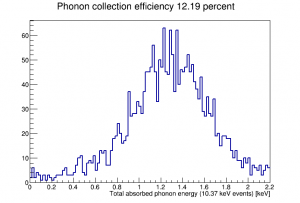 |
| Resulting 12-channel phonon collection efficiency: 12.19% | ||
| Absorbed phonon energies from 10.37 keV events, December 2 data, higher QET biases (average prefactor = 0.32) | ||
|---|---|---|
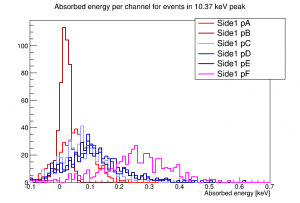 | 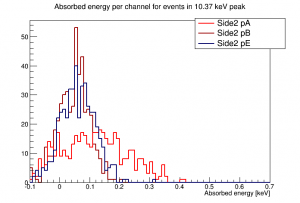 | 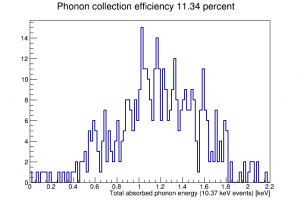 |
| Resulting 12-channel phonon collection efficiency: 11.34% | ||
A further attempt is being made to estimate uncertainties in these calculations based on the uncertainties in the dP/dI values derived from IbIs. See this phonon collection efficiency analysis note
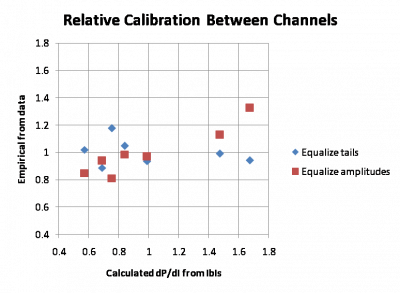
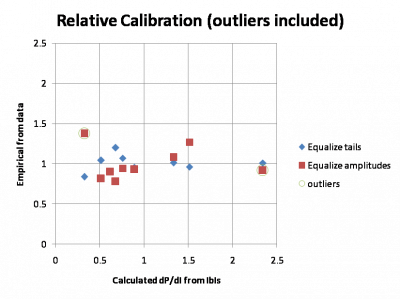
The plots below show a comparison of the calculated dP/dI values with relative calibrations as determined from processed data by Nick. If two untrustworthy channels are removed there's reasonable correlation between the amplitude-matching result and the dP/dI calculations. There's no correlation between the tail-matching and dP/dI. But even in the amplitude-matching case the empirical relative calibrations span a much smaller range than the dP/dI results.
 |  |