Run 62 Channel Balancing
Here I will outline the channel balancing process I used for Run 2 data. The following is a summary of balancing for the 50V Si data.
The Final calibration numbers are as follows:
| PA | PB | PC | PD | PE | PF |
|---|---|---|---|---|---|
| 0 | 1.06343 | 0.58770 | 1.30532 | 1.18228 | 0.86128 |
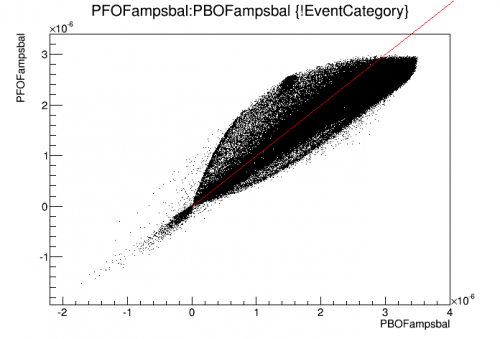
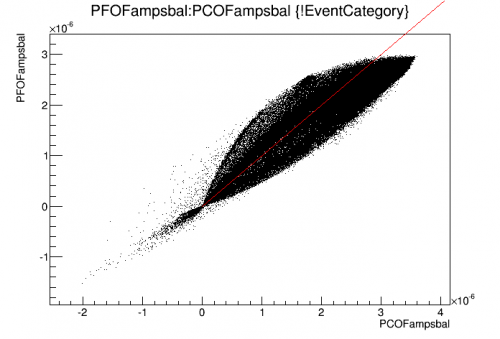
The balancing procedure went as follows: 1. Plot PFOFamps vs. Each other channel individually 2. For each channel find the slope of a line of symmetry. This is the balance factor for each channel 3. Normalize each balance factor to 1. 4. Multiply the given channels by the normalized balanced factors.
Here are some of the resulting plots plotted red line with a slope of 1.
| PF:PB | PF:PC |
|---|---|
 |  |
| PF:PD | PF:PE |
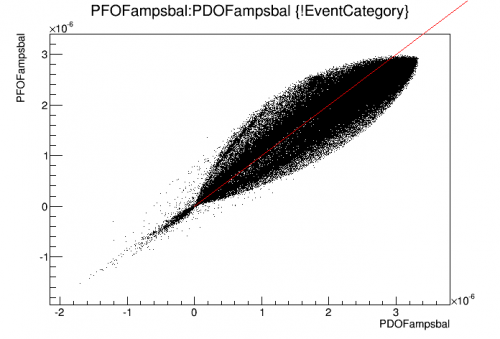 | 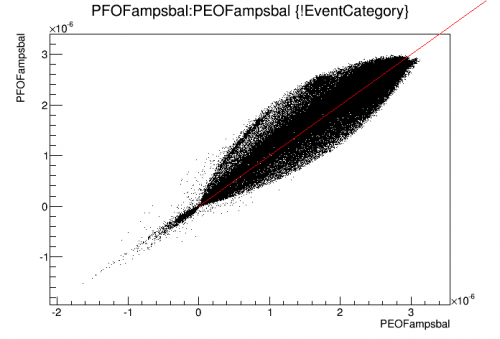 |
These plots are only changed by plotting the balanced versions of the optimal filter amplitudes for each channel. The overall plots of PTOFamps get changed by the reprocessing. The Americium calibration for the unbalanced and balanced data are plotted below.
| Unbalanced | Balanced |
|---|---|
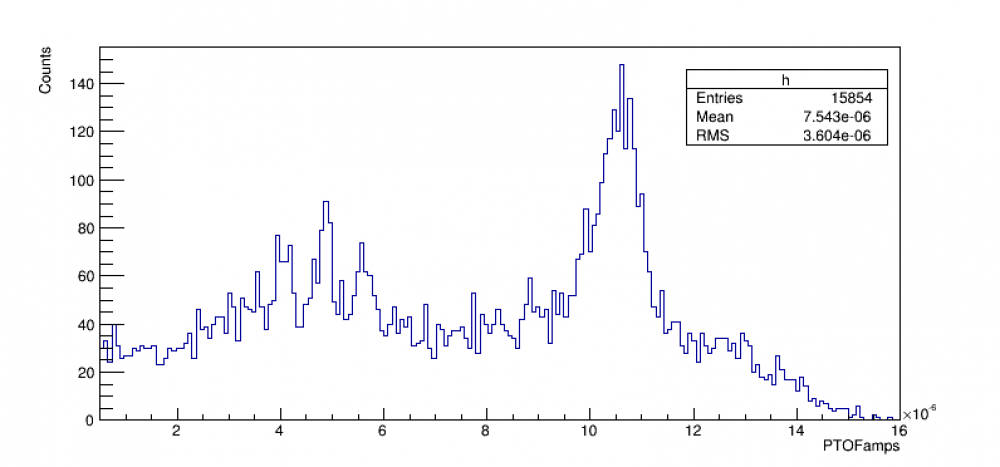 | 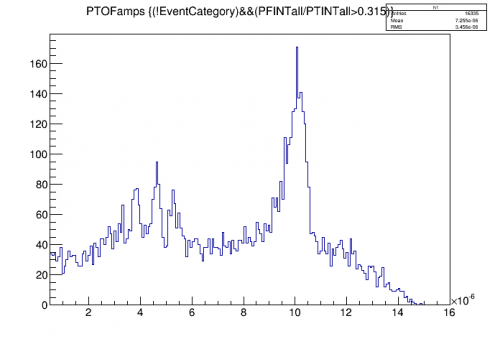 |
I fit the 60 keV peak with a constant plus a gaussian for both the balanced and unbalanced plots and got the following parameters:
Fit Equation: a + b*exp((x-c)^2/2d^2)
Parameters:
| Unbalanced | Balanced | |
|---|---|---|
| a | 30.9 +/- 2 | 42.4 +/- 5.3 |
| b | 81.3 +/- 4.5 | 100.0 +/- 5.6 |
| c | 10.5e-6 | 10.0e-6 |
| d | 3.5e-7 +/- 2.3e-7 | 3.5e-7 +/- .4e-7 |
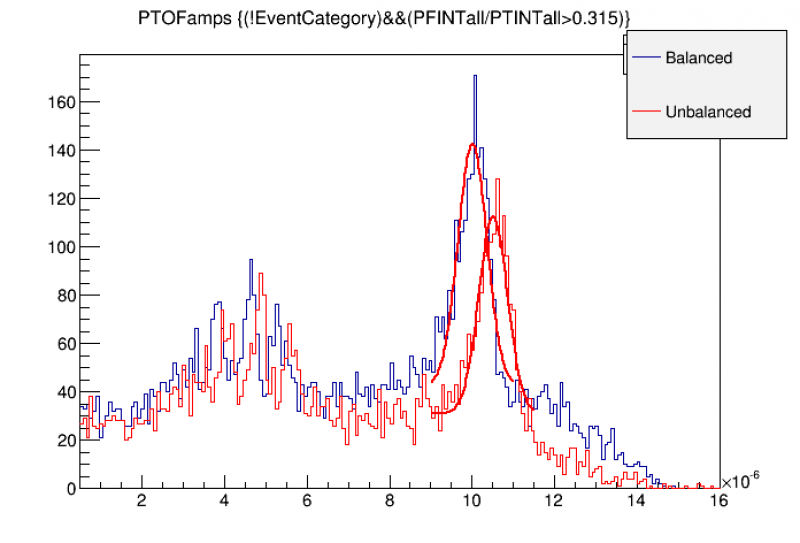
Balancing appears to have raised the overall background by 11 counts, the 60 keV peak grew by nearly 20 counts and was shifted left in PTOFamps by 0.5e-6, and the overall peak resolution remained constant.