50V data taken on 2017 April 27 - May 1
- Vdetector = ~49 V according leakage measurement
- Cuts to remove randoms and bad pulses via baseline difference
- Using 58 hrs of data; Have 101 hrs of data; expect about 134 hours more by 1 week from now
| 50V Bias: Timing/Energy Collage |
|---|
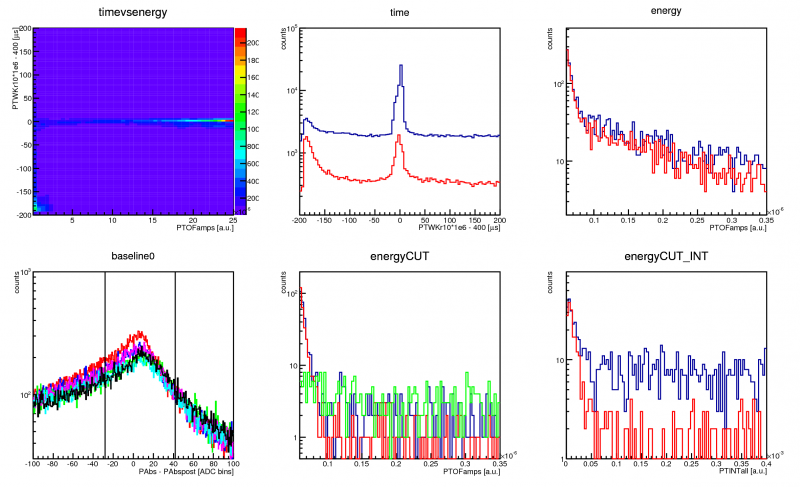 |
| Top Row: (left) timing & PTOFamps energy, many HE coincident events seen; (middle) projection on time axis for full OF energy range (blue) and < 5e-6 (red); (right) energy spectrum near threshold when selecting on coincident peak (blue) or away from it (red) |
| Bottom Row: (left) difference in pre-pulse baseline and post-pulse baseline for each channel; (middle) energy spectra in PTOFamps with that cut, same as above except green is PTOFamps0; (right) energy spectra in integral PTINTall |
The background level is probably similar to what was expected after a cut for the bad pulses. Going to fine tune the bad pulses cut to make sure we get rid of square pulses and the like. Also, trying to implement a cut on the triggering signal (to reject pileup). These tunings may require looking at pulses, for that we'll look at ones that are away from the coincident region so that we can be unbiased.
50V data taken on 2017 April 27 - May 8 (morning)
- Vdetector = ~49 V according leakage measurement
- Cuts to remove randoms and bad pulses via baseline difference and via pre-pulse standard deviation
- checked neutralization by restricting to 10 hrs since bake time, no dramatic effect but will check further
- The time-coincident data is slightly higher than the accidentals, but no peaks identified as of yet, looking into background rejection, time resolution increase, and energy resolution increase
- Using 174 hrs of data; could have about 140 hours more by 1 week from now
- Recommend small upgrades when I return: increased Pu/Be shielding, decreased trace length and 1 more week of data (finishing May 18)
- checked neutralization by restricting to 10 hrs since bake time, no dramatic effect but will check further
| 50V Bias: Timing/Energy Collage (updated) |
|---|
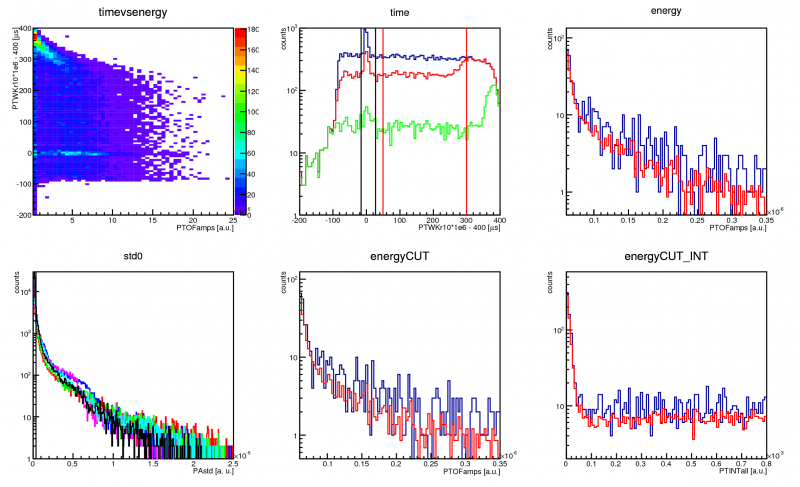 |
| Top Row: (left) timing & PTOFamps energy with baseline difference cut applied, many coincident events seen, accidental region flat-ish except near edges; (middle) projection on time axis for full OF energy range (blue), < 5e-6 (red), and the analysis range < 0.35e-6 (green) plots have a minimum of 0.1e-6 in PTOFamps; (right) energy spectrum near threshold when selecting on coincident peak (blue) or away from it (red) |
| Bottom Row: (left) pre-pulse standard deviation for each channel; (middle) energy spectra in PTOFamps with that cut (pre-pulse STD), colors same as above; (right) energy spectra in integral PTINTall |