Table of Contents
First QET-bias scan: single channel varied over wide range
To study whether the dP/dI calculations from IbIs translate correctly to data, I took several 0-volt datasets with a variety of QET biases on DCRC1pA/Side1pE. The intent was to scan a range of calculated dP/dI values then look at the position of the 60keV peak in that channel to see if there was a correspondence.
The nominal dP/dI choices were prefactor×Ibias = 10,20,30,40,50 μA. When multiplied by the shunt resistance this gives the effective voltage bias on the TES, and thus the dP/dI value, i.e. the amount of absorbed phonon power per μA change in TES current.
r62_ibis_study_prefac.png r62_ibis_study_ibprefac.png
| IbIs for DCRC1pA / Side1 pE | ||
|---|---|---|
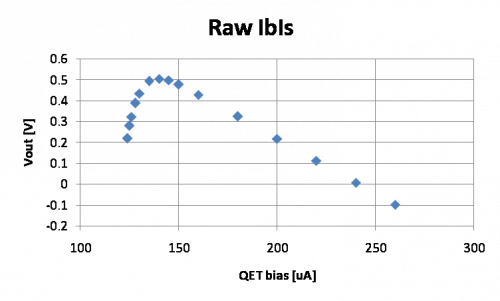 | 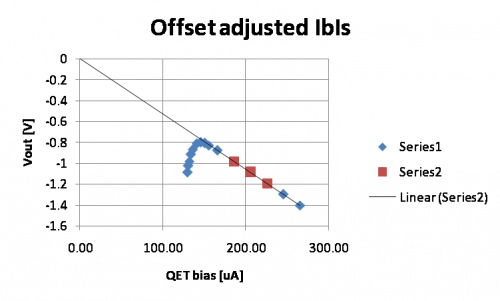 | 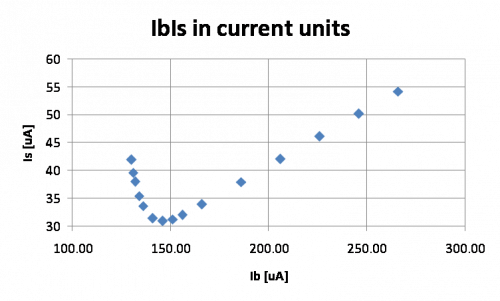 |
| Raw. | Offset adjusted. An offset of -6.1 μA was found in the QET bias. The voltage offset is found by extrapolating the normal region of the curve. | In current units. |
Note that typically the prefactor is calculated from the raw IbIs curve. The offset is found either by extrapolating the normal part or by continuing the curve down to zero bias. Data is taken to the bottom of the transition region to find the point at which the TES falls into superconducting. Then the parasitic resistance (or rather the presumed slope in the s/c region) is adjusted so that the prefactor matches the predicted behavior, so that it is approximately 0 where the curve falls into superconducting. This is typically not quite the same as the actually measured slope in the s/c region.
Below we calculate various physical quantities and adjust the offset and parasitic resistance in a different way:
| Voltage across the shunt resistor | Voltage across the TES |
|---|---|
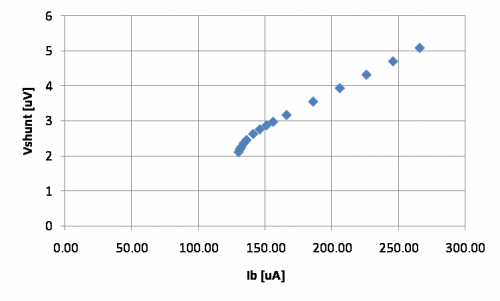 | 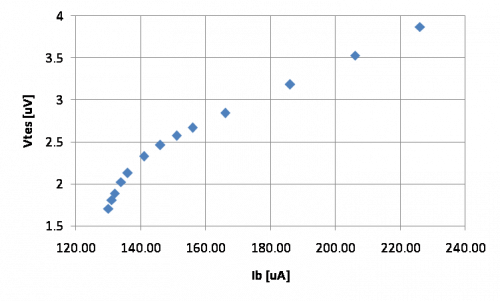 |
| From Ib and Is, and given a value for Rshunt, the voltage across the shunt can be calculated. Note that the normal part forms a line that intersects the origin. | If we know the parasitic resistance, we can subtract the voltage across Rpar to get Vtes. |
| TES resistance | TES power | Power versus resistance |
|---|---|---|
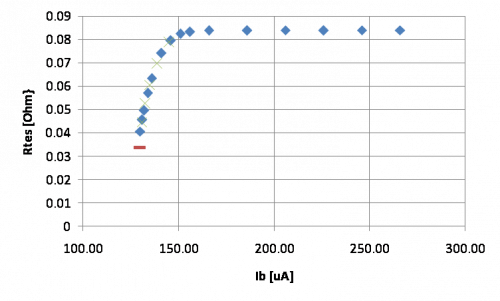 | 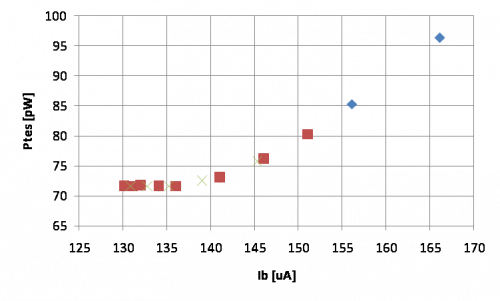 | 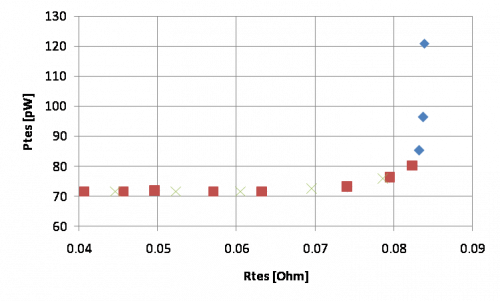 |
| Red = theoretical minimum operating resistance (Rshunt+Rpar) The voltage offset is chosen so that Rtes is constant in the normal part of the curve. This gives a somewhat different offset (64 mV higher) from what extending the curve to zero would give. | Red = transition region (where the Is/Ib slope is negative) The parasitic resistance is adjusted so that the TES power is flat in the lower part of the transition. This gives a somewhat different value (9.8 mΩ) from what would be estimated from the s/c dropoff point (11.5 mΩ). Note that the power is flat only over a certain region; there's an intermediate region between transition and normal. | Red = transition region (where the Is/Ib slope is negative) |
| dP/dI prefactor | Prefactor × Ibias |
|---|---|
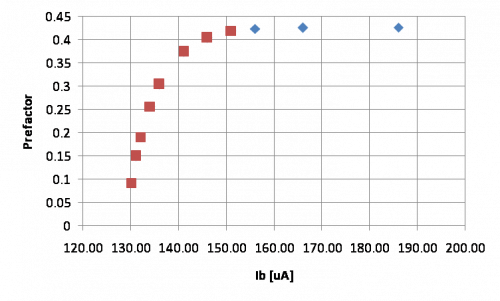 | 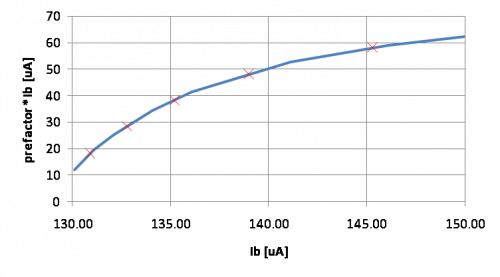 |
| Red = transition region (where the Is/Ib slope is negative) | Red Xs = the five chosen operating points for the IbIs study |
Note that the operating points were originally intended to produce prefactor×Ibias values of 10-50 μA. The values shown above are rather different. Originally the parasitic resistance was chosen to match the s/c falloff point, but in the above analysis Rpar is chosen to flatten the TES power.
| QET bias setting [μA] | prefac*Ib, s/c falloff method [μA] | prefac*Ib, flat TES power method [μA] |
|---|---|---|
| 124.8 | 10 | 18.1 |
| 126.7 | 20 | 28.5 |
| 129.1 | 30 | 38.3 |
| 132.9 | 40 | 47.9 |
| 139.2 | 50 | 58.0 |
The above unfortunately shows that the dP/dI calculations can vary significantly depending on how the IbIs curves are massaged.
QET bias scan data
| Total Phonon OF amplitude versus Integral amplitude |
|---|
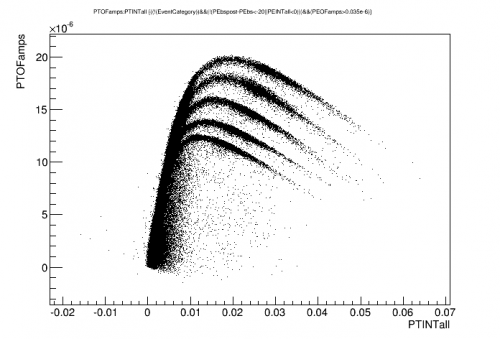 |
| All 5 pE QET bias settings included. |
| pF phonon partition versus energy |
|---|
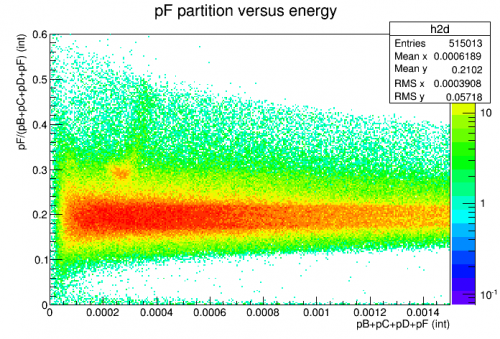 |
| Here all data is included but the sum and the partition are calculated with pE omitted As before the pF partition can be used to select Am events |
| pE versus energy | |
|---|---|
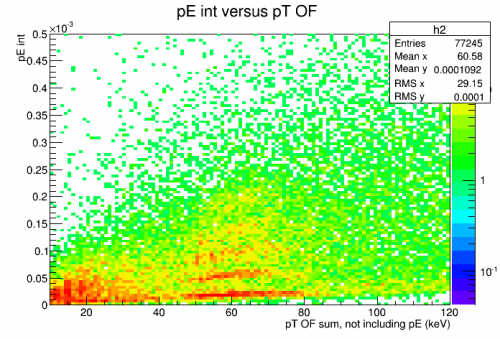 | 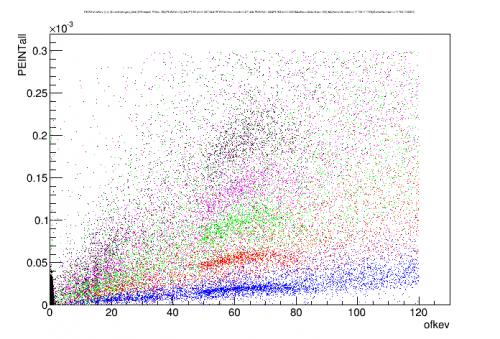 |
| All data is included. The sum (x-axis) omits pE. Five lines represent the 5 pE QET bias settings. | |
| Total phonon OF spectrum |
|---|
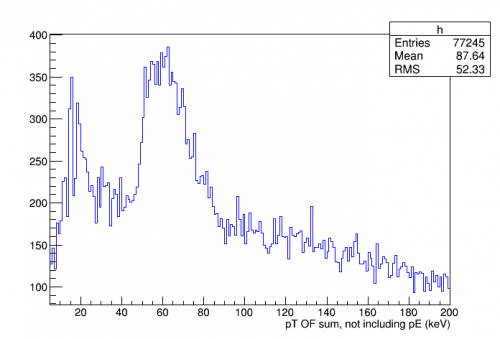 |
| Here the OF amplitude (which at 0V is close to linear with the integral amplitude in this energy range) is shown. This is used to make a (wide) cut around the 60keV line as a selection for the following plots. |
| pE peaks at various QET biases |
|---|
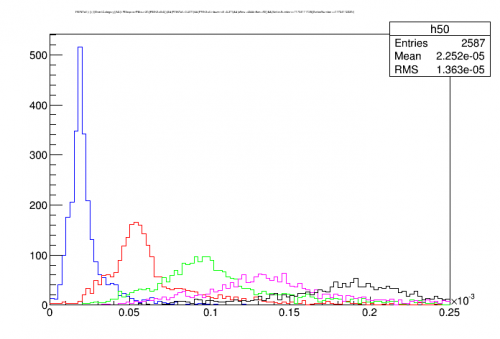 |
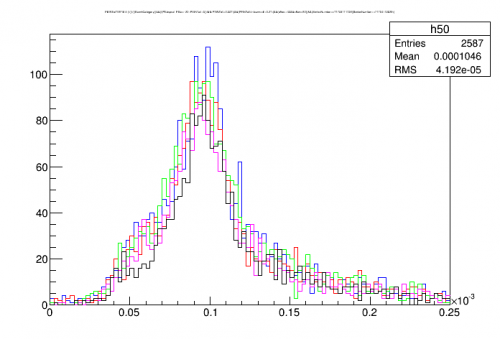
| With the cuts used above the pE 60keV peaks are plotted separately for each QET bias setting |
| pE peaks with relative calibrations applied | |
|---|---|
| From the plots above peak centers are estimated and used as relative calibrations to replot the five peaks together |
|
 | 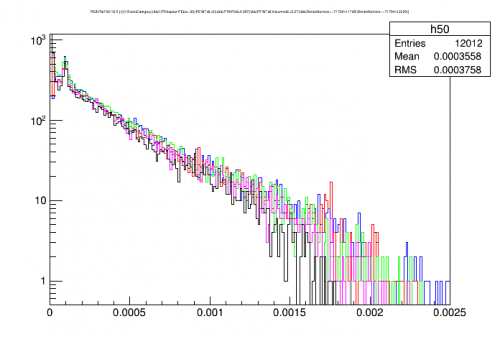 |
| Near the 60keV peak the relatively calibrated spectra line up well. | Out to higher energies the spectra also mostly agree. The exception is that the black curve, which is the lowest QET bias / most sensitive setting, shows some attenuation at the highest energies. |
Comparing dP/dI calculations to data
| Comparing dP/dI calculations with relative pulse sizes in data | |
|---|---|
| Gain, data versus theory | Relative calibration, data versus theory |
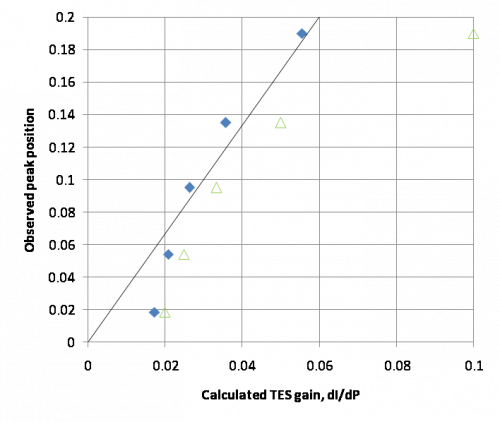 | 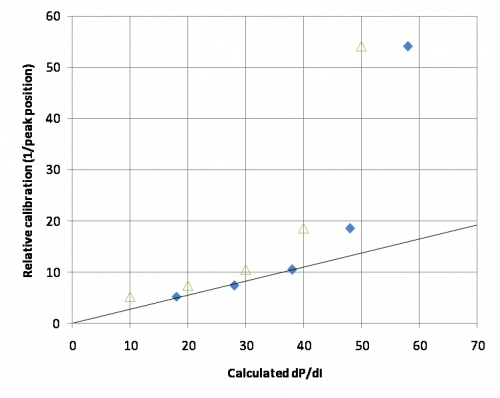 |
| Blue = TES-power-equalizing dP/dI values Green = s/c-falloff-point dP/dI values The line is fit to the blue points | Blue = TES-power-equalizing dP/dI values Green = s/c-falloff-point dP/dI values The line is fit to the first three blue points |
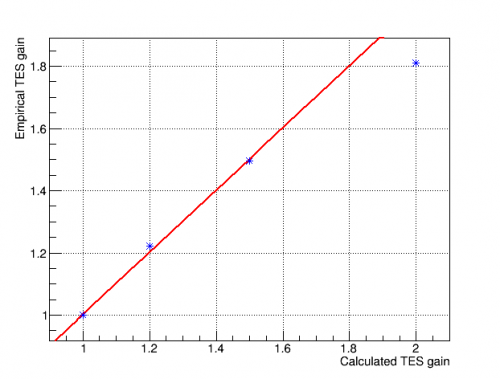
| The calculated dP/dI values are a poor fit to the data overall. One interpretation is that the two highest QET bias settings (the lowest two points in gain plot, the highest two points in the relative calibration plot) do not fit the theory because they are too high in the transition, where the TES is partially normal and where the TES power is no longer constant with bias. If this is the case then the TES-power-equalizing method for calculating dP/dI seems to be a somewhat better fit to the data. However neither is a particularly good fit even to the three or two lowest QET bias settings. |
|
Corrected dP/dI calculation for non-constant transition power
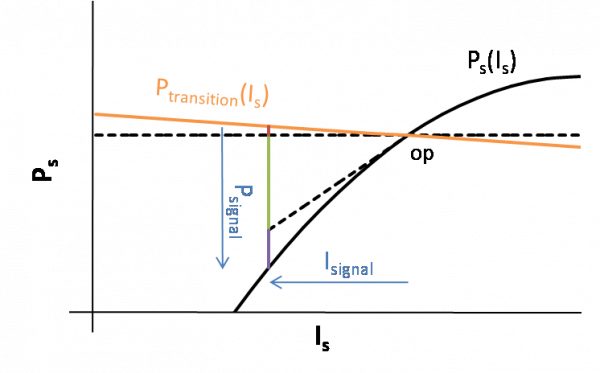
The standard method of calculating dP/dI from IbIs curves assumes that the power required to keep the TES in transition is constant over the transition. This is not exactly true, since the temperature of a TES in transition will vary somewhat with its resistance. Therefore there should be a correction to dP/dI based on the non-constant transition power. By measuring the slope of the IbIs curve at the operating point we can estimate this correction. A derivation of the technique is in an analysis note.

Adding the correction for non-constant transition power generally makes the dP/dI values larger as compared to the original calculation. The figure above shows the empirical versus calculated gain in the standard case (green) and the non-constant-Ptrans-corrected case (red) (and also the case where the standard equation is used but the assumed Rpar is adjusted to force Ptrans to be constant). The lower points (which represent higher positions in the transition) are improved in that they don't stray as far from the linear trend. But the upper points (lower in transition) still seem to deviate significantly from expectation.
Note that the slope of the lines in this plot are proportional to phonon collection efficiency, so the corrected dP/dI calculation will tend to make PCE estimates higher.
Adding the nonlinear correction
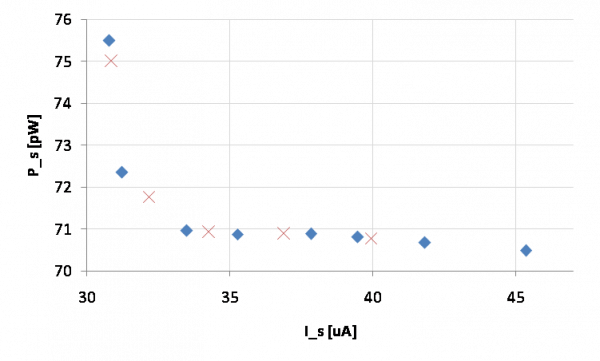
In general I have not been including the nonlinear term in PCE measurements. Every time I've checked to see how significant that term is for the energies I'm looking at it winds up being less than a 2% effect. The nonlinear term is only significant for very high energies.
However the nonlinear term becomes more important at low points in the transition. For most PCE measurements I've had the TES's set near the middle of the transition. But for the low settings in the QET bias scans it turns out that the nonlinear term becomes important. The nonlinear term is a positive term that gets added to the prefactor. It is essentially proportional to the ratio of the average signal current in a pulse to the bias current. The linear prefactor gets closer and closer to zero as you move further down the transition - but the nonlinear correction actually increases as you move down the transition, since dP/dI is getting smaller, so that the signal current gets larger for a given incident power.
Using the dP/dI formula I estimated the size of the nonlinear term and made an approximate correction, as shown below.

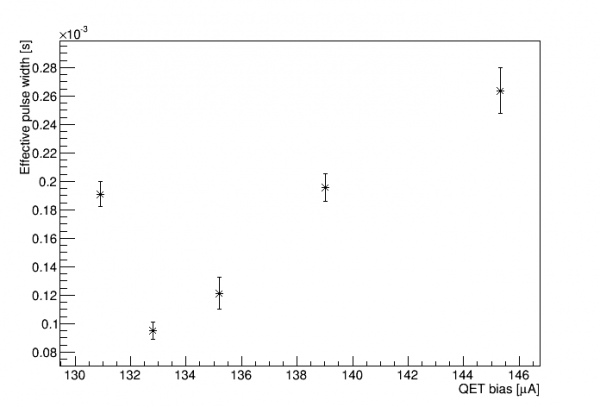
Combining corrections
 |  |
 |  |
Second QET-bias scan: six channels varied over narrower range
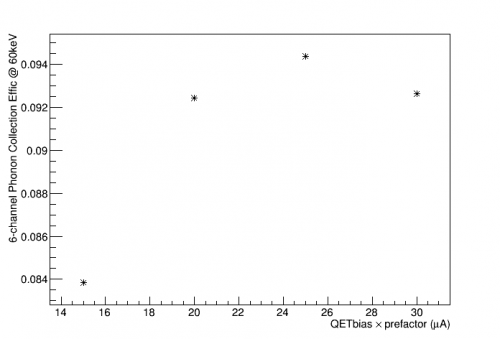
A second QET bias scan was done over 2017 May 23-4. The plan in this case was to modify the QET biases of all channels at once such that their P/I values matched for each subset, and the focus was on the lower part of the transition (since the previous study seemed to suggest efficiency loss at points too high in the transition).
The data was taken using the HV board (with all six Side 1 channels read out) at 0 V. IbIs data was taken and analyzed so that QETbias*prefactor values could be selected by setting the QET bias. The values of QETbias*prefactor chosen for the scan were 30,25,20,15,10,5 μA.
Data were taken for two hours at each value, in decreasing order. But shortly after the 10 μA data set began all channels railed. It was apparently the case that all channels simultaneously (or nearly so) fell out of transition into superconducting. When the channels were observed the next morning it was found that all of the IbIs curves had shifted - these curves had been quite stable for many weeks - such that it appeared that the overall parasitic power had decreased. Since the channels were set low in their transitions this decrease in parasitic power was apparently enough to drop them into superconducting (i.e. the QET bias was no longer sufficient to provide the power to heat the TES into transition). This is similar to observations from Run 61 that IbIs properties were less stable, and particular the bias power seemed to shift, if the TESs were taken in and out of s/c than if they were kept constantly in transition. It appears that a sort of metastable low-P_parasitic state can occur shortly after a TES is taken from s/c to transition, but then after a while (perhaps 2 hours) the system reverts to a standard state. There was also some indication that a single channel falling into s/c might affect the P_parasitic state of all the channels. It's also the case that the magnitude of the P_parasitic shifts seems to vary with DCRC.
In the end this study uses only the QETbias*prefactor values of 30,25,20,15 μA. Lower settings appear to be unstable. (10 μA data was later achieved for about 1 hour. Also stable running was achieved at 10 μA in the previous study, but that was a single channel. We don't seem to be able to achieve stability with all channels at 10 μA.)
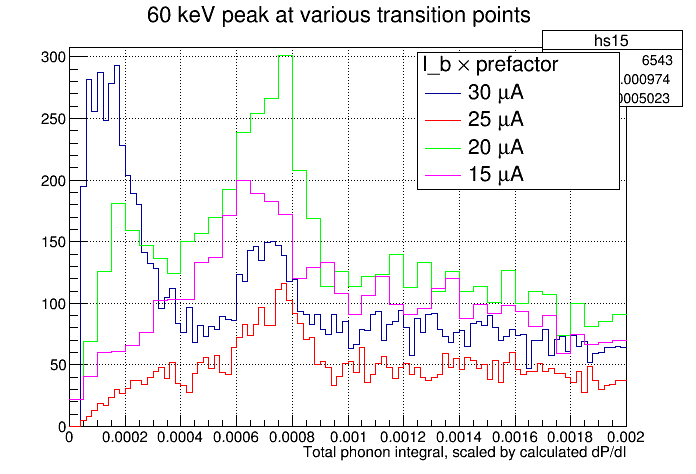 |
| Preliminary plot of the PTINTall quantity scaled by the nominal dP/dI TES gain as calculated from IbIs. The peaks approximately line up. This is approximate because PTINTall adds the channels without proper balancing and because one channel was not set at exactly the same dP/dI point. |
 |  |