In the first look at 50V data these plots were produced:
| Am-241 Spectrum | pTotal Integral versus nonlinear calibration to Am lines |
|---|---|
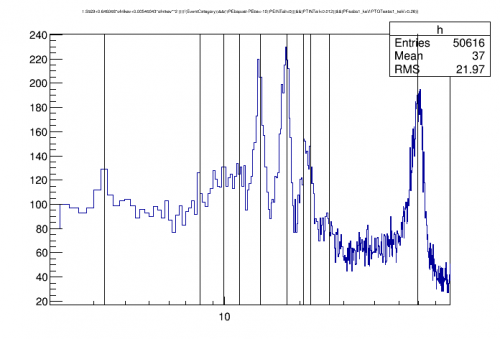 | 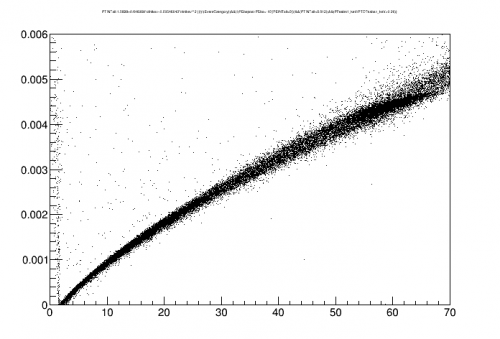 |
| This is a quadratic fit to the OF pTotal amplitude, using several identifiable lines. But it is not constrained to go through the origin, and it suggests that low-energy events are producing nearly zero pulse. | Here the integral pTotal amplitude is plotted versus the calibrated energy shown on the left. For some non-zero energy the integral amplitude falls to zero. |
If the line identifications are correct in the plots above it seems to suggest some significant falloff in signal at low energies. Below is a more careful look.
Below is a plot showing that the lines are also clearly resolved in integral quantities. So we can avoid the inherent nonlinearities in the default single-template OF fit. Recall that in this setup there were 5 channels read out, all the Side 1 channels except the outer ring, pA.
| Energy absorbed in 5 channels, 50V data |
|---|
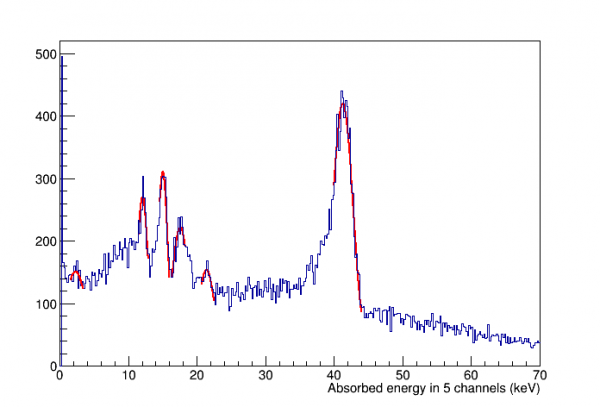 |
| Sum of the pulse integrals calibrated to absorbed energy using dP/dI calculations As described previously a cut has been applied to select high pF partition events, i.e. low-radius events. The Am peak events seem to all be high in pF. |
Below is a list of peaks from highest to lowest:
- 59.537 keV gamma. There is a low-energy tail which I've avoided in the fit
- 26.345 keV gamma
- 20.785 keV x-ray. There is supposed to be a second peak about half as strong at 21.31, which looks like a shoulder - I've tried to fit to the lower peak only.
- 17.75 keV x-ray. There is supposed to be a second peak about a third as strong at 16.95 - I've avoided the lower peak in the fit.
- 13.942 keV x-ray
- 3.262 and 3.436 keV x-rays, of about equal strength. Note that combined these are supposed to be about a third as strong as the 13.942 keV line
From these fits we can calculate the phonon collection efficiency for each line. We measured the detector bias to be 49.2 V. I assume that the energy per electron/hole pair in silicon is 3.8 keV. From this I calculate a Luke gain of 13.95.
| 5-channel Phonon Collection Efficiency for identified lines |
|---|
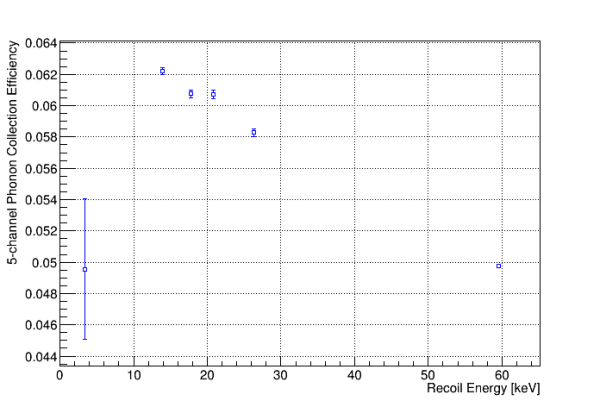 |
As I have noticed previously the 20.785 keV line seems to be an outlier. If this line and the 3.3 keV line are ignored, there is a smooth trend. There seems to be higher phonon collection efficiency at lower energies, which may be the result of local TES saturation in high energy events.
But the 3.3 keV line has, apparently, significantly lower phonon collection efficiency. Is this actually a falloff in charge carrier production instead of phonon collection efficiency? If this were the case it would imply that the electron/hole production energy rises from 3.8 to about 5.1 keV as the recoil energy falls to 3.3 keV.
Or is there a more mundane explanation? 3.3 keV events from the Am source interact very close to the surface - the penetration depth in Si is a few μms. Is this the reduced yield from surface events which plagued CDMS2 and motivated the iZIP? If the average ionization yield of the 3.3 keV Am events is only 0.76 it would explain the falloff. The next higher identified line at 14 keV penetrates much deeper, 100s of μms.
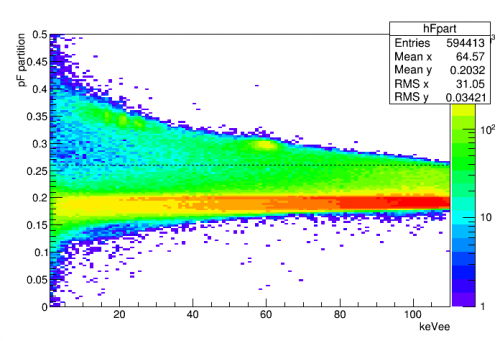
In the zero-volt data we must take into account that events near the surface of Side2 will not illuminate the two sides of the detector evenly. But with high HV applied I assume that there is mostly uniform illumination between the sides because most of the phonons are Luke phonons generated from a column which spans the full z-range.
| pF Energy Partition versus Energy |
|---|
 |
| Extrapolated 12-channel Phonon Collection Efficiency for identified lines |
|---|
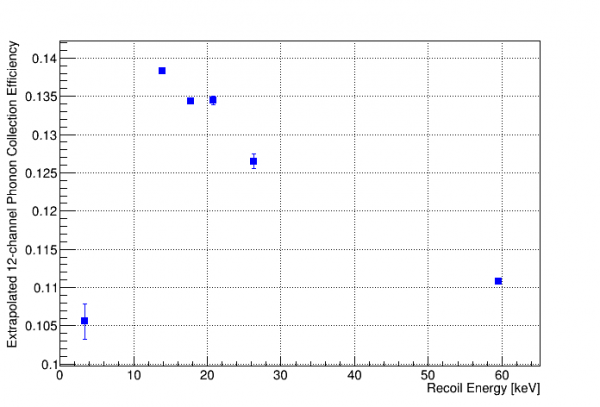 |
| To extrapolate to 12 channels, first the missing pA amplitude was estimated by measuring the ratio between Side1 pA amplitudes and Side1 pB amplitudes in the 2-sided data. In that data this ratio was 0.73 and constant with energy. Then the total Side1 energy was doubled under the assumption that the two sides receive equal illumination from (mostly Luke) phonons with 50V bias. |
| Extrapolated 12-channel Phonon Collection Efficiency for identified lines |
|---|
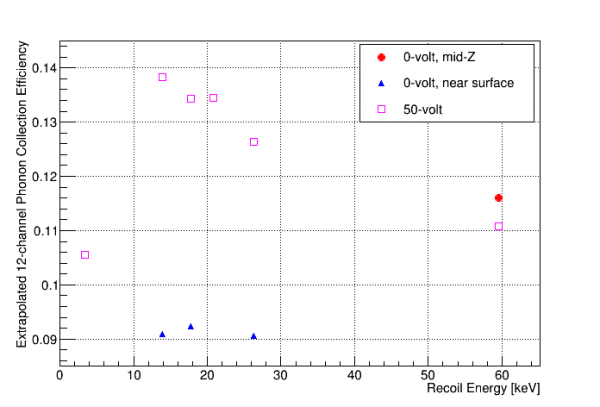 |
| Above we combine these 50V results with measurements from 2-sided zero-volt data. |
| Extrapolated 12-channel Phonon Collection Efficiency for identified lines |
|---|
 |
| Above we combine 50V, 20V, and 2-sided zero-volt data. Here it is plotted against total phonon energy |
| Extrapolated 12-channel Phonon Collection Efficiency for identified lines |
|---|
 |
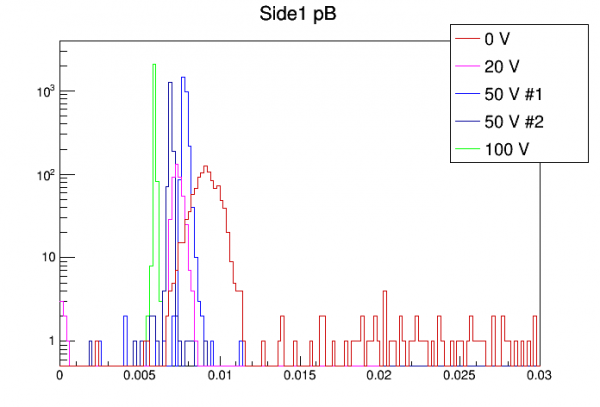
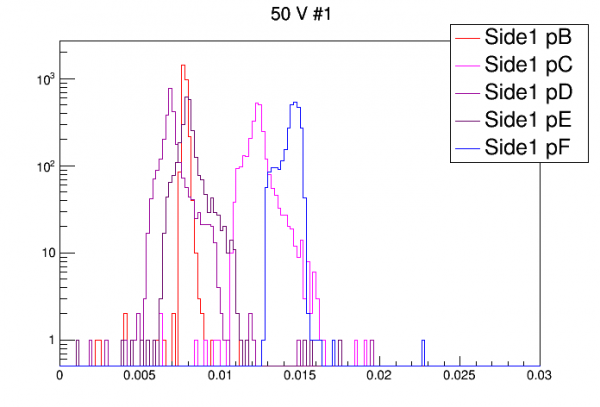
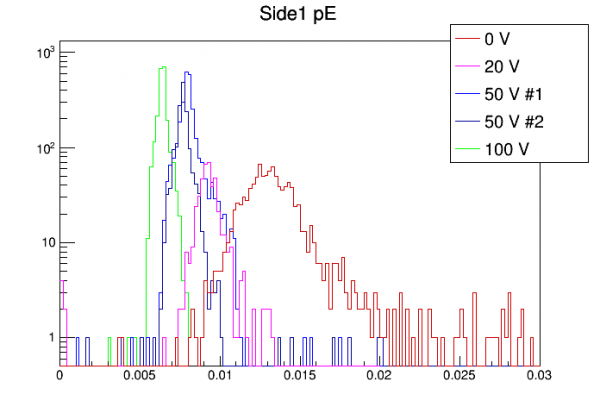
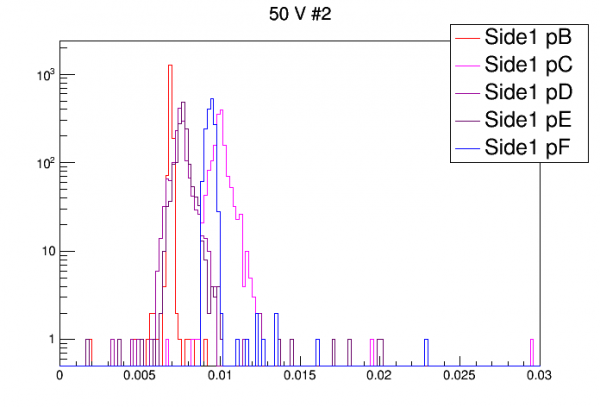
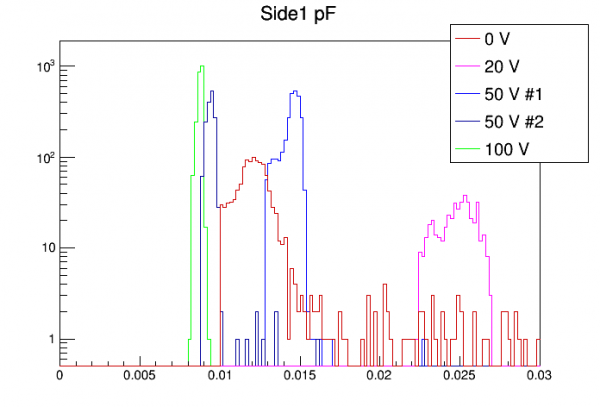
| Above we combine 100V, 50V (two datasets), 20V, and 2-sided zero-volt data, plotted against total phonon energy 2-sided and 100V cases seem lower than the others |
 |  |
|
 |  |
|
 |  |
|
 |  |
|
 |  |