Cuts applied to remove randoms, remove muon tails, and threshold cut to remove noise triggers
| pTotal Integral Spectra, 1-sided 0-volt data |
|---|
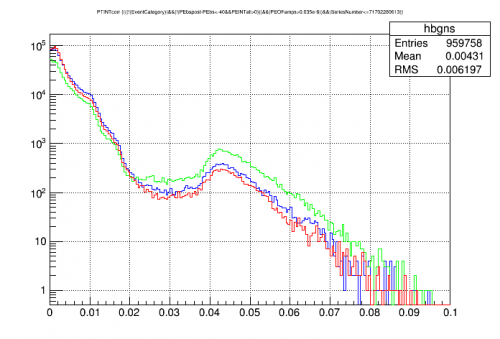 |
| Blue = no external source, no shield Red = Ba source, no shield Green = no external source, shield |
no apparent lines, 60 keV or otherwise, in above spectra
| pTotal Integral Spectra, 1-sided 0-volt data Normalized to peak of “hump” |
|---|
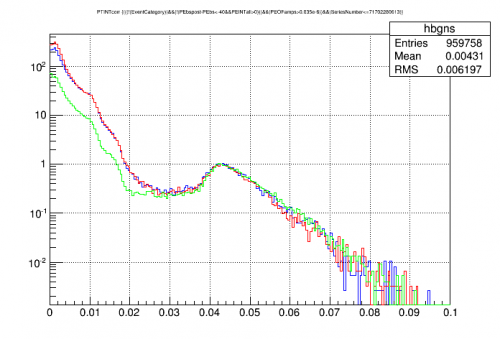 |
| Blue = no external source, no shield Red = Ba source, no shield Green = no external source, shield |
| pTotal Integral Spectra, 1-sided 0-volt data Normalized to event rate |
|---|
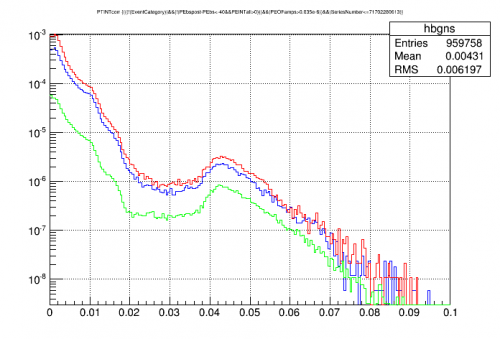 |
| Blue = no external source, no shield Red = Ba source, no shield Green = no external source, shield |
| pTotal Integral Spectrum, with shield, 1-sided 0-volt data |
|---|
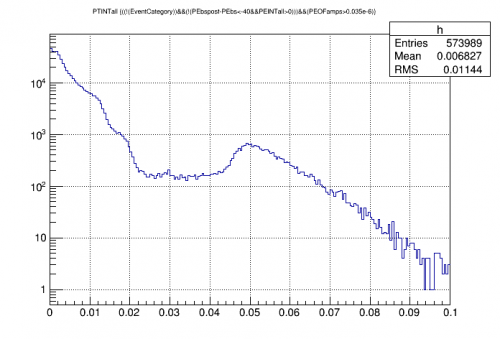 |
with HV#2, the hump peak was around 115-120 keV. The hint of a peak near 0.028 is around the right place for 60 keV.
| pTotal OF amplitude versus pTotal Integral |
|---|
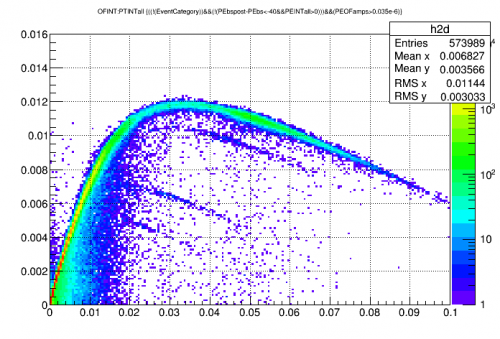 |
above plot shows that OF amplitude quickly stops working when the integral exceeds around 0.01
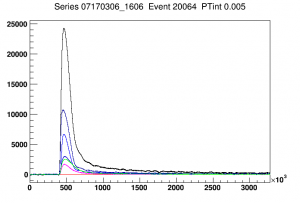
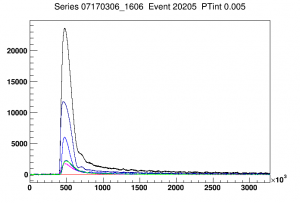
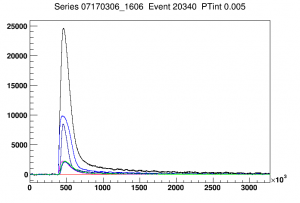
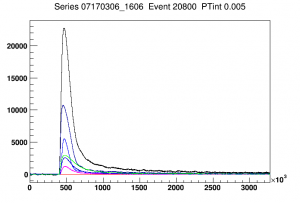
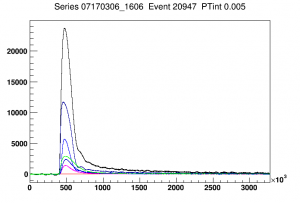
| Events with pTotal Integral = 0.005 | ||||
|---|---|---|---|---|
 |  |  |  |  |
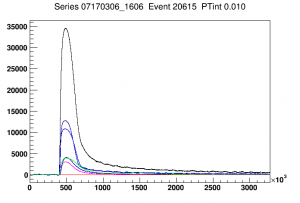
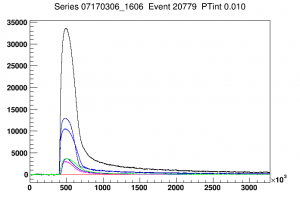
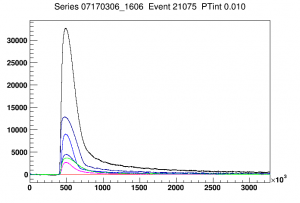
| Events with pTotal Integral = 0.010 | ||||
 |  |  |  | |
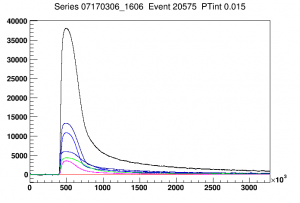
| Events with pTotal Integral = 0.015 | ||||
 |  |  | ||
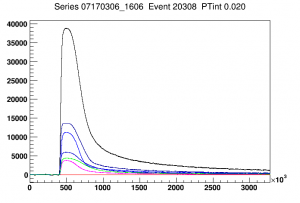
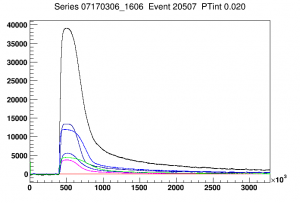
| Events with pTotal Integral = 0.020 | ||||
 |  |  |  | |
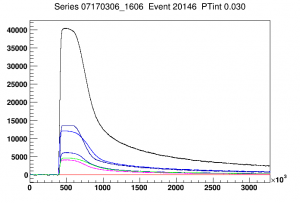
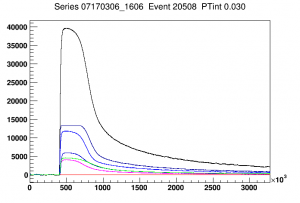
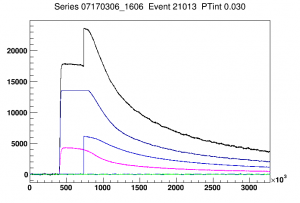
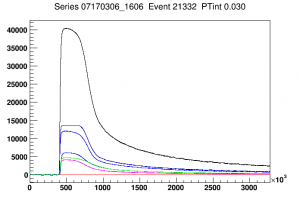
| Events with pTotal Integral = 0.030 | ||||
 |  |  |  | |
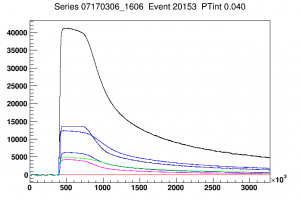
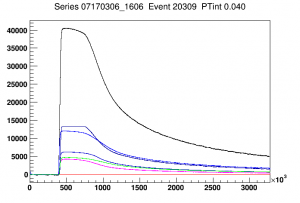
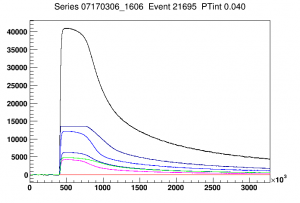
| Events with pTotal Integral = 0.040 | ||||
 |  |  |  | |
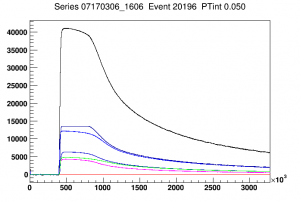
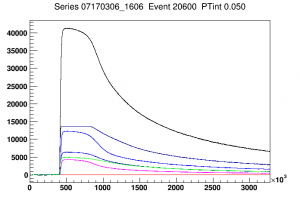
| Events with pTotal Integral = 0.050 | ||||
 |  |  |  | |
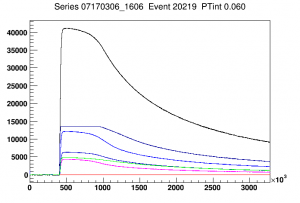
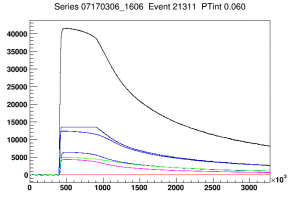
| Events with pTotal Integral = 0.060 | ||||
 |  |  | ||
| Event with pTotal Integral = 0.080 | ||||
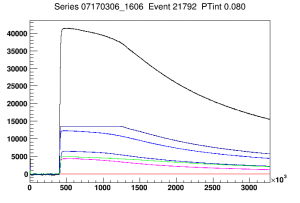 | ||||
| red = Side1pA (not used); magenta = Side1pB; blue = Side1pC; dark blue = Side1pD; darker blue = Side1pE; green = Side1pF | ||||
The above plots show that the dP/dI are not very balanced between the channels: pC and pE are always higher than the others.
At integrals as low as 0.01 there are already clear indications of TES saturation, which probably results in poor OF fits. At integrals of 0.03 and above, at least one channel is also showing ADC saturation, which will skew the integral quantities.
| Tailfit Amplitude Spectrum, 1-sided 0-volt data |
|---|
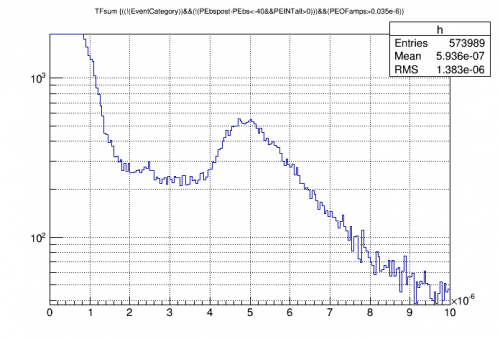 |
| Above is a spectrum based on the sum of tail-fit amplitudes. The two highest (most saturated) channels are omitted. Peak near 2.4e-6 is probably 60 keV. |
| pB Tailfit Amplitude Spectrum, 1-sided 0-volt data |
|---|
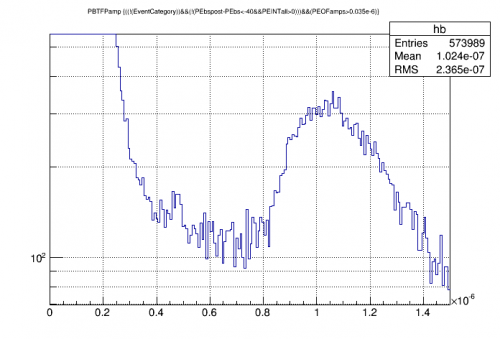 |
| Peak in pB tailfit alone is perhaps stronger |
| pB Tailfit Amplitude versus Integral Amplitude |
|---|
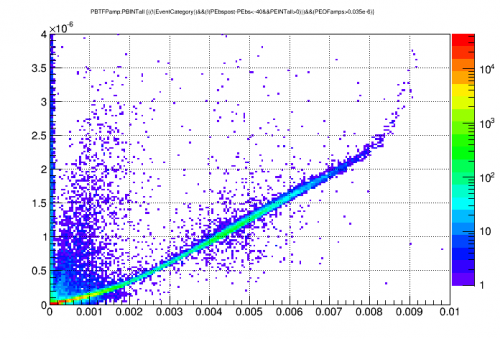 |
| Tailfit amplitude is probably more sensitive than integral |
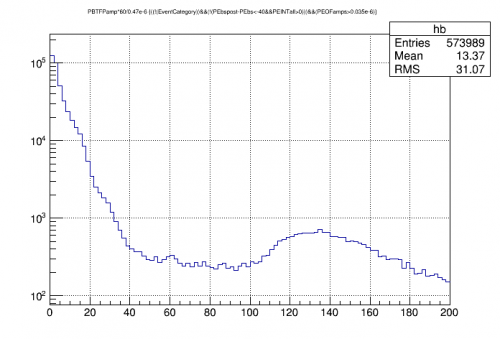
| pB Tailfit Amplitude with approximate keV calibration |
|---|
 |
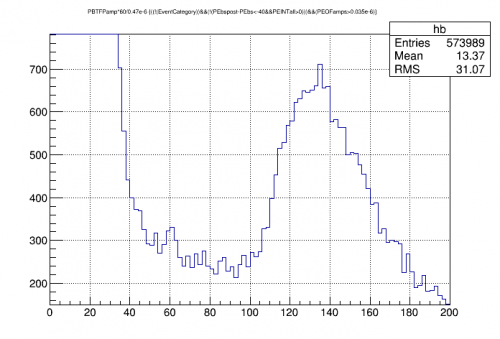
| pB Tailfit Amplitude with approximate keV calibration |
|---|
 |
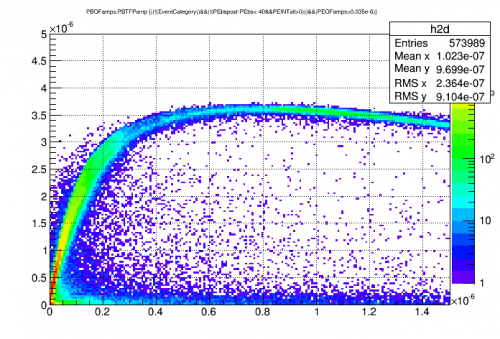
| pB OF Amplitude versus Tailfit Amplitude |
|---|
 |
| pB Calibrated Tailfit Amplitude at Low Energy |
|---|
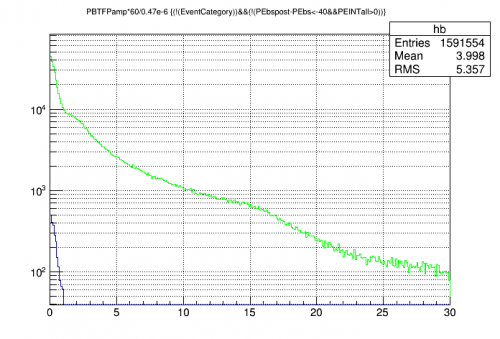 |
| no threshold cut green = not random blue = random Noise wall seems quite low, below 1 keV |
 |  |  |  |  |
| Comparing spectra of GeHV#2 to SiHV#4 |
|---|
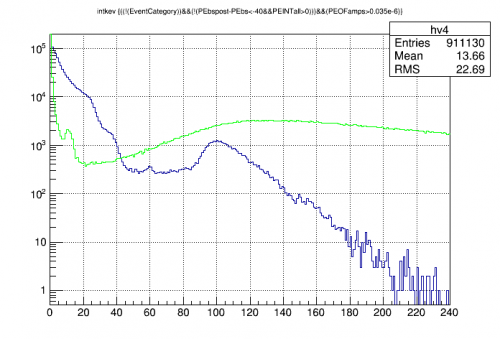 |
| Green = GeHV#2 Blue = SiHV#4 Both spectra have been calibrated to keV based on line identifications. Not clear that the Si spectrum is correct. |
| Energy absorbed in the TESs |
|---|
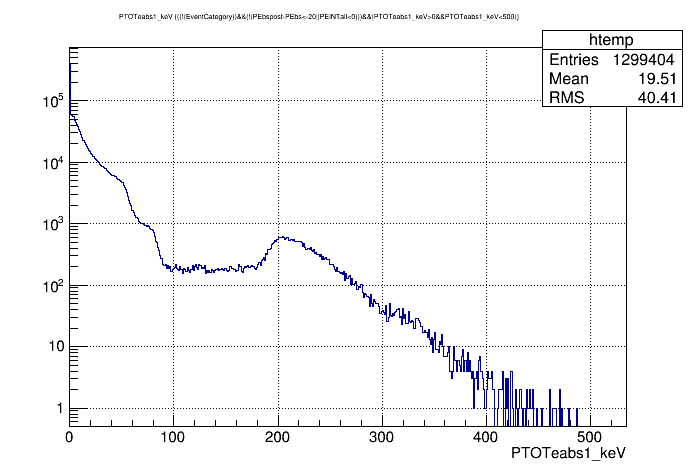 |
| Spectrum in terms of absolute energy (in keV) absorbed in the 5 connected channels The previously IDed 60keV line makes no sense - the absorbed energy is around 120 keV |
| 57Co calibration | |
|---|---|
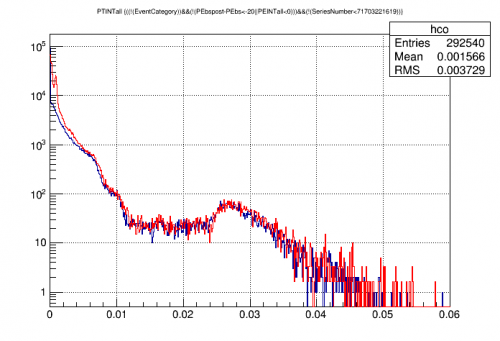 | 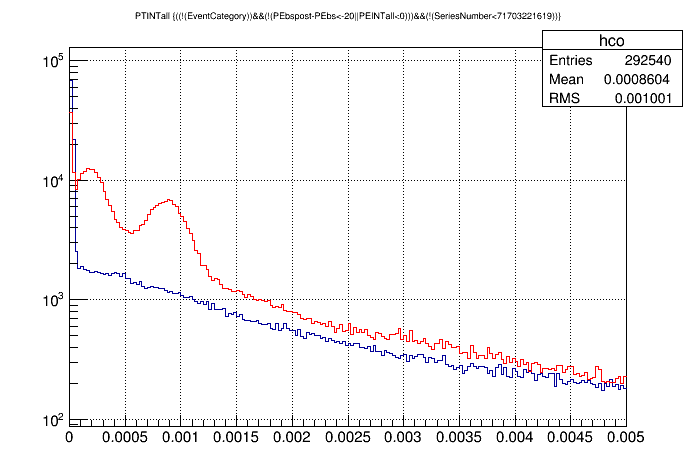 |
| The excess from 57Co versus background is at the far left of the full spectrum. Right image zooms in on 120 keV peak and Compton peak. | |
| Approximate calibrated 57Co spectrum |
|---|
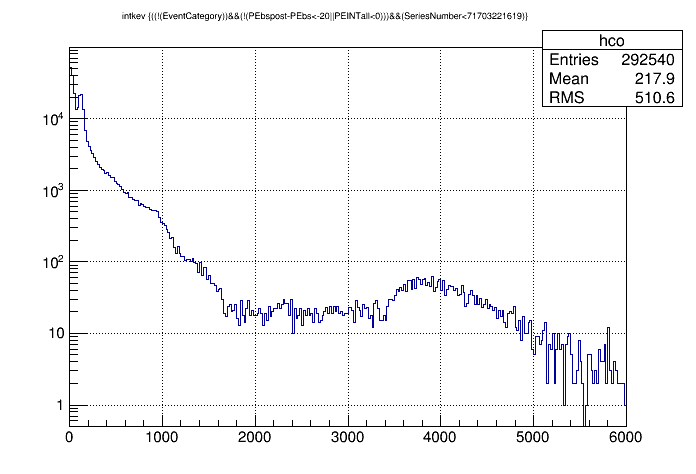 |
| Ptotal Integral spectrum using 57Co to calibrate to keV |
| Approximate calibrated background spectrum, looking for 60keV peak |
|---|
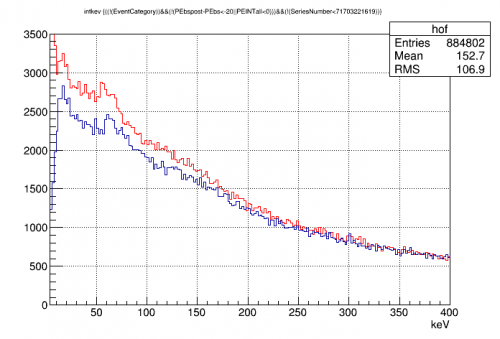 |
| Red = Ptotal Integral spectrum calibrated to keV Blue = Ptotal OF spectrum calibrated to keV Now the 60keV peak is visible, particularly in the OF spectrum |
| pB (second ring) phonon collection efficiency | ||
|---|---|---|
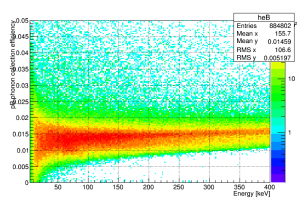 | ||
| pC phonon collection efficiency | pD phonon collection efficiency | pE phonon collection efficiency |
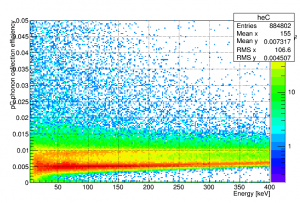 | 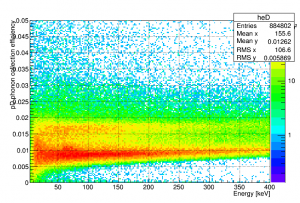 | 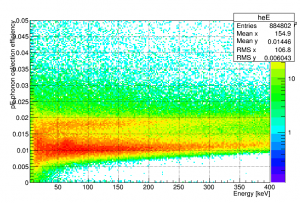 |
| pF (inner) phonon collection efficiency | ||
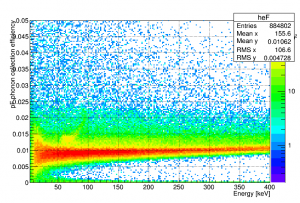 |
| pTotal (5 channels) phonon collection efficiency |
|---|
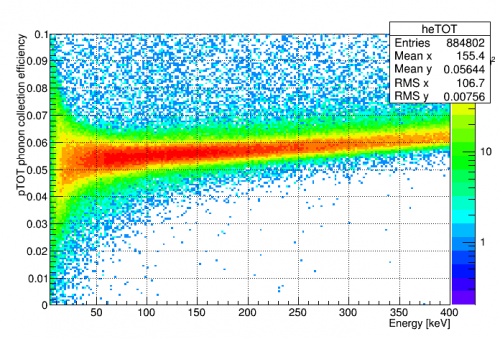 |
| pF energy partition |
|---|
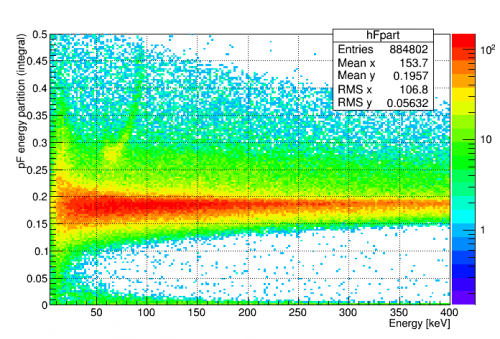 |
| Note region near 60keV with extra-high pF partition. this may be events from Am |
| OF spectrum with high-pF-partition selection |
|---|
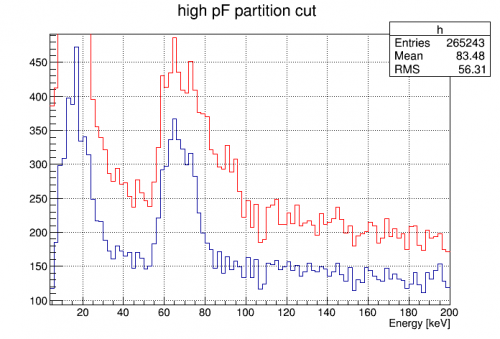 |
| Blue = restrictive cut, pFpart 0.24 to 0.30 Red = nonrestrictive cut, pFpart > 0.24 |