Finding Am peaks
For the PuBe n,gamma study we've been doing overnight data sequences with external triggering from the NaI gamma detectors. For most of these we also take single 1-hour internally-triggered data series under the same conditions, one before the overnight sequence and one after. The purpose is to try to acquire enough Am data to perform energy calibrations.
To see the peaks above the background it is necessary to select events near the central axis of the detector. Below is an example of a cut I have been using based on the difference in energy between the center channel pF and the outer ring channel pA.
| Example of cut to select Am events from PuBe data |
|---|
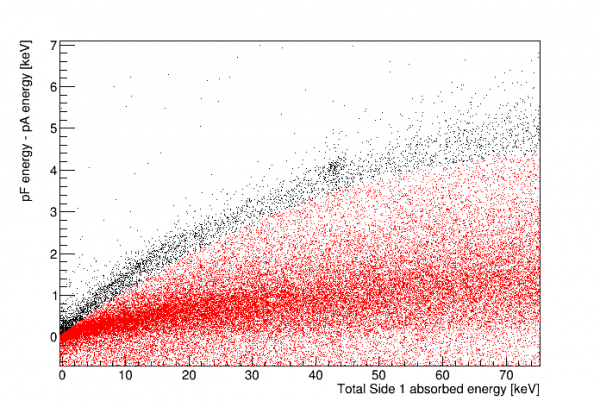 |
Unfortunately there is significant variation between calibration data series so that the above cut must be generated separately for each one.
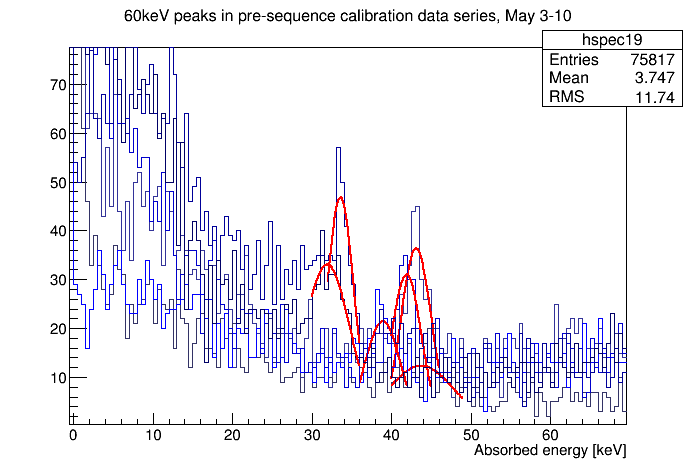
There is also significant variation in calibration. After generating the Am selection cut I look for the 60keV peak in the total-absorbed-energy quantity, which is based on pulse integrals and dP/dI information.
| Examples of 60keV peaks in calibration series |
|---|
 |
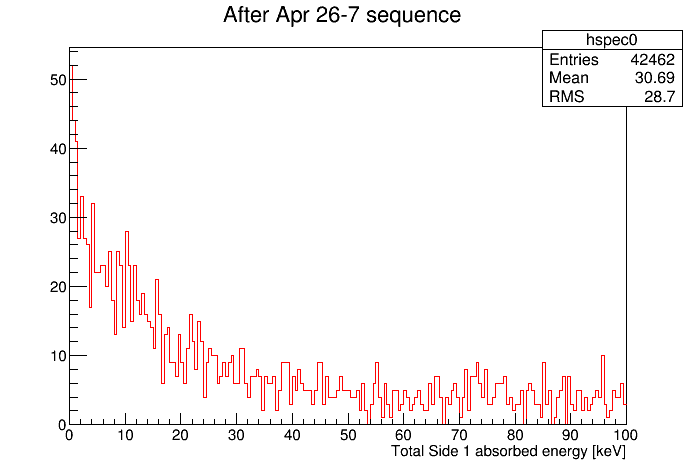
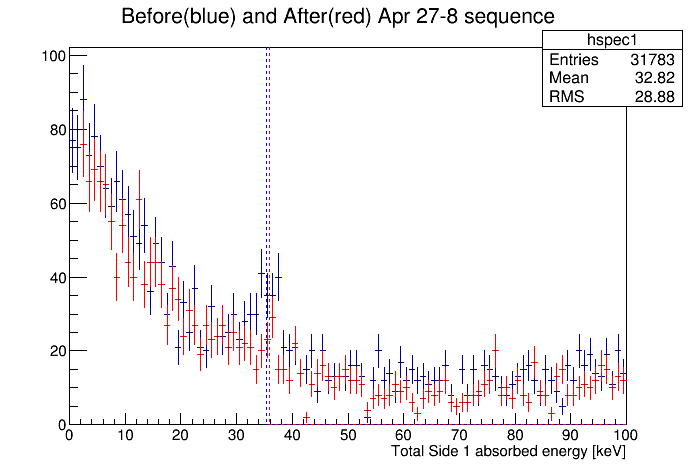
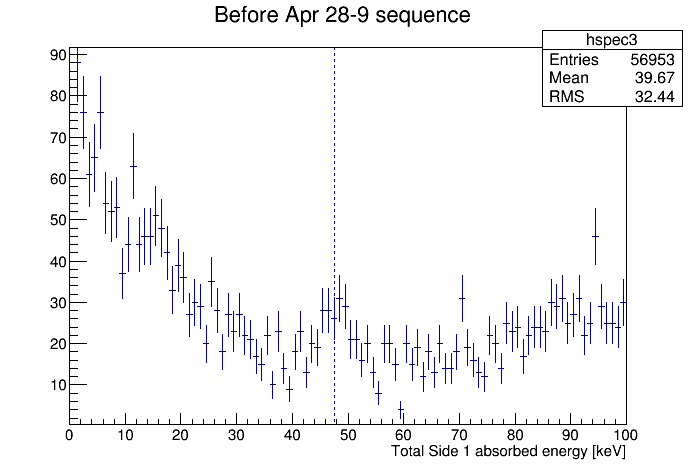
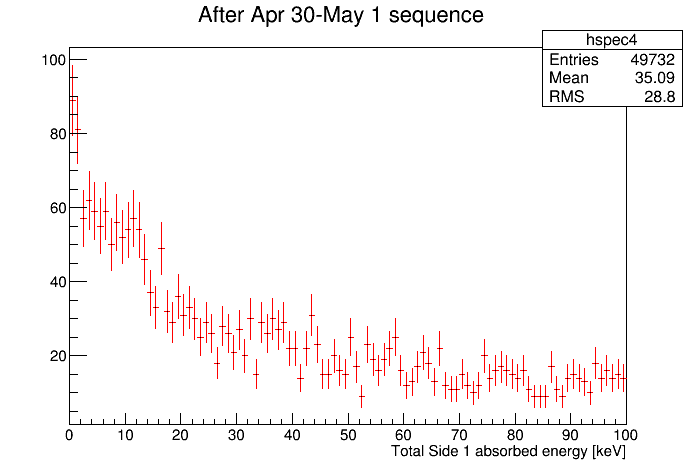
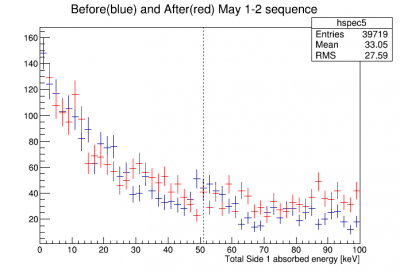
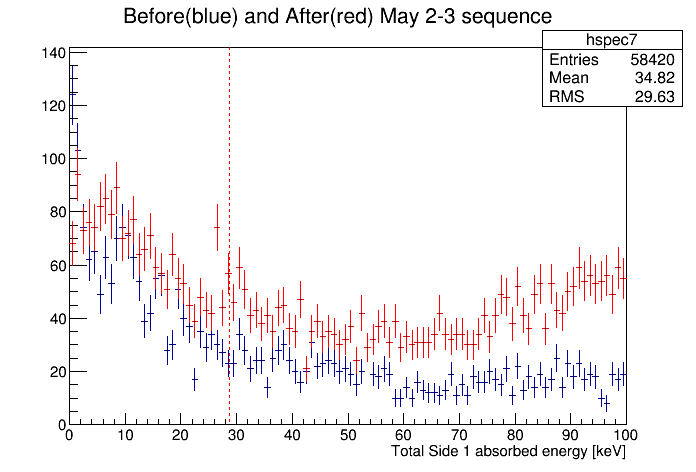
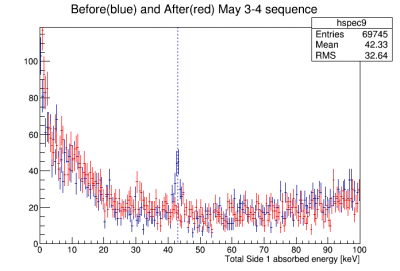
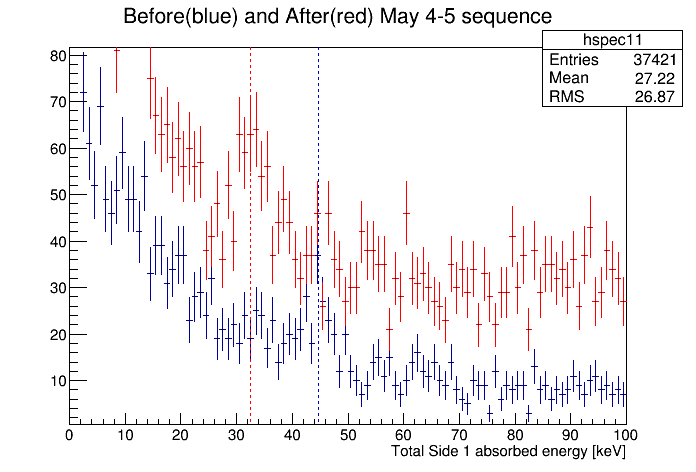
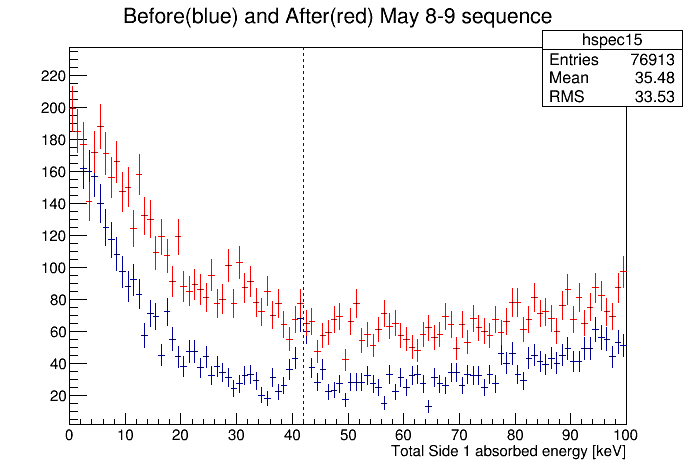
The plots below show spectra from the calibration series. For some overnight sequences there is only a before or an after calibration; for some there are no calibration series at all. (We were skipping the calibrations during weekend running.)
| 60keV peaks in calibration series | ||
|---|---|---|
 |  |  |
 |  |  |
 |  |  |
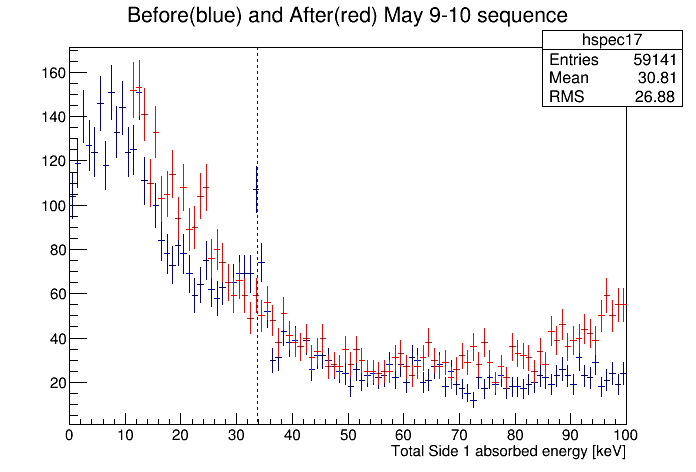 | ||
In some cases the peak is clear, in others there is a hint, and in others there is no discernable peak. There is some evidence that the calibration stays consistent during a single overnight sequence, since before and after calibrations in some case show hints of a peak in the same place. In one case above the peak appears to have shifted considerably but it may be a statistical fluctuation rather than a peak. In many cases it seems that there is a discernible peak in the before calibration but not in the after.
In phonon collection efficiency studies there is evidence of shifting gains, but mostly in cases where the QET bias is varied. In this data we have used consistent QET biases. Between overnight sequences we bake the detector for 30 minutes or more. It seems that this “resetting” may be affecting the calibration. Or possibly there are simply variations over time scales of around a day.
| E_absorbed spectra in 3-hour increments for May 3-4 sequence |
|---|
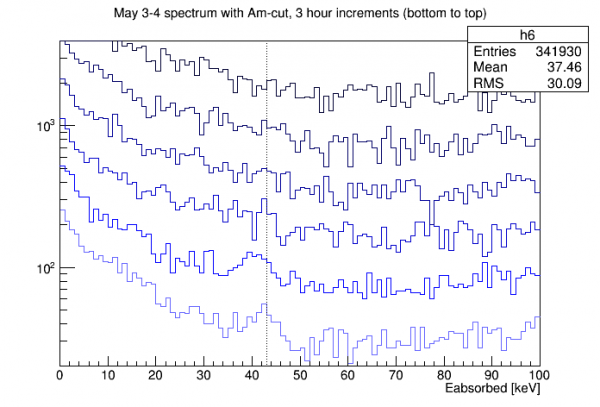 |
| Histograms have been scaled in order to separate them vertically Vertical line is peak center found in the calibration series preceding this overnight sequence |
The plot above shows that the 60 keV peak is identifiable with the integral amplitudes in NaI-triggered data. The same Am-selecting cut that was used for the calibration series preceding this overnight sequence was applied, and the peak center from that calibration series is indicated with a vertical line.
The lowest histogram represents the first 3 hours of the sequence, and the peak is clear and at the same place. The next higher histogram represents the next 3 hours of data and the peak is present but may have slipped to the left somewhat. Later data does not show peaks.
This suggests that the resolution hold time in current running conditions is around 7 hours.
Estimating calibration
Let's suppose that from phonon efficiency results that we can predict the trend in PCE with increasing total phonon energy - that there is a fixed ratio between PCE at 0keV and PCE at 60keVee, which is about 840 keV total phonon energy at 50V bias. But the overall phonon collection efficiency varies from dataset to dataset.
Let's assume a linear relationship between efficiency and Ptotal, so that
eff = eff_60 * ( r - (r-1)*Er/Er_60 )
r = eff_0/eff_60
Here Er is the recoil energy in keVee, and Er_60 is the energy of the 60keV Am line (59.537 keV). The eff_60 term is measured for a particular dataset, and the ratio r = eff_0/eff_60 is estimated from previous phonon efficiency trends. Note this ratio is specific to the 50V bias case.
From this we can write
Eabs/Er = Eabs_60/Er_60 * ( r - (r-1)*Er/Er_60 )
where Eabs is the absorbed energy, which we calculate from pulse integrals and dP/dI info, and Eabs_60 is the absorbed energy in the peak.
Solving for Er as a function of Eabs yields
Er = r/(2(r-1)) * [ 1 - sqrt( 1 - 4(r-1)/r^2 * Eabs/Eabs_60 ) ] * Er_60
For Er « Er_60 we can expand to first order:
Er ≈ 1/r * Er_60/Eabs_60 * Eabs
If r were 1 this would just be a linear calibration based on the peak fit at 60 keV. For 50keV an estimate of r from the PCE studies is 1.36.
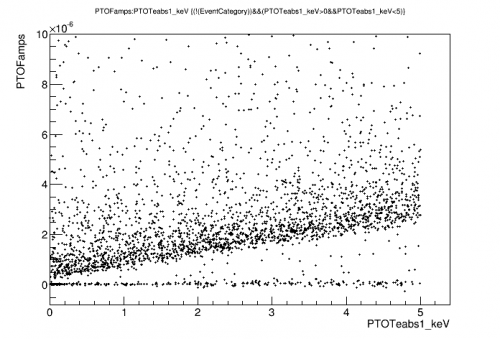
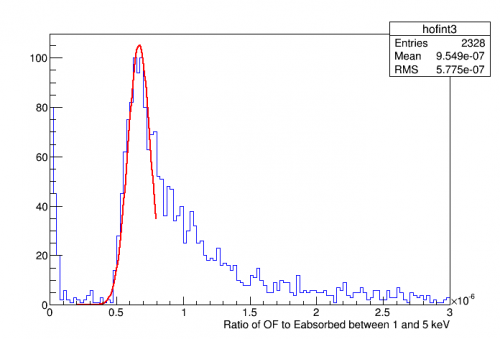
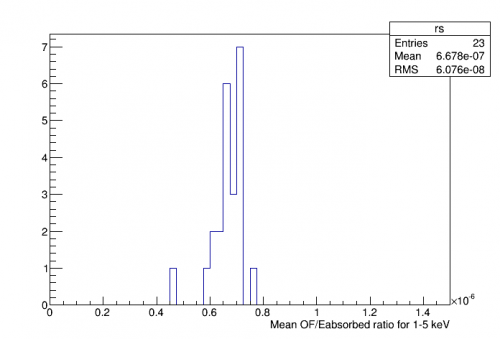
So this gives an energy estimator for Er in keVee based on the absorbed-energy integral quantity. The next step in calibration would be to cross-calibrate the optimal filter amplitude with the integral amplitude.
 |  |  |