Table of Contents
Analysis of Helium Recovery Rate
he_meter_readings.xlsx
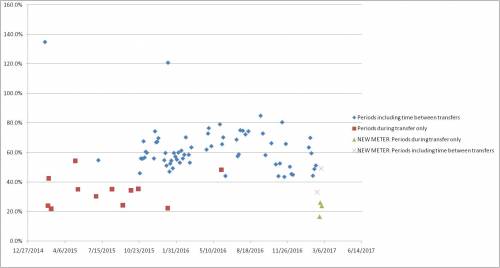
| The rough average of this data is about a 58.4% recovery rate. As Matt said, historically rates were around 90%(!) and the previous owner of the fridge found that a rate around 80% is fine, but any lower means that something is wrong (leak…?). It seems that rates specifically during transfers are lower than the average rate. Possible sources of this discrepancy: transferring faster than ideal, different transfer stick, meter inconsistencies. Also, compare rates for recovery during transfers only versus between transfers only (sheet 2 - need more data to accurately compare). |
| After new meter installed (2/15/17), rates seem to still be low. Will begin experimenting with slower transfers (to ~hopefully~ increase rates during transfers only) and compare to rates between transfers with new meter. |
| Will see how increased transferring time changes recovery rate (expect rate to increase, since longer transfers show a slightly higher rate previously). Rates during transfers are still significantly lower than rates across multiple transfers. Since the new meter installment, the average transfer time is ~39 minutes. I will experiment with increasing this transfer time to over an hour to see how this affects rates. |
 in_vs_out_temp_during_transfer.xlsx
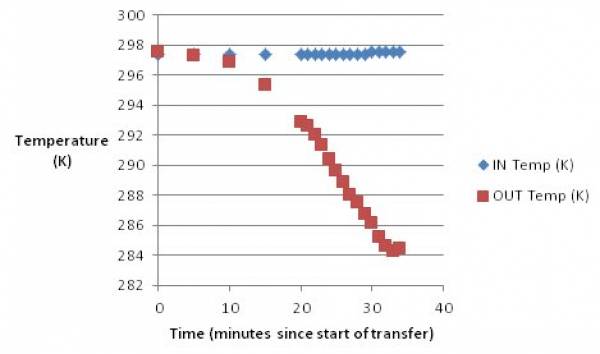
| The probe on the room thermometer (“OUT”) was taped to the housing of the recovery meter during the transfer. At the lowest temperature this implies that the meter is underestimating the recovery by 5%, or more if the gas itself is colder. Will continue to observe temperature during transfers. |
| 3/1/17 | Began messing with helium cylinder pressure to observe recovery rate changes. Initially at 3.25 psi, lowered to 1.5 (too low) then 2.0, and finally 2.5 psi. Next transfer will see how it does at around 2.0 psi. Not enough data to tell yet how rate changed. (Actually we don't know if the lower pressures were too low because for most of this time we didn't have the transfer tube pushed down fare enough to be below the LHe level. -MF) |
|---|
Calculating liters of LHe from level meter %
Based on measurements of the actual depth of the LHe level versus level meter reading done January 2016, and based on fridge dimensions, the following is an estimate of the amount of LHe in liters corresponding to a 1% change in meter reading:
| Level meter range | Liters LHe in bath per 1% change in meter | notes |
|---|---|---|
| 0% - 78.7% | 0.529 | level intersects upper IVC piece in wide part of cryostat |
| 78.7% - 94.8% | 0.561 | level is above IVC but still in wide part of cryostat |
| 94.8% - 100% | 0.215 | level is in narrow part of cryostat |
Below is a handy EXCEL formula for how much LHe is in the bath given a certain meter reading, in percent, in cell A2:
=IF(A2<78.7,A2*0.529,IF(A2<94.8,78.7*0.529+(A2-78.7)*0.561,78.7*0.529+(94.8-78.7)*0.561+(A2-94.8)*0.215))
The above formula assumes that the level cell is in units of percent, i.e. 50% is entered as 50. But if you have the cell in percent format, then 50% is actually 0.5. So in that case the formula for liters should be
=IF(A2<.787,A2*52.9,IF(A2<.948,.787*52.9+(A2-.787)*56.1,.787*52.9+(.948-.787)*56.1+(A2-.948)*21.5))
Some calculations from Tue March 7 which include bath level and also an estimate of gas use from cylinder:
| Recovery efficiency, boiloff period and transfer period | 73% |
|---|---|
| Recovery efficiency for boiloff period | 71% |
| Recovery efficiency for transfer period | 79% |
| Fraction of total recovery that occurs during transfer | 22% |
| Liquid transfer efficiency | 79% |
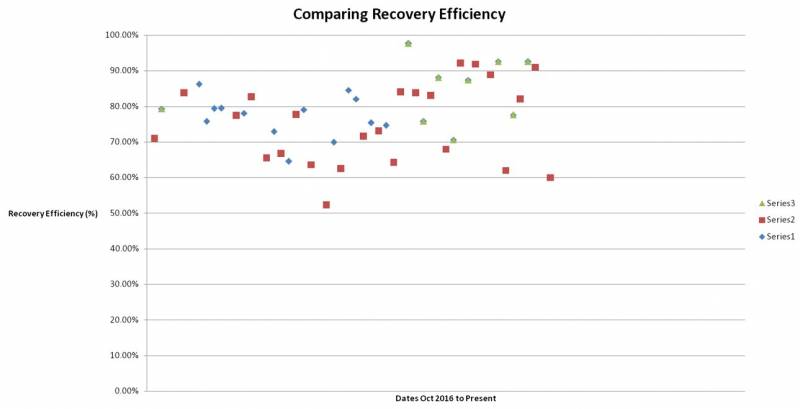
| Using new formula, compiled data ranging from dates before the new meter to present. Results looking better, but recovery in between transfers is worse than during transfers only or periods including two transfers and the time between. Average efficiency is around 70%. There is a large uncertainty in final efficiency due to the meter reading, will continue taking data to find a long term average %. Ways to get a more precise meter reading: record movement of two mini spokes (1/2 ft per turn and 2 ft per turn) to estimate amount/unit time. |
| 3/20/17 | Meter rate during boil off period measured: ~0.3 cuft/min. Recorded recovery meter rate during transfer, measured: ~7.5 cuft/min (start of transfer is faster). Knowing this allows a more exact meter reading value at the start and end of transfers, should give a more accurate recovery rate with less error over these periods. |
|---|
lhe_recovery_copy.xlsx
| Recovery rates for 2017 Mar 20-29 |
|---|
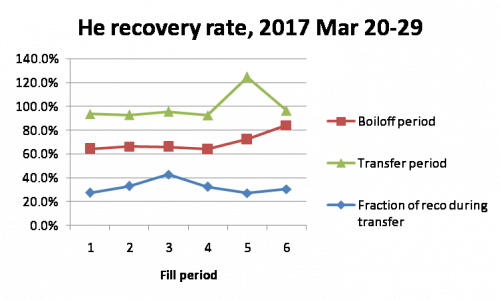 |
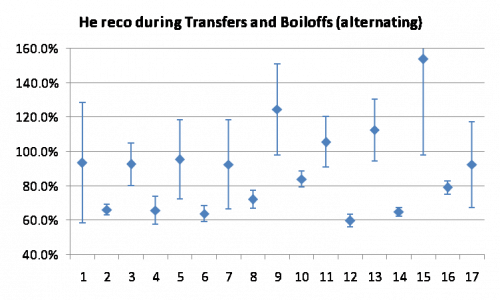
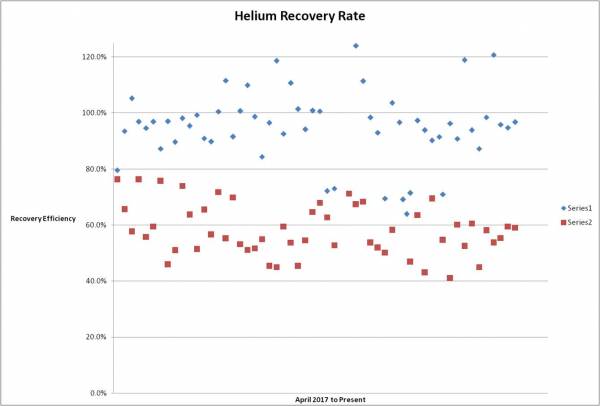
| This is total liquid+gas recovery rate (Bill's rate should be higher) Accounting for meter reading (to nearest cuft), main bath level, storage Dewar contents, gas cylinder pressure Note recovery is pretty high during transfers but rather low between transfers (or vice versa, depending on the '0.64' factor in the formula. |
lhe_recovery_mf_corrected1.xlsx
| Recovery shows same pattern as expected, high efficiency during boiloff and ~60% efficiency during transfers. Experimented with slower transfers by using low pressures but ended up wasting a lot of helium. It was assumed that a longer transfer would help increase transfer efficiency but now that is not the case, possibly due to different transfer stick(?). |
| When using the large dewar, on average about 10.7 L boil off in the period between the end of a transfer and the start of the next one. This value can be added to the weight of the dewar at the end of a transfer to find the approximate starting weight (so the dewar does not have to be weighed both before and after a transfer, only after). |
| Though our estimates are lower than the reported efficiency every month, the running average efficiency over periods from the start of a transfer to the end of the next is around 74%. This is the same as the cumulative efficiency for the year, but still low. |
Update 2018 October
To summarize the previous results: we have pretty consistently had a liquid helium recovery efficiency around 80%. This is low - healthy systems should have greater than 90%. For a long time now we've been trying to figure out why our recovery efficiency is so low.
At the beginning and end of every transfer we record each of the following:
- Storage Dewar weight - tells how many liters we transferred
- Main Bath level - tells how much the volume of LHe in the bath changed, but depends on a level-meter-to-height calibration and a geometric knowledge of the bath and the cans and tubes in it
- Recovery Meter reading - tells how much we recovered. We measure to the nearest square foot, which requires counting how many times the dials spin (otherwise we only know to the nearest 100 square feet)
- Gas Cylinder pressure - tells how much helium gas was consumed during the transfer (a very small correction generally)
The plot below shows a period of several weeks during Run 68. From the measurements taken before and after transfers we can calculate the efficiency for each fill period, and split this into separate efficiencies for 1) during the transfer and 2) the boiloff period between transfers (usually 2 days).
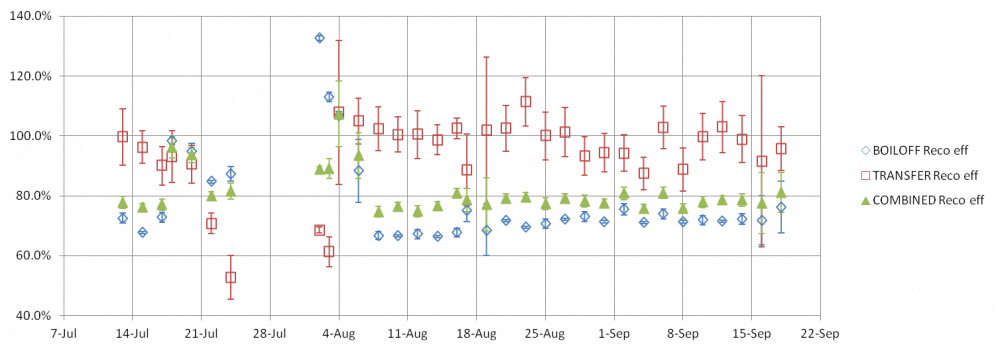
As can be seen the overall efficiency is usually around 80%, which is in general agreement with monthly reports from Bill Voje (which makes sense because his measurements are based on Dewar weights and recovery meter readings. The only thing missing is the amount in the bath, which remains roughly constant over time during a run.)
One thing that has long been confusing is that when we look separately at during-transfer and between-transfer efficiencies, the between-transfer seem much lower, and the during-transfer seem nearly 100%. One might expect that with the high pressures and unavoidable losses when things are opened and closed during a transfer would make the recovery efficiency worse during transfers, in contrast to the slow, calm boiloff period. For some time we suspected maybe something wrong with the level meter calibration (conversion from % to liters). Adjusting this calibration can reverse the trend, so that the boiloff efficiencies appear high and the transfer efficiencies appear low. These are just ad hoc adjustments however - double-checking the math has not revealed any mistakes in the original calibration.
On a couple of occasions we've taken recovery and level meter readings over the entire boiloff period between transfers, in hopes of getting some hint about the calibration. At the end of Run 68 we did this during the final warmup, as the main bath level meter fell off scale and the recovery meter showed LHe continuing to boil off until the bath was empty. Results from these measurements are shown below:
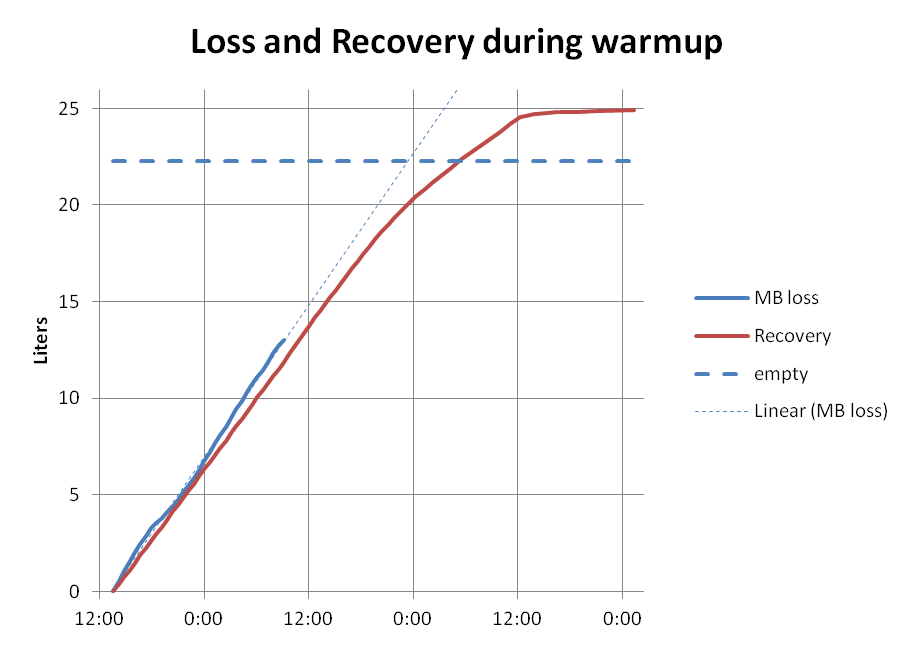 | 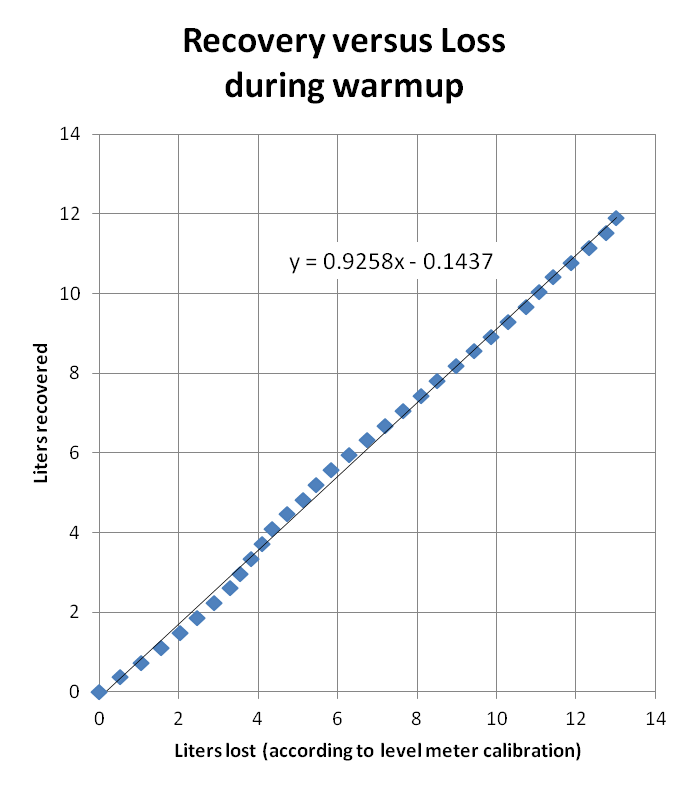 |
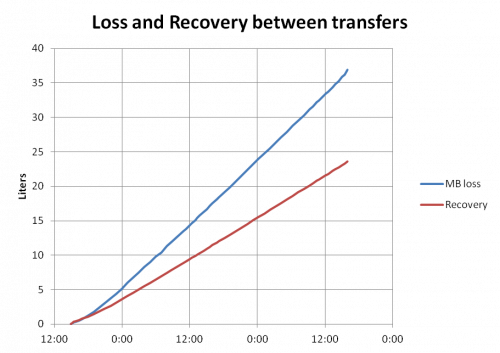
The first plot above shows that, in contrast to what we are used to, the rate at which the bath emptied (using the original unadjusted level meter calibration) is only a little higher than the recovery rate. The second plot shows recovery versus loss (“loss” meaning how much has boiled away in the bath). The slope indicates the recovery efficiency: better than 90%.
In contrast, below are similar plots from a period between transfers, showing the much lower recovery efficiency (near 60%):
 | 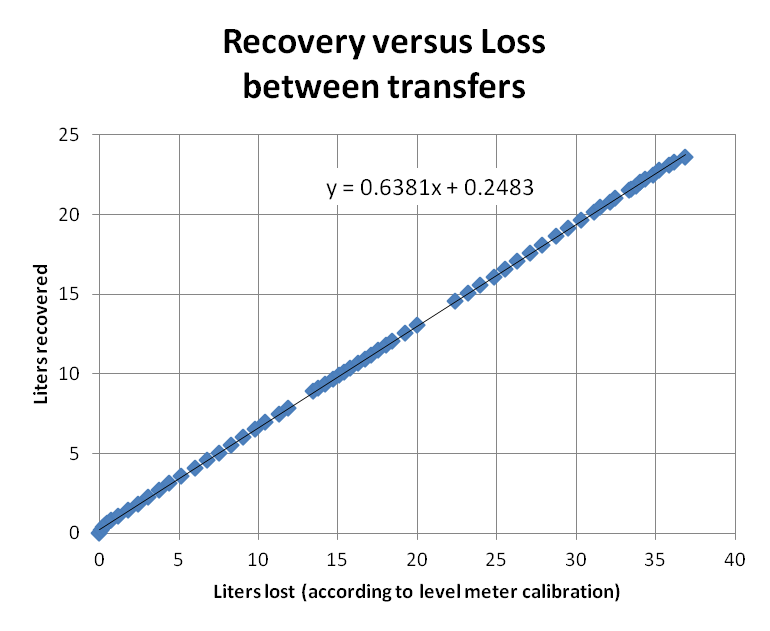 |
So what is the difference between the final warmup period and the period between transfers? Why is the recovery efficiency so different between them? One obvious difference is that the 1K Pot is running between transfers, but it is turned off before the final warmup.
The 1K Pot is a second way in which LHe leaves the bath - not only is the bath boiling with gas exiting the top of the cryostat, but also LHe is being pulled from the bath into the 1K Pot and pumped away with the 4He pump. The outlet of this pump is connected to the recovery system too - but if there's a failure somewhere in pulling the helium into the recovery it will certainly make a difference.
The plot below combines the data from the above plots (warmup period and between-transfers period) and shows the bath loss and recovery rates plotted versus bath level. When the 1K Pot is on, the boiloff rate is higher as one would expect - but the recovery rate is actually lower.
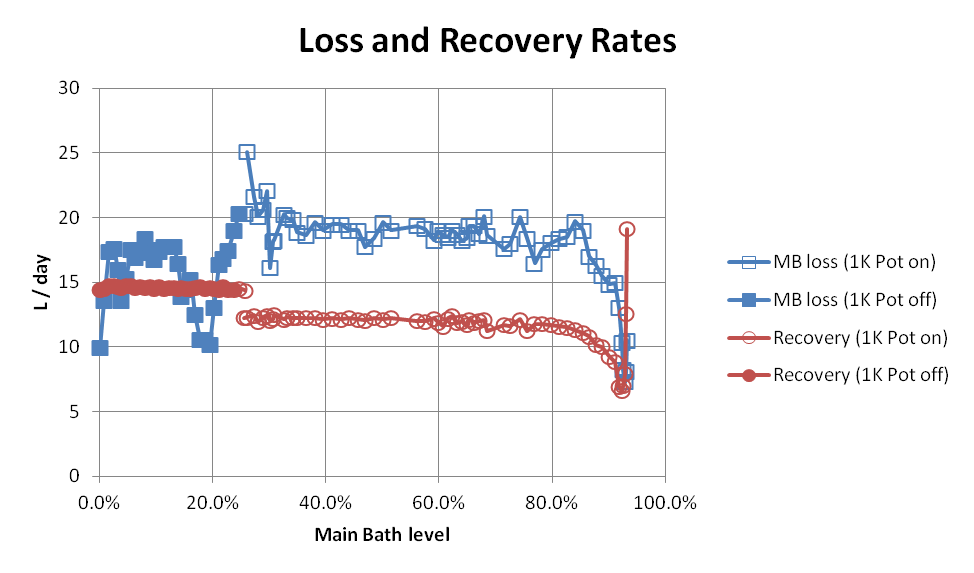
If the 1K Pot is the cause of the recovery inefficiency it would explain why efficiencies during transfers are relatively high. The 1K Pot is running during the transfer too, but the transfer duration is short; around 12 L of LHe is recovered at the recovery meter during a ~1 hour transfer, in contrast to 25 L recovered over the 2-day period between transfers. So a much smaller fraction of the recovery during a transfer is from the 1K Pot as compared to during the boiloff period.
If the 1K Pot is the culprit, we should see better efficiency during periods when it is off. And indeed we have some examples from Run 68. In July we had trouble with the 1K Pot so we suspended operation for several days, then turned it back on. We still had problems so we warmed up completely then cooled again - at the beginning of the cooldown there were several days before the 1K Pot was turned on. As seen below these are all high outliers in the general recovery efficiency trend:
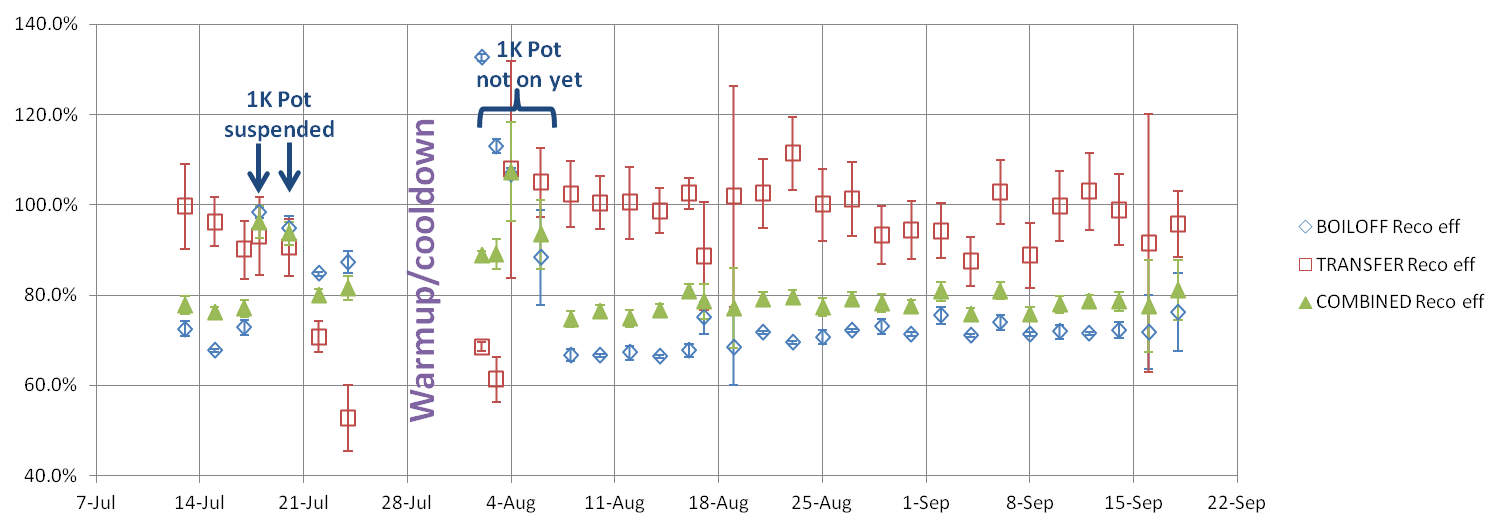
Since 1K Pot pumping pressures are generally low, the loss is probably occurring at the outlet. The outlet is covered by an oil mist eliminator; we opened the oil mist eliminator and found that the oil cartridge was clogged. Outlet gas should in that case open a safety valve and be recovered, but maybe instead it is leaking through other seals.