Table of Contents
20V data taken on 2017 March 24-25
- Vdetector = 19.9 V according leakage measurement
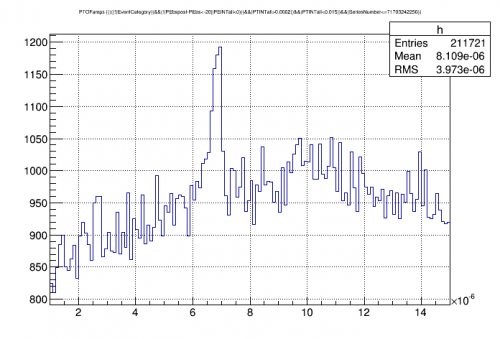
- Cuts to remove randoms and muon tails and also in most cases a threshold cut to remove noise triggers
| 20V Bias: Phonon Total OF spectrum |
|---|
 |
| 20V Bias: Total Absorbed Phonon Energy in 60keV Peak |
|---|
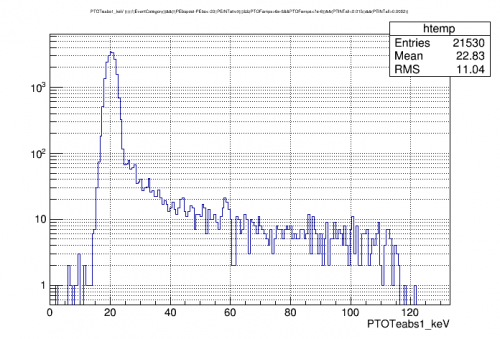 |
| Using the collection efficiency from 0V data (5.5%), this implies total phonon energy = 364 keV implies Luke gain = 6.06 implies bias of 19.2 V measured bias = 19.9 V |
| pTotal OF amplitude versus Integral amplitude |
|---|
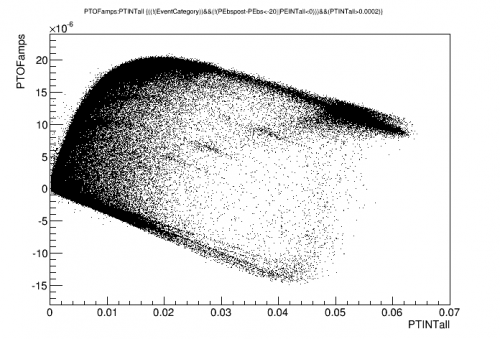 |
| Saturation effects make OF not monotonic above a certain Integral amplitude Apply cut to eliminate high-integral events |
| Energy spectrum versus time | |
|---|---|
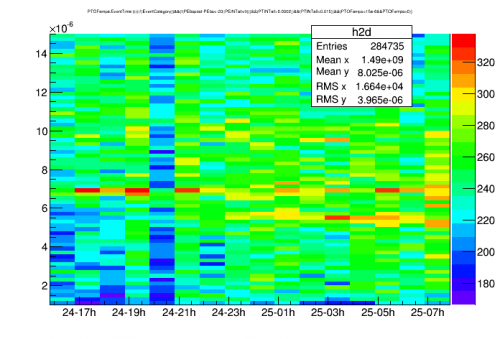 | 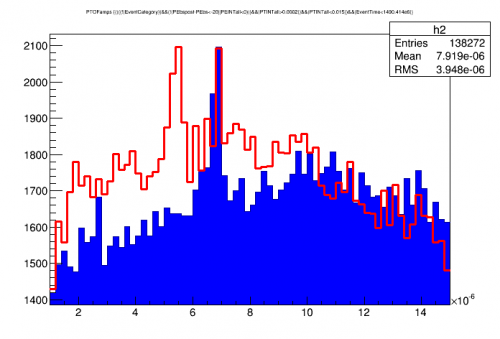 |
| At some point during sequence, peak splits into two (on right plot Blue is early data, Red is late date) No obvious signs of drooping due to loss of neutralization Apply cut to select only the early data (first seven hours) |
|
| pF Energy Partition versus Energy |
|---|
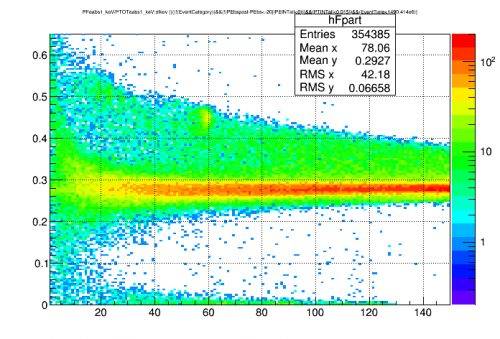 |
| As in 0-Volt data the Am-source events seem to show up at high pF-partition Apply a cut to select high pF partition (>0.4) |
| pTotal OF spectrum after high-pF-partition selection |
|---|
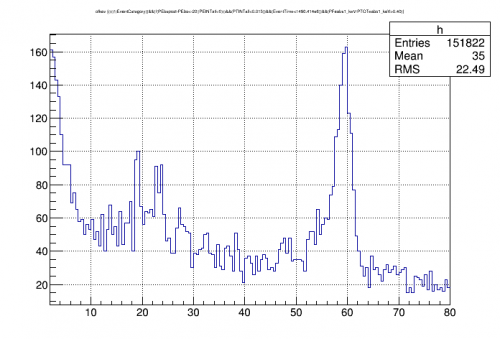 |
| 60 keV prominent, lower peaks seem to be present, not quite in correct places should be 13.95, 17.74, 20.8, 26.4 keV |
| pTotal OF spectrum versus time (with high-pF-partition selection) |
|---|
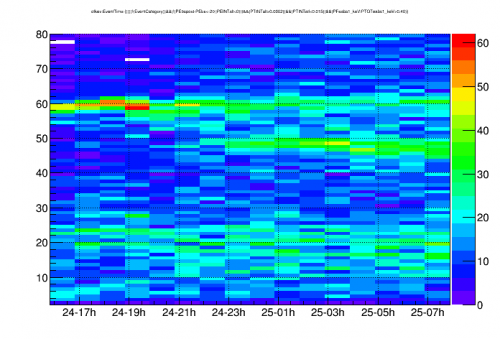 |
| Another look at the spectrum versus time, this time with the high-pF selection |
| Absorbed energy in all 5 channels for events in 60keV peak |
|---|
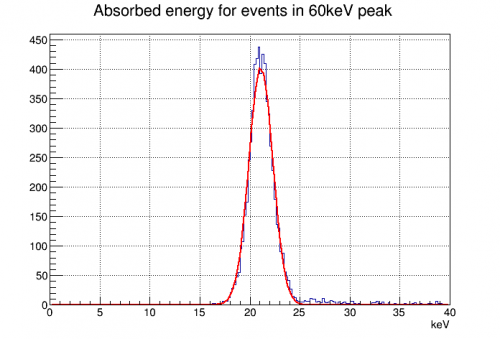 |
| 21.1 keV absorbed in the 5 channels for 60keV events If we assume 5.5% phonon collection eff (as measured for 0V data) Luke gain implies 20.7 V bias perhaps about 3% higher than this to account for parasitic power at 20V alternatively if we assume 19.9 V this implies phonon collection eff = 5.69% |
| pTotal OF spectrum with a non-linear calibration | example 241Am spectrum from google search |
|---|---|
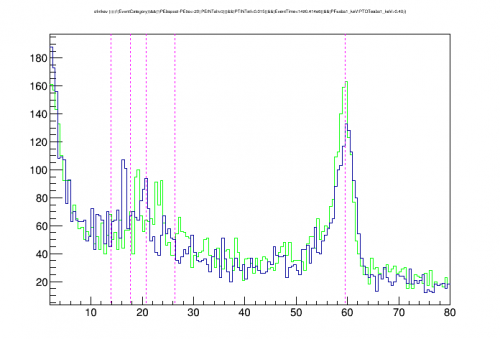 | 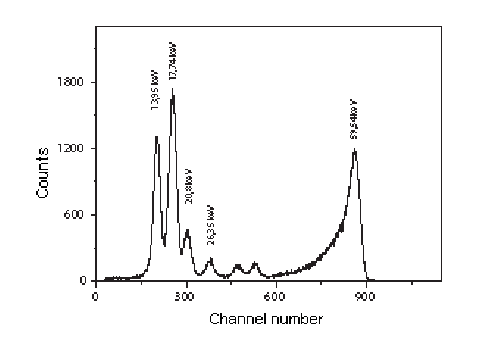 |
| Assuming that pTotal integral is linear, then fit pTotal OF to quadratic calibration (fixed at 0,0) Low peaks are closer to where they should be but still not quite right should be 13.95, 17.74, 20.8, 26.4 keV |
|
| Noise Wall | ||
|---|---|---|
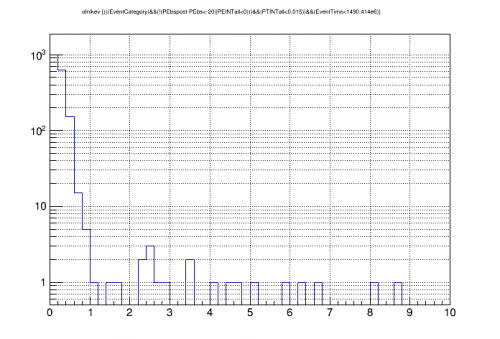 | 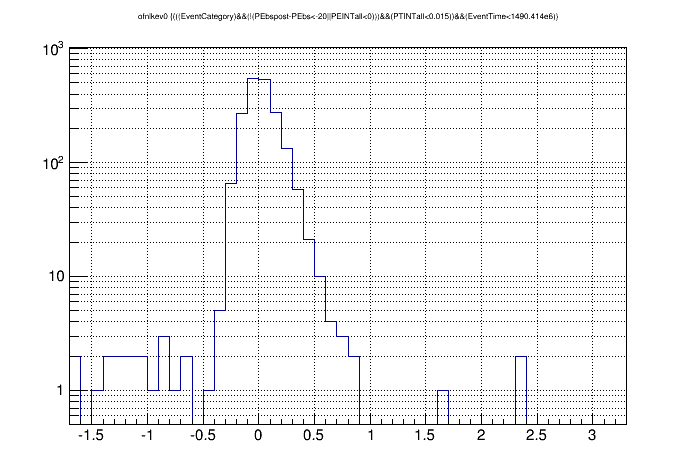 | 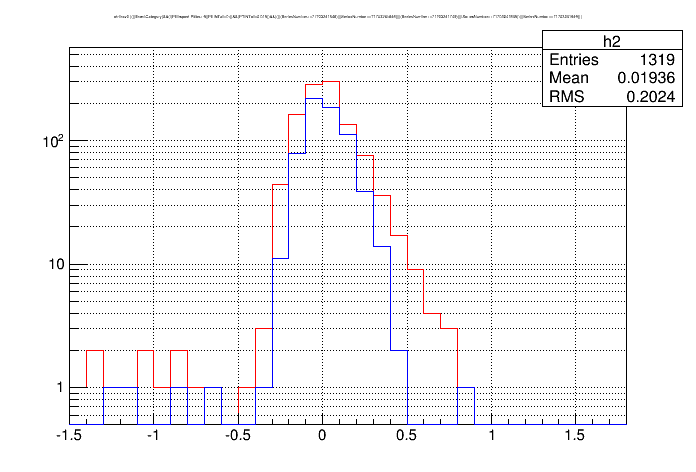 |
| using the default OF amplitude | using PTOFamps0, the fixed-start-time OF amplitude | compare hours 1-5 (red) to hours 6-8 (blue |
| Randoms spectrum, in keVee using the non-linear OF calibration | ||
NOTE: Comparing the 20V data from Mar 24-25 (here) to the 50V data from Mar 31 - Apr 4, the noise in pF is much higher (4-5 times higher at 1 kHz) in the 20V data: noise trends for 20V data versus noise trends for 50V data. It turns out that the front-end gain for pF (which is DCRC2pB, one of the channels on the RevC board) was set to 5 for the 20V data and 4 for the 50V data. We have seen in this run that channels on the RevC board are very sensitive to the high-frequency noise peaks that come in with higher front-end gain. This probably explains why the noise wall seems so much better in the 50V data.
| Phonon Collection Efficiency versus energy |
|---|
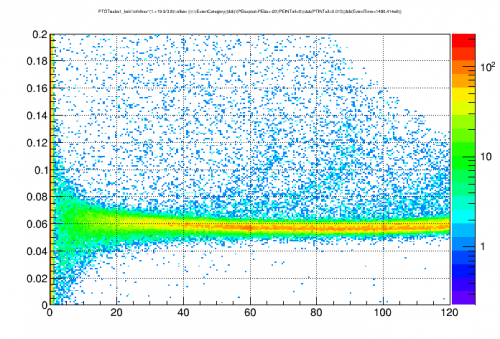 |
| Phonon Collection Efficiency assuming 19.9 V, using non-linear pTotal OF calibration |
| OF amplitude nonlinearity |
|---|
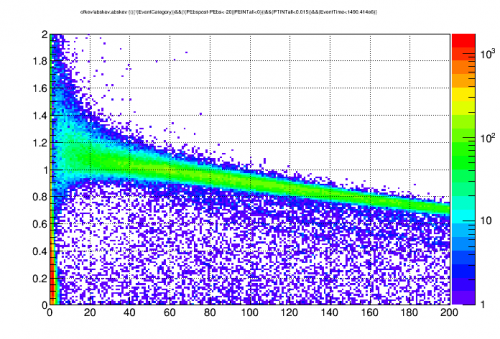 |
| Ratio of linearly calibrated OF amplitude to calibrated Integral amplitude plotted versus Integral amplitude (keVee). Both quantities are calibrated to the 60keV peak |
50V data taken on 2017 March 31 - April 1
- Vdetector = 49.2 V according leakage measurement (down to 48.7 V a couple of days later)
- Cuts to remove randoms and muon tails and also in most cases a threshold cut to remove noise triggers
| 50V Bias: Total Absorbed Phonon Energy in 60keV Peak |
|---|
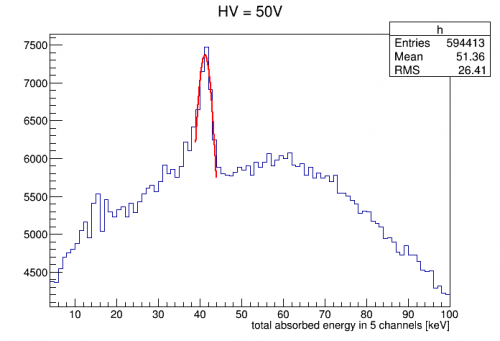 |
| Using the collection efficiency from 0V data (5.5%), implies that V_detector = 44.1 V, a little less than measured Using 49.2 V as V_detector, implies 5-channel phonon collection efficiency of 4.97% Attempt was made to use dP/dI factors appropriate to 50V but two channels only approximate |
| OF amplitude versus integral amplitude |
|---|
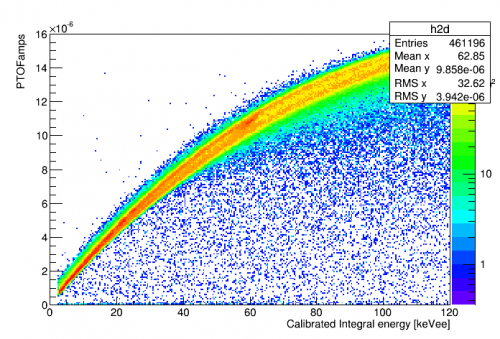 |
| Horizontal axis is integral amplitude calibrated to keVee |
| pF Energy Partition versus Energy |
|---|
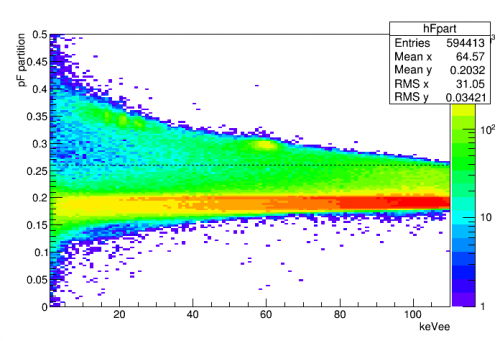 |
| As in 0-Volt data the Am-source events seem to show up at high pF-partition Apply a cut to select high pF partition (>0.26) |
| pTotal OF spectrum with a non-linear calibration | example 241Am spectrum from google search |
|---|---|
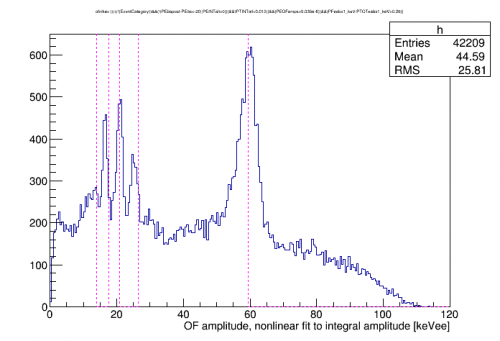 | |
| Assume that pTotal integral is linear, then fit pTotal OF to quadratic calibration (fixed at 0,0) Low peaks should be 13.95, 17.74, 20.8, 26.4 keV |
|
| pTotal OF spectrum versus time (with high-pF-partition selection) |
|---|
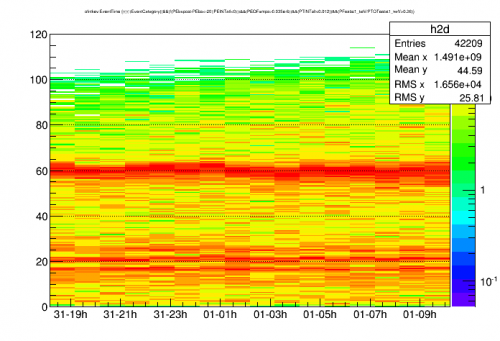 |
| OF pectrum versus time (16 hours). No obvious drooping, maybe a hint of worsening resolution |
| Noise Wall |
|---|
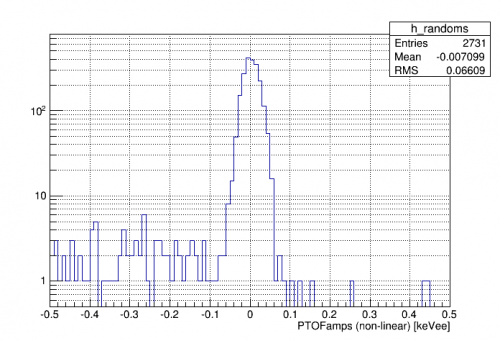 |
| using PTOFamps0, the fixed-start-time OF amplitude |
| Randoms spectrum, in keVee using the non-linear OF calibration |
NOTE: Comparing the 20V data from Mar 24-25 (above) to the 50V data from Mar 31 - Apr 4 (here), the noise in pF is much higher (4-5 times higher at 1 kHz) in the 20V data: noise trends for 20V data versus noise trends for 50V data. It turns out that the front-end gain for pF (which is DCRC2pB, one of the channels on the RevC board) was set to 5 for the 20V data and 4 for the 50V data. We have seen in this run that channels on the RevC board are very sensitive to the high-frequency noise peaks that come in with higher front-end gain. This probably explains why the noise wall seems so much better in the 50V data.
| Am-241 Spectrum |
|---|
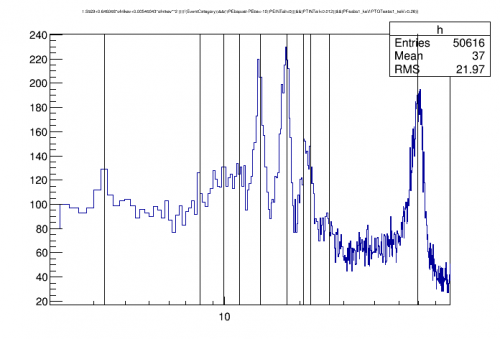 |
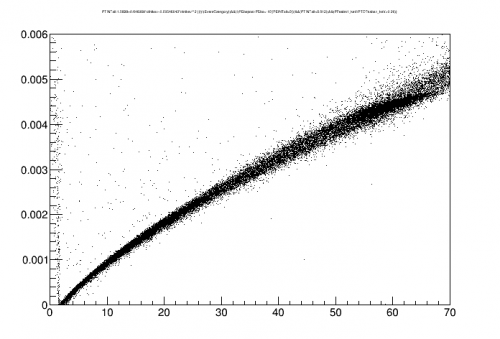
| Here a second nonlinear calibration was performed to fit multiple Am peaks |
The above plot shows multiple lines as identified by Noah in the G115 run. He used a paper listing Am-241 lines as a reference. The vertical lines represent the following peaks:
- 3.3 keV: Np M-shell x-rays (blended peaks at 3.262 and 3.436)
- 8 keV: Copper K-α fluorescence line
- 9.9 keV: Noah says this is a Compton escape peak but I'm not sure what he means
- 11.5 keV: Peak from escaping 60keV gammas after ~180 degree scatter
- 13.94 keV: Np L-shell x-ray
- 17.75 keV: Np L-shell x-ray (tallest of a few peaks)
- 20.79 keV: Np L-shell x-ray (tallest of a few peaks)
- 22.12 keV: this line is referenced in a few sources and seems a closer fit in our data than the line above, or an additional line. According to the reference paper on Am though this should be 6 times weaker than the previous line
- 26.35 keV: gamma
- 59.54 keV: gamma
| pTotal Integral versus nonlinear calibration to Am lines |
|---|
 |
50V data with PuBe source
While taking overnight PuBe data with NaI external triggering, we also take individual “calibration” series with HV#4 self triggering, in order to calibrate with the Am-241 lines. Below is a comparison of spectra at 50V from before - background data (i.e. not external source and full shield) and the current 50V calibration data taken with the PuBe source present:
| OF spectra, with and without PuBe source |
|---|
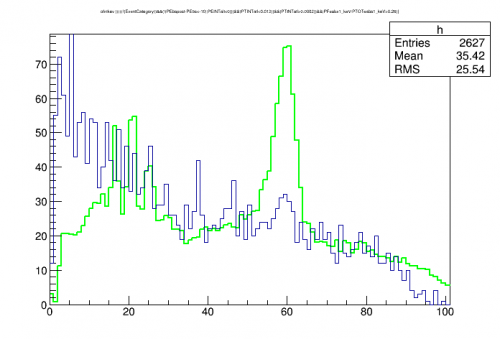 |
| Green = background (no external source) Blue = with PuBe source Each spectrum represents 1 1-hour series (the background data is from 16 series but scaled down to 1). |
It's clear that there is more background to compete with, but why are there fewer 60keV events in one series? Probably because the higher raw event rate, plus the fact that we are taking data from three DCRCs, has increased the DAQ dead time. We can compare raw rates with read rates:
| Raw rate [Hz] | Read rate (events above threshold) [Hz] | Read efficiency | |
|---|---|---|---|
| No external source | ~20 | 18.7 | 94% |
| With PuBe source | 82 | 31.6 | 38% |
This mostly explains why we see fewer Am events per series. Another factor is that when this PuBe data was taken we were taking 10,000 initial randoms instead of the more standard 1000, which several minutes out of the live time. Taking these two factors into account we can scale down the no-external-source data and see that the rate is about the same:
| OF spectra, with and without PuBe source, scaled for read efficiency | |
|---|---|
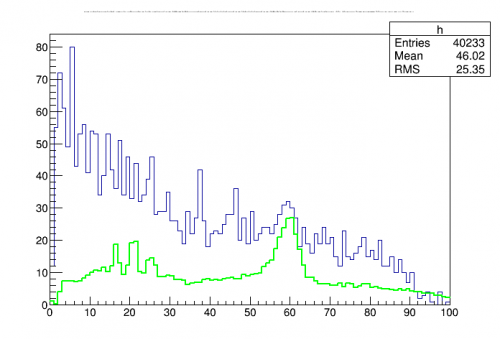 | 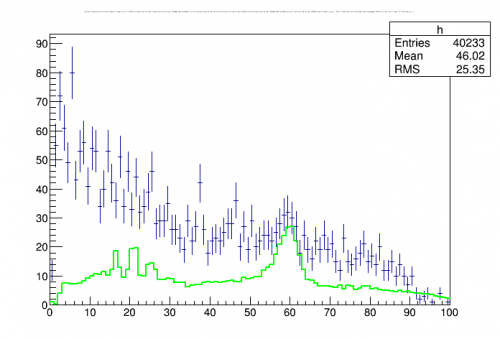 |
| Green = background (no external source) Blue = with PuBe source Each spectrum represents 1 1-hour series. The no-external-source spectrum has been scaled down to the same time and the same read efficiency. |
|
| Noise Wall with PuBe data |
|---|
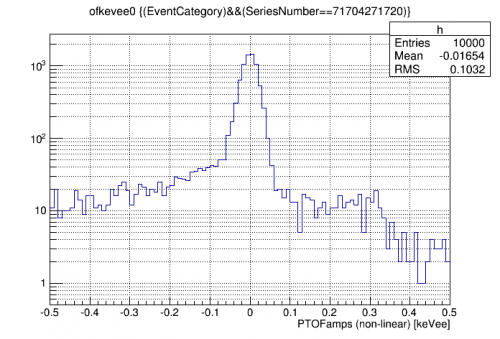 |
| using PTOFamps0, the fixed-start-time OF amplitude |
| Randoms spectrum, in keVee using the non-linear OF calibration |