Table of Contents
Run 68 Summary
Overleaf paper link : https://www.overleaf.com/9795316611rkbxwrmhynvz
Wiring
| pA | pB | pC | pD | |
|---|---|---|---|---|
| DIB1 | SIDE1pE | SIDE1pB | SIDE1pD | side2pE(-side2pD) |
| DIB3 | side2pB(d4) | side2pA | SIDE1pA | n/c |
| DIB4 | side2pC | side2pF | SIDE1pC | SIDE1pF |
| CAPITAL = Side 1, lowercase = Side 2 “-” indicates a non-readout channel shorted to a readout channel for biasing purposes |
||||
| HV side 2, Readout Side 1 Map | ||
|---|---|---|
| DIB channel | Detector channel | DCRC channel |
| DIB1 PA | S1 PE | HV1 PA |
| DIB1 PB | S1 PB | HV1 PB |
| DIB1 PC | S1 PD | HV1 PC |
| DIB3 PC | S1 PA | HV2 PB |
| DIB4 PC | S1 PC | HV2 PC |
| DIB4 PD | S1 PF | HV2 PD |
| SQUET rewiring | |||||
|---|---|---|---|---|---|
| pA | pB | pC | pD | SQUET | |
| SQUET for DIB1 | 6.7 mΩ | 6.7 mΩ | 6.7 mΩ | 0 mΩ, 1-bond | ZC-68 |
| SQUET for DIB3 | | | | | |
| SQUET for DIB3 | n/c | 6.7 mΩ | 6.7 mΩ | 6.7 mΩ | ZC-23 |
| SQUET for DIB4 | n/c | 20 mΩ | 6.7 mΩ | 6.7 mΩ | ZC-24 |
| Bold = Side 1, Italic = Side 2 | |||||
| NaI | |
|---|---|
| Detector B | DCRC4pB |
| Detector C | DCRC4pA |
The usual setup for this run was:
DIB1/3/4 → 3.2 MHz filters 2/3/1 → cable 3/1/2 → gender changer 3/?/2 → HVConn 1/3/2 → HV 1/2 → DCRC55(1)/DCRC50(3)
with triggering on the DCRC3 channels, Side1 pA,C,F.
Readout Side 1 is physically facing downward. The detector is in Tower Position 1, with the Am-241 source above in Tower Position 2. Hence the source points down at the bias side.
Processing and Analysis
Heatsinking
There was discussion about leaving the 4K shield/heatsinking off for this run, which could reduce the temperature of the SQUET-to-tower pins, and thus reduce our phonon noise. Ultimately we decided to leave it on as normal, but if the energy threshold is not as low as we'd like this is left open as a possible option.
Discussion of heatsinking options and thermal estimates
Normally we install the 4K stage with the tower, which serves as a heat sink of the tower to the IVC and a shield to lower temperature stages. But we realized that with a detector with no FETs this may not be necessary and may be counterproductive. It's been seen that a major contributor to phonon channel noise for this detector is the temperature of the pins plugging the SQUET into the 4K stage of the tower. If this temperature could be reduced it would probably improve our threshold.
It's possible however that even without the FETs on, the 4K heatsinking may help pull away incoming heat from the stripline traces. Then removing the heatsinking could make the SQUET warmer (and may even compromise the fridge, putting a greater heat load on the still and/or coldplate). The question is whether the heatsinking is pulling heat away from the tower to the bath or pushing heat into the tower from the bath.
Neutron data study
Neutron Data Study (first look - Aug 29 through Sep 12. Includes +40V, -40V, and -80V data, no -125V data.)
IbIs analysis
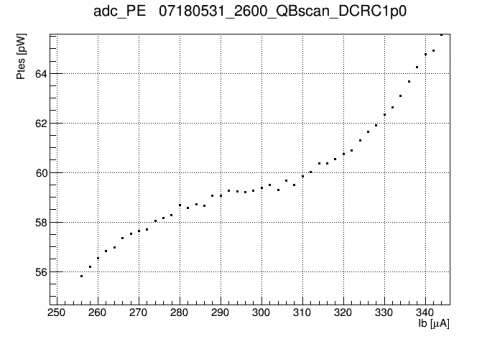
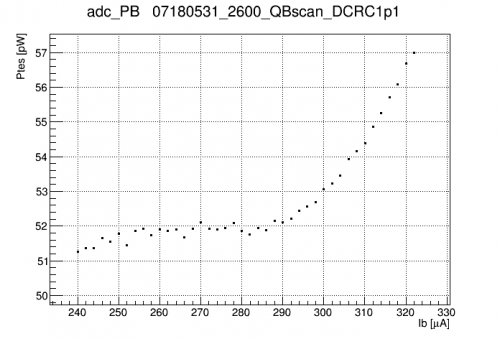
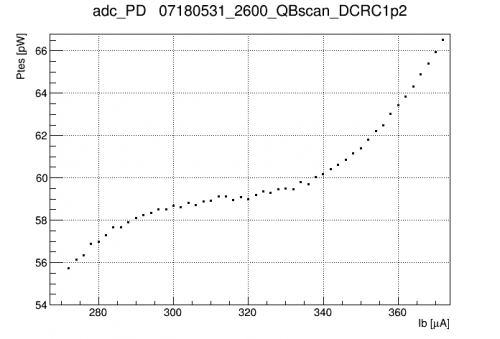
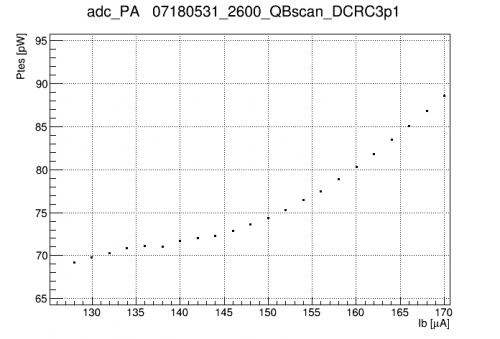
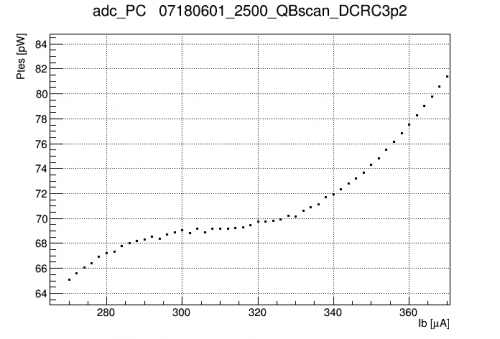
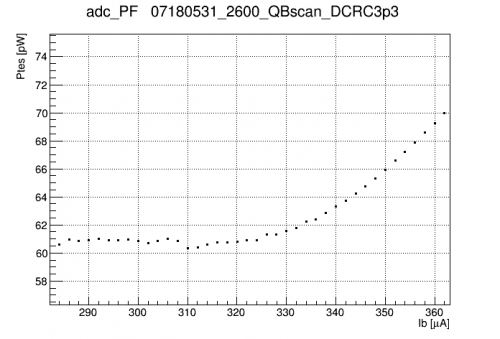
| Power versus QET-bias curves measured at 100 V | ||
|---|---|---|
 |  |  |
 |  |  |
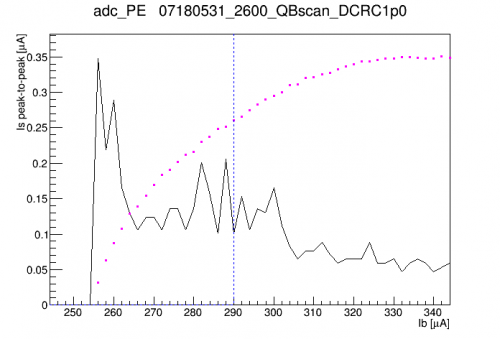
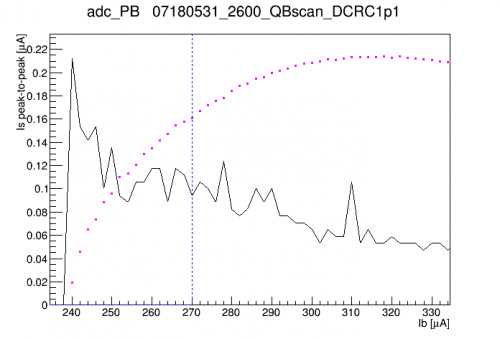
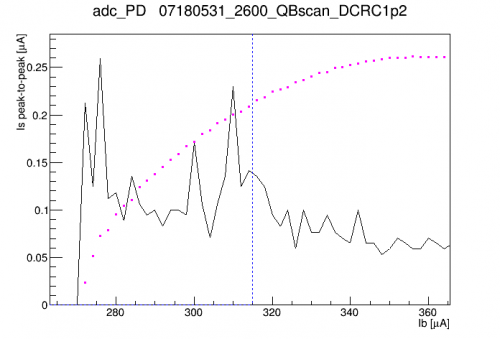
| Peak-to-peak width of the baseline as a function of QET bias | ||
|---|---|---|
 |  |  |
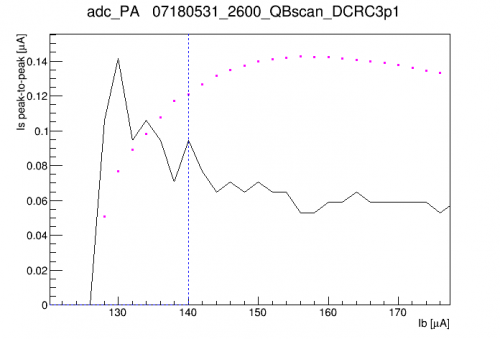 | 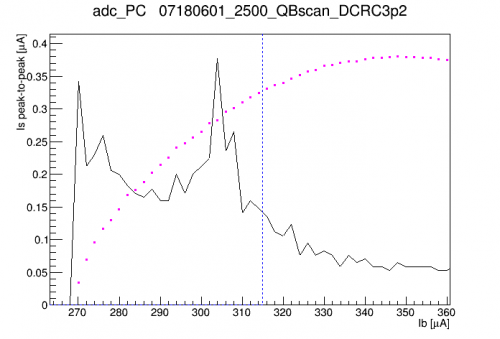 | 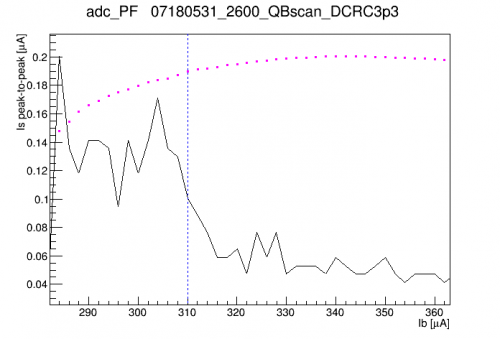 |
| In magenta the transition region of the IbIs curve is also shown (not to scale) | ||
The plots above are the basis for choosing operating values for the QET biases. The QET biases are chosen so to be in the flat region of the power curve, not too close to either end. Also we wish to avoid oscillation regions; the second set of plots above are helpful for this. The peak-to-peak width of the baseline will be large in an oscillation region.
Note that DCRC3pB (Side1pA, outer ring) shows an anomalously low QET-bias range for the transition region. Measurements of Rnormal and Rparasitic for this channel suggest that its Rshunt value is 3X greater than that of the other channels. This channel is the only readout channel on DIB3. The SQUET for this DIB was swapped-out during installation. We wound up using ZC-23, which was the first SQUET I modified to reduce its Rshunts. But it seems that either this channel was not modified, or the extra wirebond broke, so that this channel has its standard 20 mΩ shunt.
First peaks, 100V data, 12 hours with no flashing
On 2018 June 1-2, a sequence of 12 1-hour series with no flashing between was taken. Am-241 peaks were seen. But the OF amplitudes were seen to shift many times over the course of the sequence.
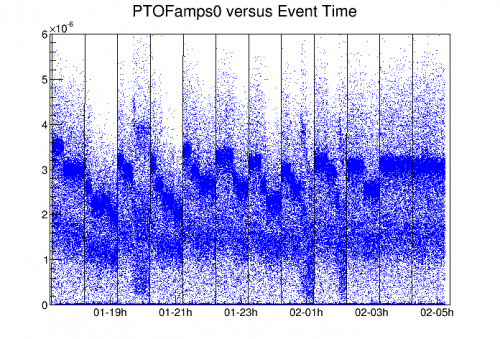
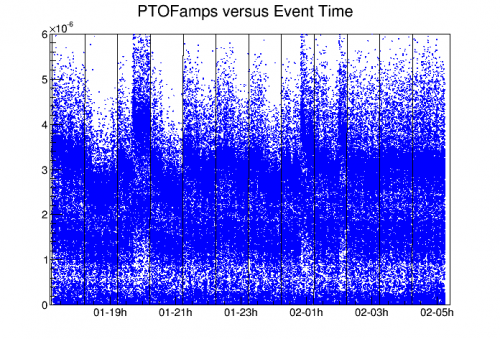
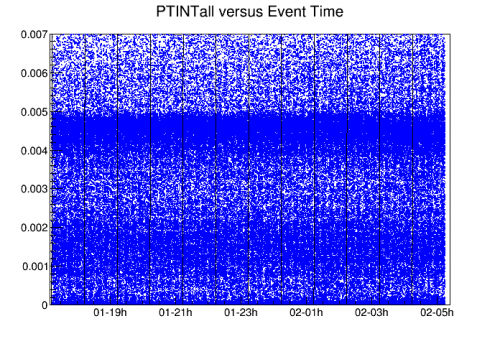
The fact that the INT quantities did not shift with time suggested something wrong with the pulse-shape details, and the pattern of sudden shifts suggested (from recent experience) some kind of DCRC glitch behavior. It was seen that the start-times of pulses in the 60keV peak were shifting on a per-channel basis. Each shift of one channel's pulse position caused a strong change in the PTOFamps0 (fixed-time) amplitude, and a weaker effect on the PTOFamps (variable-time) amplitude. Not surprisingly these shifts had no observable effect on the integral-based PTINTall amplitude.
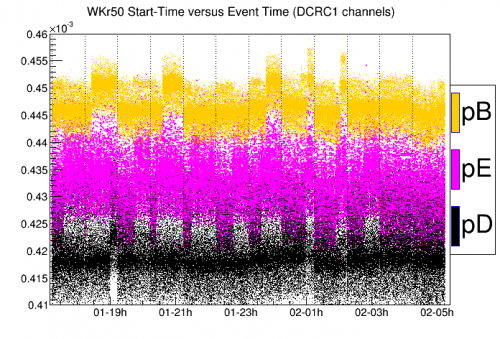
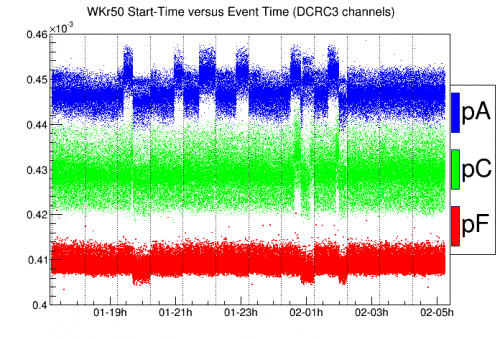
Examining pulses in most cases showed no obvious glitch behavior. But in three of the time periods depicted above the 8-wise sample-shifting glitch occurred in DCRC3.
glitch example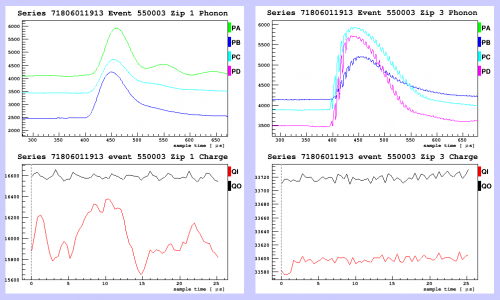
I'm not sure what's causing the start-time shifts that don't occur during a sample-shifting glitch. My guess is that it's another sort of DCRC glitch, where the start-time of the trace winds up shifted by a few bins (for all the channels affected, the shifts appear to be ±6 bins, and alternate between two standard values). DCRC3pC (Side1pF) seemed not to be affected by time shifts. This was a triggering channel. We triggered on all three DCRC3 channels, but since pF is the center channel its trigger time was probably the one used for the event.
It's quite clear why fixed-time OF is strongly affected by pulse-time shifts. As for the variable-time Ptotal amplitude, it's likely that the time shifts of one channel with respect to the others cause significant changes in the shape of the combined pulse, so that this quantity is also strongly affected. The integral quantity is immune. Also, an amplitude based on the sum of individual variable-time OF quantities should also be immune: this is shown below:
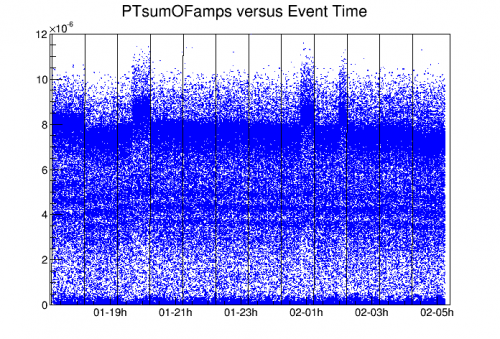
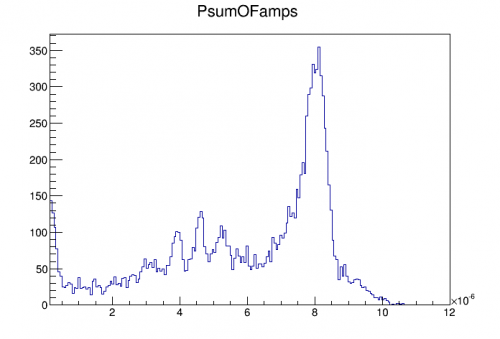
A well-resolved Am spectrum is seen in this OF-sum quantity:
Noise width (threshold) versus bias
Estimates of the noise resolution were taken using initial (June 1-4) bias-scan data. For 100V, 80V, and 60V sequences of 12 1-hour series without flashing were taken. For 40V only one 1-hour series was taken.
Cuts were applied to remove randoms and tail events, and to select high-Channel-F-partition events to resolve the Am-241 peaks for calibration purposes.
For each data set time cuts were constructed to remove periods where the pulse timing of various channels had apparently shifted. There is some evidence in the data of neutralization loss effects over the 12 hours of data without flashing (falling gains), so in most cases cuts were applied to select only the first few hours.
To measure the noise width a calibration was performed using variable-time OF quantities, using to the 14keV and 18keV peaks to build a quadratic calibration fixed at 0,0. Then the randoms peak using fixed-time OF quantities was fit to a Gaussian to characterize the sigma of the noise peak. Noise widths were calculated using both PTOF (OF of the summed phonon pulse PT) and PTsum (sum of the OF's of the six individual phonon channels).
| Noise width versus bias in keVee | Noise width versus bias in keVt |
|---|---|
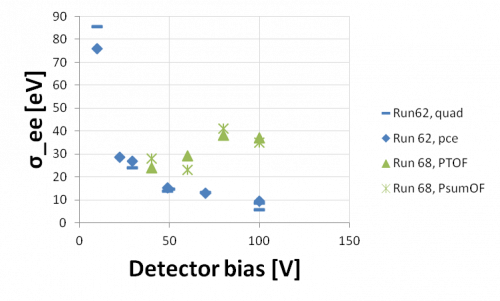 | 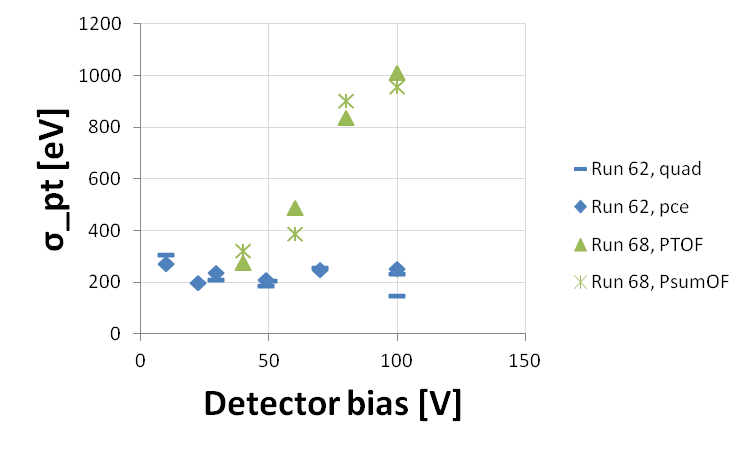 |
| Above are widths (sigma); the noise threshold is approximately 3 times these values. | |
It was hoped that the noise width would be smaller than in Run 62 because the shunt resistances have been reduced, and an analysis of noise in Run 62 indicated that it was dominated by passive Johnson noise. In Run 62 the noise width in eVt (total phonon energy) appeared flat with bias, which made sense with the separate observation that increasing the bias to 100V introduced very little additional noise. Unfortunately it appears that in this run there is a significant increase in noise with bias.
These estimates can be improved with higher statistics, shorter series (to avoid pulse time shifts), and flashing.
This measurement was repeated using bias scan data from 2018/07/01 and again on 2018/08/06 with flashing in between series and similar quality cuts to select good inner events with no time shift glitch as described above. The results are shown in the figure below.
| July 1, Aug 8 updates | Example of 40V spectrum from Aug 8 |
|---|---|
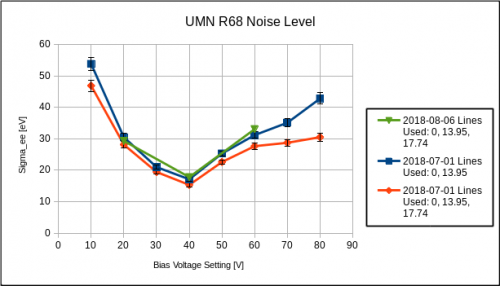 | 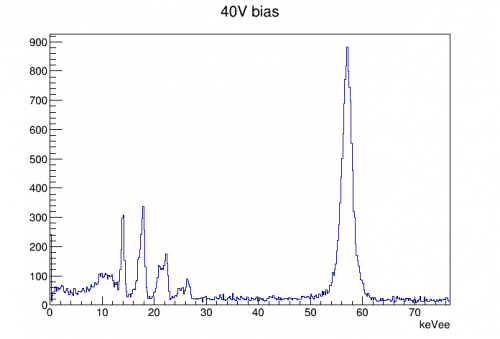 |
| PsumOF quadratic calibration to 14keV and 18keV lines, fixed at 0,0 |
Again, the bias noise starts to dominate above 40V bias. More work should be done to understand how this noise is different from r62, but it seems clear that 40V is likely the best setting in the current configuration. Note that these biases have not yet been corrected for leakage voltage which may change the bias axis by ~5%.
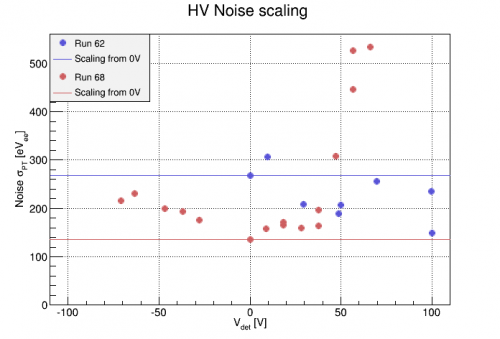
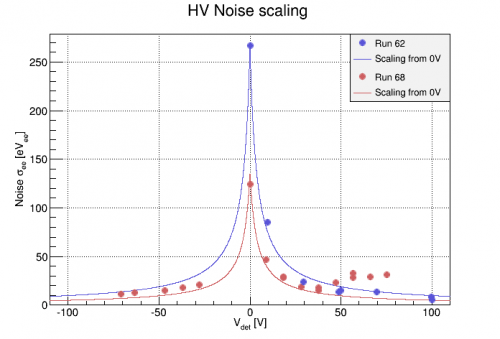
Update: Data taken in late August showed that the noise threshold improved with negative bias. The figure below includes such data points as well as the expected scaling of sigma_ee from 0V assuming no additional HV noise. It is clear here that an HV noise component comes in with positive bias, but does not with negative bias. Note that the figure below is plotted as a function of detector voltage, corrected for measured leakage current.
 |  |
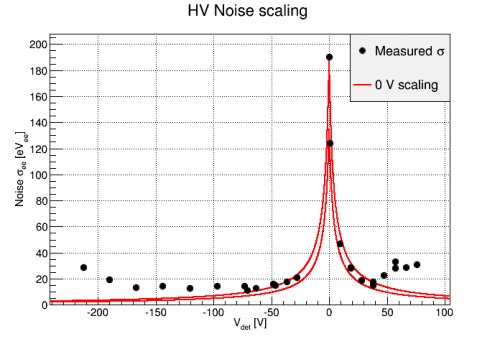
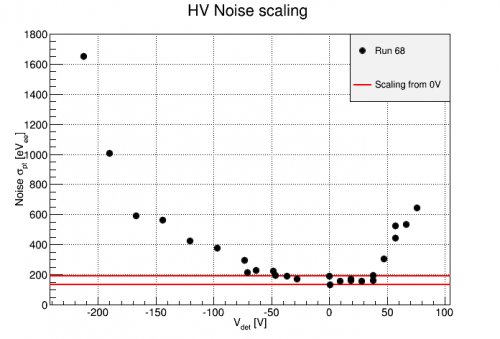
Data was taken at still larger HV values starting Sept 21. The noise level was assessed for these additional points as shown below. At negative biases, the noise level continues to improve down to about HV=-125V. Then, an HV-related noise component starts to dominate the Luke gain and SNR decreases. The naive noise scaling from 0V measured at two different points in run68 is also shown for reference. The 0V points were calibrated based on the 60keV line. The data from this most recent bias scan were calibrated to the 14keV line as described below for the -240V data.
 |  |
Noise Width vs. Prebias
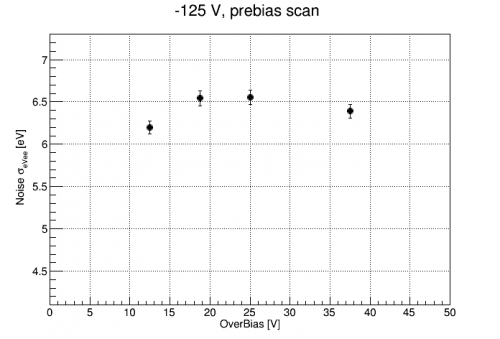
A small prebias scan was conducted at -125 V operating voltage on 10/01. Data was taken at -125V, with standard flashing between 2 hour series, but the preBias % was varied from 10%, 15%(standard), 20%, 30%. All prebiases were held for 5 min before the bias magnitude was reduced to -125V and data was taken for 2 hours. The calibration from all series was approximately the same. The plot below shows that the noise width, as measured by the randoms PTOFamps0 distributions, was relatively insensitive to the preBias amount, varying no more than 0.5 eVee.
 |
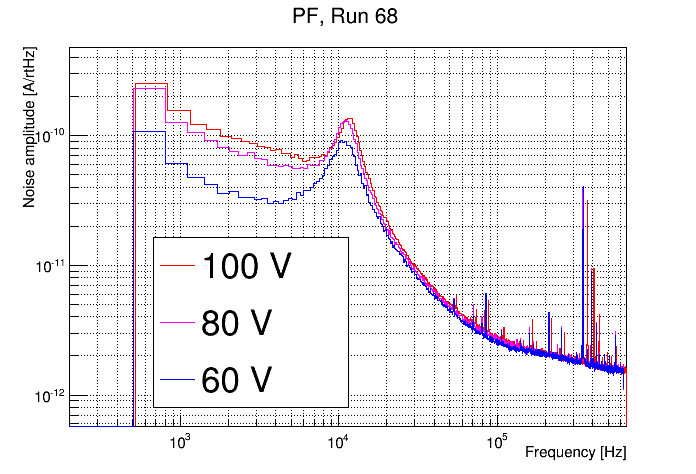
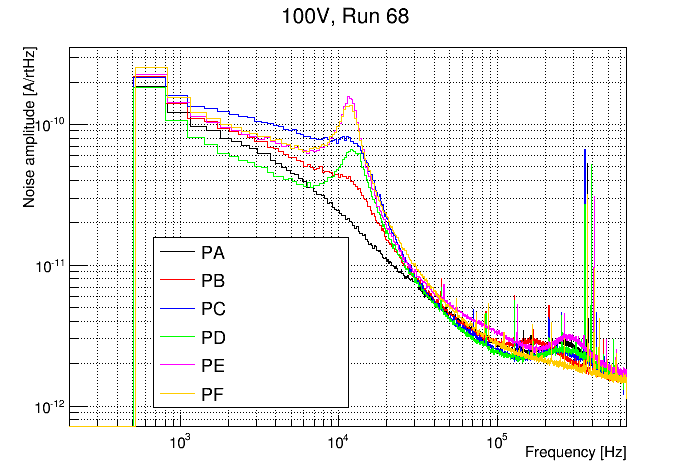
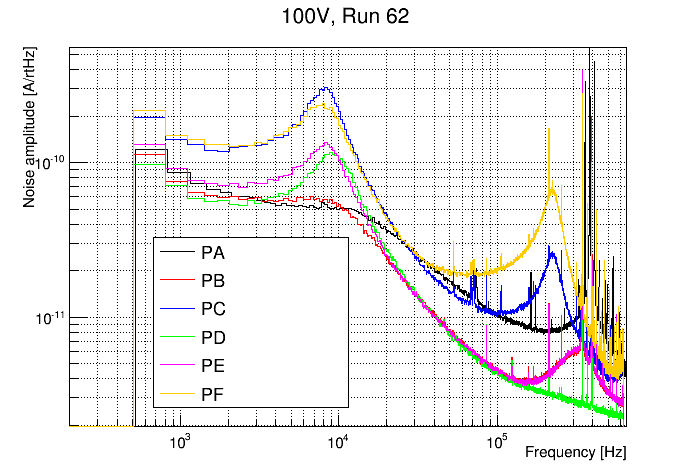
Noise PSDs
 | |
 |  |
Fridge issues
Previous mixture amounts here: 20150327
Notes on getting a mixture sample for mass spec: see 20150316. Basically the procedure is as follows:
- Evacuate sample bottle
- Have some mixture in LN2 Trap 1 (not sure how much). Mixture should all be recovered from fridge of course so isotopes are mixed in gas phase.
- Attach sample bottle to IGH vent and pump out lines leading to sample bottle inlet.
- Let mixture from Trap 1 into G1 volume, then isolate. (last time G1 read 87 mbar at this point.)
- Let mixture from G1 to P1, then isolate. G1 should fall to near zero.
- Let mixture from G1 to bottle inlet, then isolate.
- Let mixture from bottle inlet into bottle, then isolate.
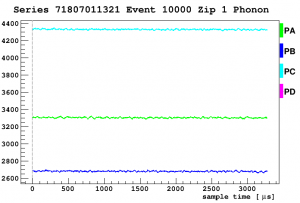
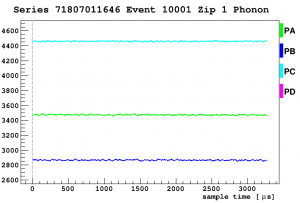
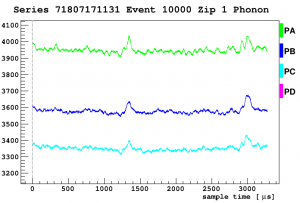
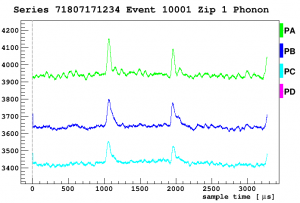
Weird phonon noise week of July 16
| Randoms | ||||
|---|---|---|---|---|
| July 01 | July 17 | |||
| 10V | 40V | 0V | 40V | |
 |  |  |  |
|
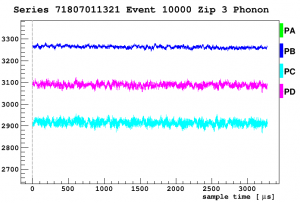 | 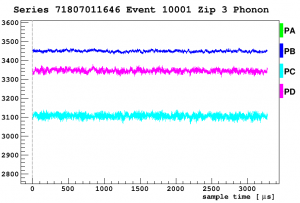 | 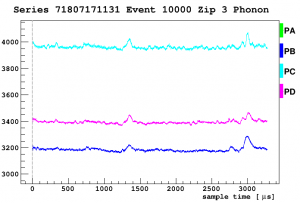 | 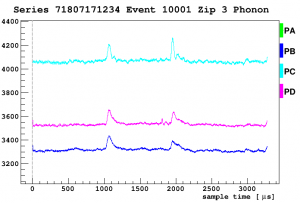 |
|
| Triggered | ||||
|---|---|---|---|---|
| July 01 | July 17 | |||
| 10V | 40V | 0V | 40V | |
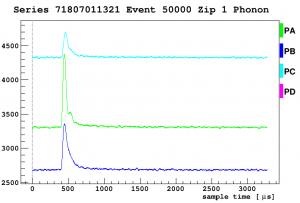 | 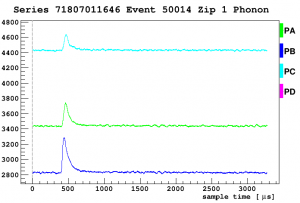 | 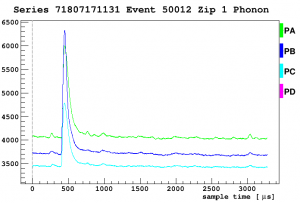 | 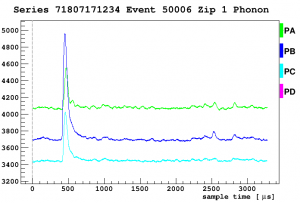 |
|
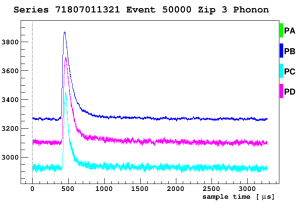 | 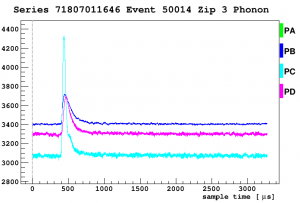 | 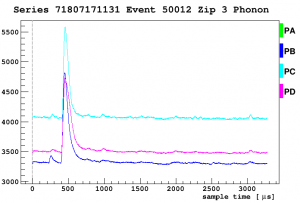 | 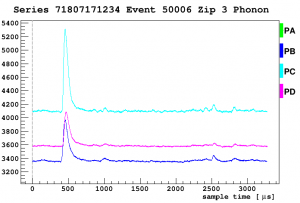 |
|
| Noise | ||
|---|---|---|
| July 01 | July 17 | |
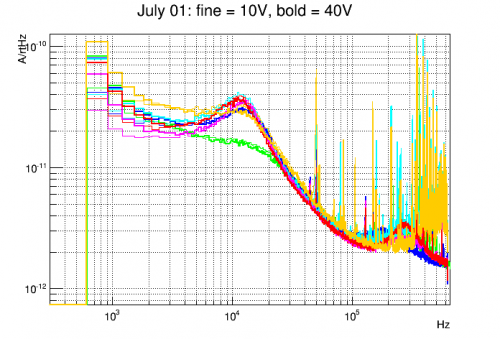 | 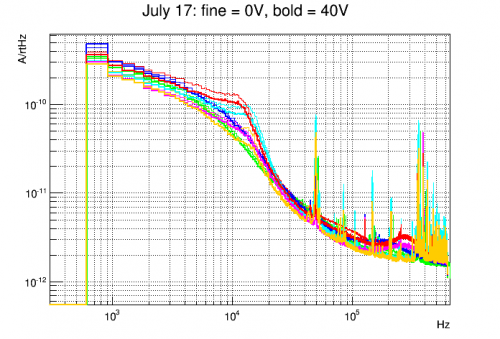 |
|
| July 17 |
|---|
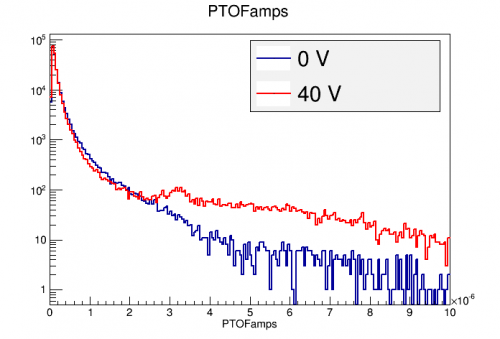 |
| The 60keV peak can be seen at ~3 uA in the 40 V data. |
NaI Detectors
Neutralization hold time study
On July 2-3 we took 10 hours of data (divided into 15-minute series) at 50V without flashing. This note looks for signs of loss of neutralization.
| Energy versus time |
|---|
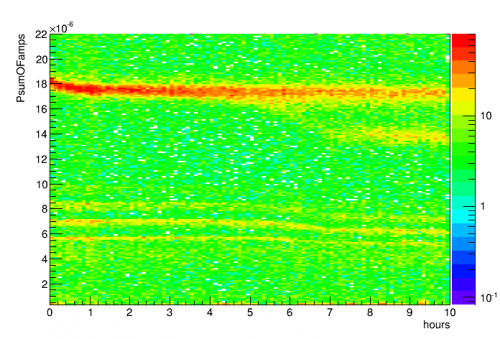 |
Starting around 6 hours there is a distinct change, with the low-energy Am lines shifting down to a different lower amplitude, and with a second lower peak splitting off from the 60keV peak. Note that the more subtle changes in amplitude over time may be the result of drifting HV leakage current which hasn't been corrected for here.
| 60keV width versus time |
|---|
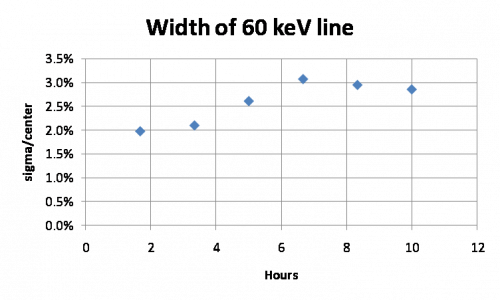 |
The relative width of the 60keV line starts to get noticeably worse after about 5 hours.
| Noise width versus time | |
|---|---|
| Using a different calibration per 15 min series | Using a global calibration |
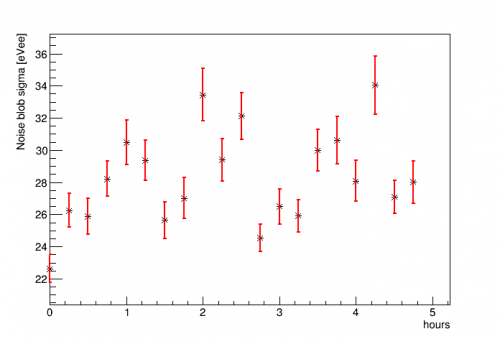 | 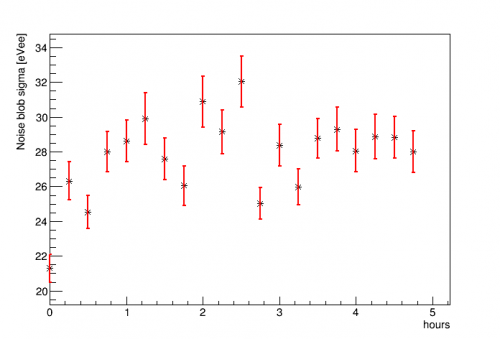 |
The noise width for the first 5 hours is plotted above. The calibration is the now-standard method: a quadratic fit to the 14 and 18 keV lines constrained to pass through 0,0, based on PsumOF. There is some scatter but there's no clear indication of degradation in the noise width over 5 hours.
Note: this data was taken with the PuBe source present, but the voltage is a little higher than our standard 40V. So it may be that hold time is somewhat less in the 40V case.
Time-dependent Calibration
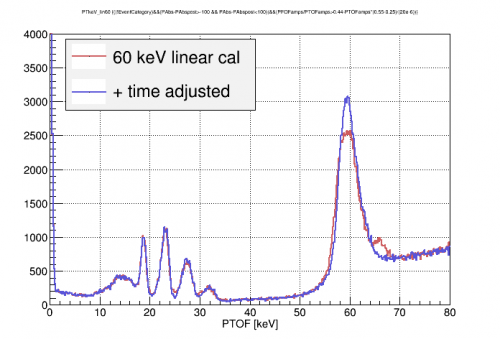
The calibration seems to drift down over time from the beginning of each series after a flash. This can be seen in the 241Am peaks in the figure below. The upper left plot shows some series taken over 2 days. The lower left plot is the result of stacking these series based on their start times. The 60keV peak is fit by eye with an exponential decay to a constant value. The right plot shows that a correction of this time-dependence improves the 60 keV resolution, but has little effect on the lower energy lines.
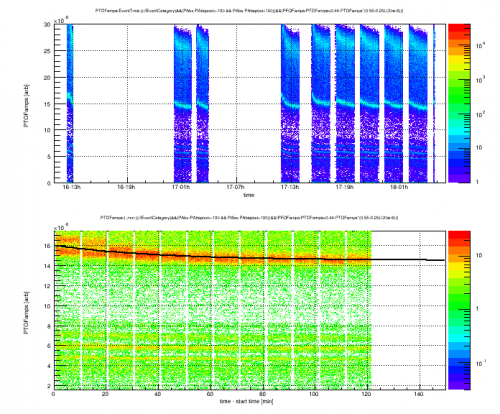 |  |
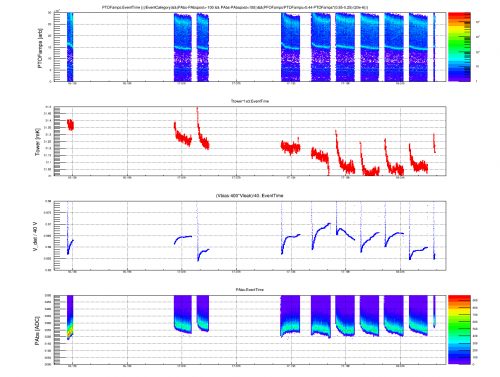
The HV detector calibration does not seem to be due to either the tower temp or detector bias. These are also plotted versus time in the figure below. The tower temperature has a similar relative shape to each series, but over the 2 day period shown it falls absolutely while the calibration lines do not. Detector bias (Vbias-Ileak*Rbalast) sets the Luke gain and should affect the HV detector spectrum. However, the variations in Vbias are both too small and in the wrong direction to account for the decreasing HV calibration lines. The baseline of one channel (PA) is also shown. This is another proxy for detector temperature and mostly follows the same trends as Tower temperature.
 |
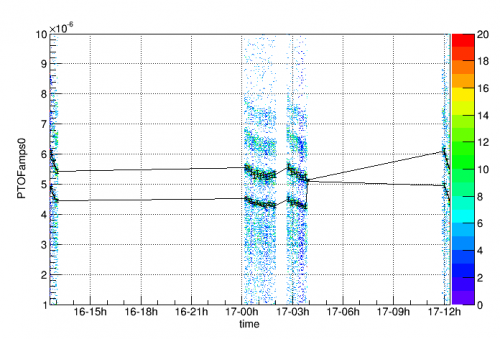
Update: 6 Sept A closer look at the -40V data shows that the lower peaks used for calibration also have some time dependence. An effort is now under way to fit these peaks in every 10 minute time period to provide a time-dependent energy calibration. An example of this is shown in the figure below where the two lowest peaks have been fit in 10 minute slices for 5 hours of data. In it's current form, the algorithm is decent at finding and fitting the peaks. In some instances (such as around 17-04h) it confuses one peak for the other. These will need to be checked for and corrected.
 |
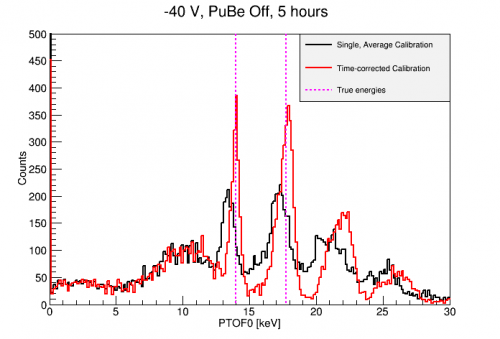
Using the time-corrected calibration clearly improves resolution of the low 241Am lines as shown below. Hopefully these calibrations are still valid down to the ~1keV scale.
 |
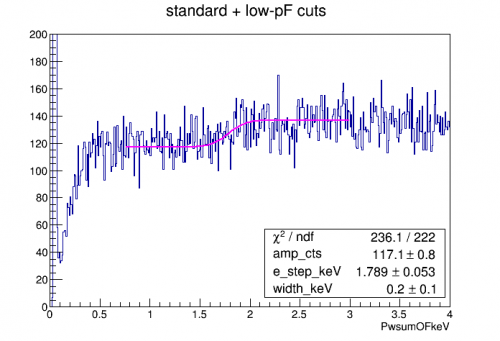
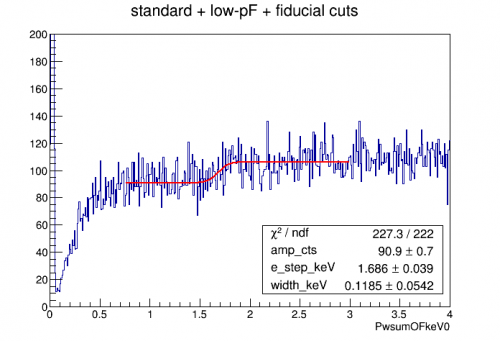
Compton Step
The Compton steps (1.839 keV, 0.099 keV) are possible low energy calibration features in Si. 133Ba data was taken in an effort to observe them. The plots below shows the spectrum from the first 4 hours of this data. Cuts were included to remove randoms and sloped baselines, to ensure OF/INT consitency and to ensure OF0/OF consistency. PF and PA partition cuts were also used to exclude high radius events (with incomplete Luke gain) and the 241Am events at low radius.
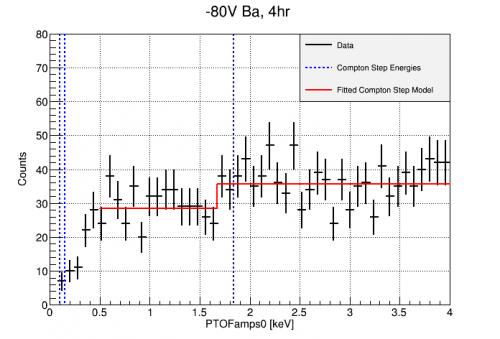 | 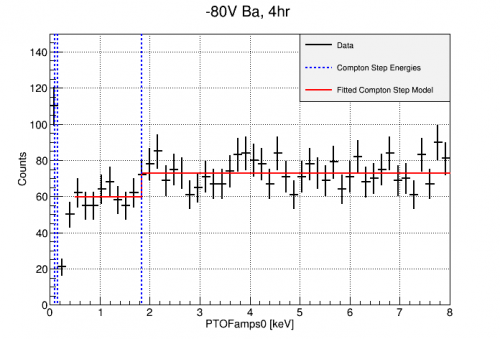 |
A hint of a step may be seen, though the region from 2-4 keV is not completely flat. More statistics will certainly be needed to confirm.
Na22 data update
| PT calibration | |
|---|---|
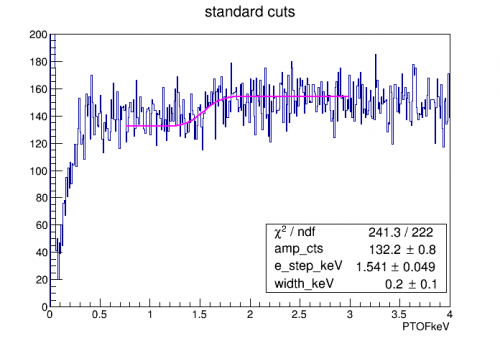 | 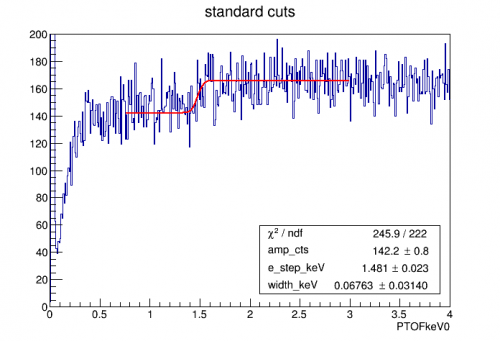 |
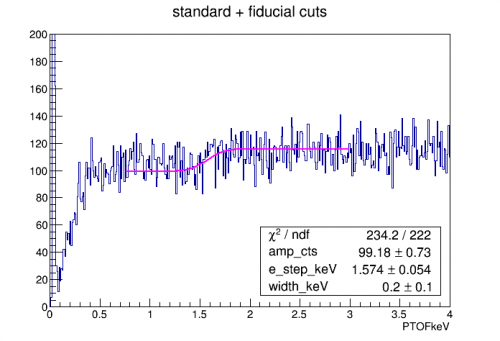 | 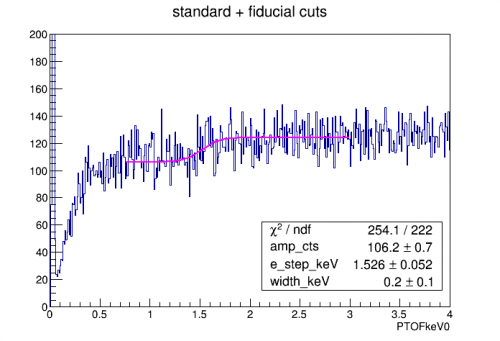 |
| Weighted Psum calibration | |
|---|---|
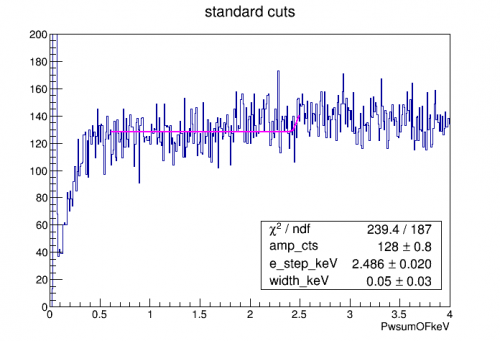 | 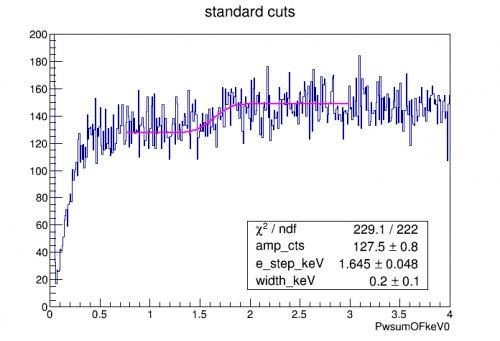 |
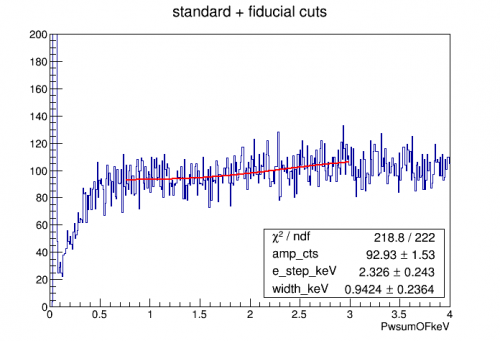 | 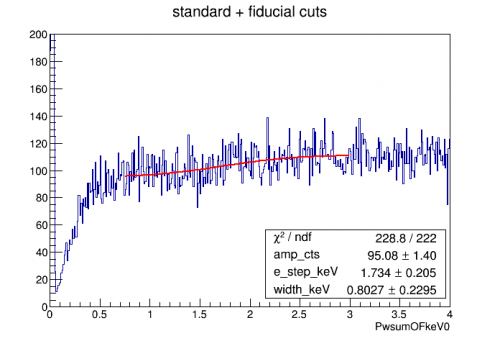 |
| Weighted Psum calibration, modifications | |
|---|---|
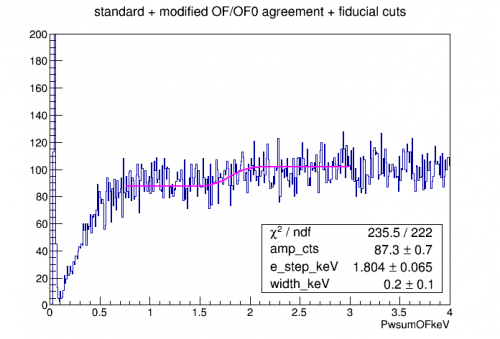 | 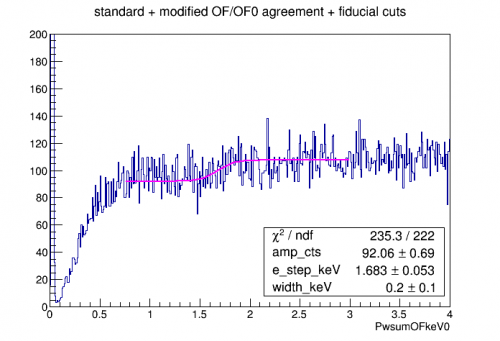 |
 |  |
Am-241 Spectrum
| 41.2 hours of -80V background data | ||
|---|---|---|
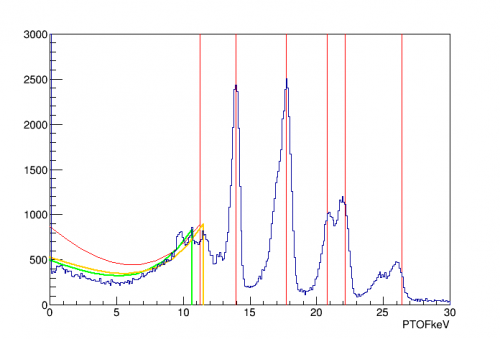 | 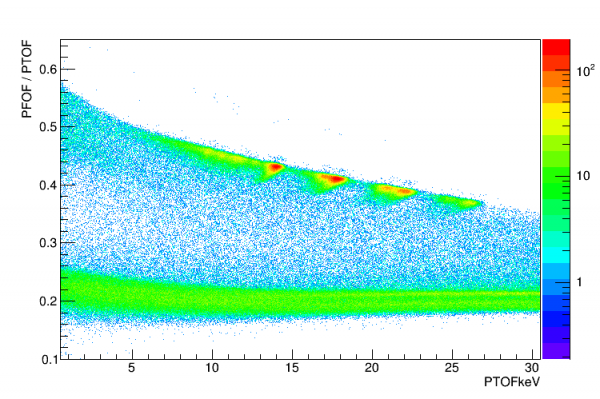 | 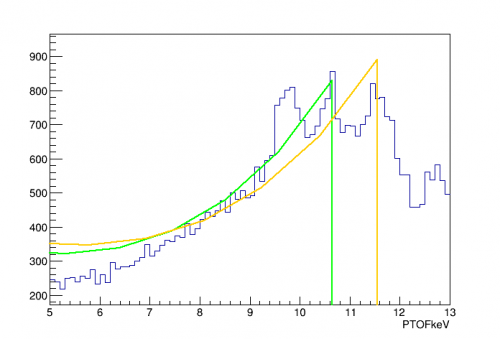 |
With 41.2 hours of background data we can produce a very detailed Am spectrum, particularly if a high-pF fraction cut is applied as above. There are three peaks close to one another below the 14 keV calibration line.
The first plot above uses the standard calibration technique - a quadratic fit to the 14keV and 18keV lines constrained to (0,0). One of the lower peaks should be the Compton edge for 60keV gammas, at 11.25 keV. In red is a calculated Klein-Nishina Compton spectrum; in orange and green are modifications of this curve, scaled to the 2nd and 3rd peak positions and also applying a simple geometric attenuation factor (180-degree scatters are probably more likely to escape without a second scatter than smaller angles). The right plot is a zoom of this. The middle plot shows that all the peaks and the apparent Compton spectrum are at high pF-fraction so they seem to all be associated with the centered Am source.
Since we use a lead collimator disk, Blas Cabrera suggested we look up Pb fluorescence lines - and there are indeed such lines at around 10.5 keV and 12.6 keV. So one possible identification is that the three lower peaks are the Compton edge and the two Pb lines.
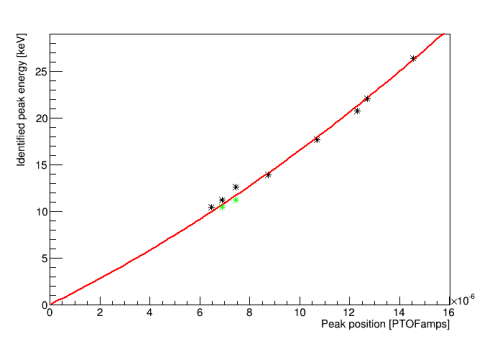 | 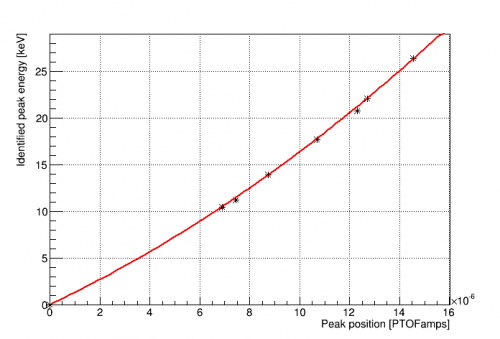 | 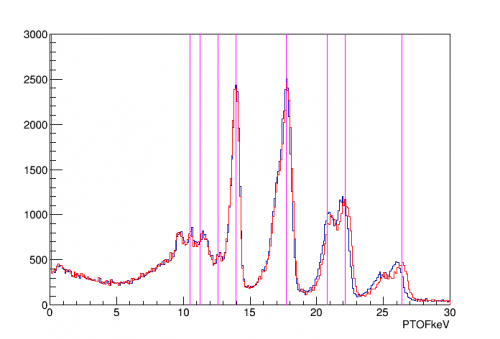 |
The first plot above is a calibration curve using the above described line identifications. There's tension in fitting the lower lines. An alternative ID of two of the lines is shown in green. The second plot shows this alternative identification - a much smoother fit. The third plot shows a spectrum based on this calibration in red, and the original calibration based on the 14keV and 18keV lines in blue. Magenta lines show the true energies of the identified lines. Now it looks like the 12.6 keV Pb line is the small feature just to the left of the 14keV line. The lowest line remains unidentified. Noah claims there should be an Am line at 9.9 keV but I can't find a reference to it.
-240V Data
On 20 Sept, the bias was scanned down to -250V without any clear signs of breakdown noise in the traces. Some data was collected at this bias.
The calculated template OF seemed to have trouble with these saturated pulses. The 241Am lines were identified with the Integral F partition seen below left. From this, an approximate linear calibration of PTINTall to the 14keV line was made. This INT calibration was then used to calibrate the OF using the region from 1-8 keV as seen below right. |
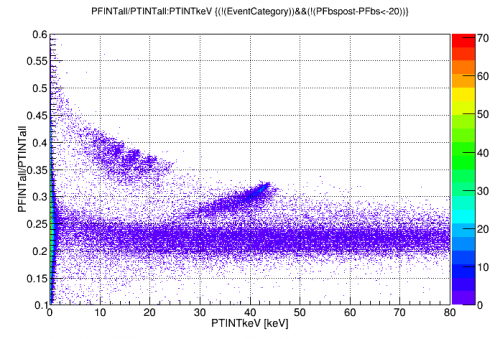 | 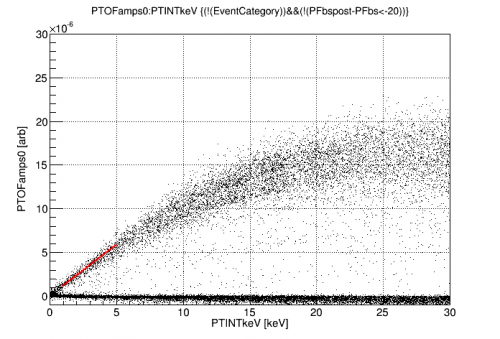 |
This calibration gives the spectrum below on the left, where the only cuts applied are to remove randoms and pulses on tails. The randoms distribution is shown below right and has σ = 13.6±2 eVee according to this calibration. The uncertainty in calibration to the 14keV line is estimated to be ~15%. If true, this noise is a little worse than observed at -80V.
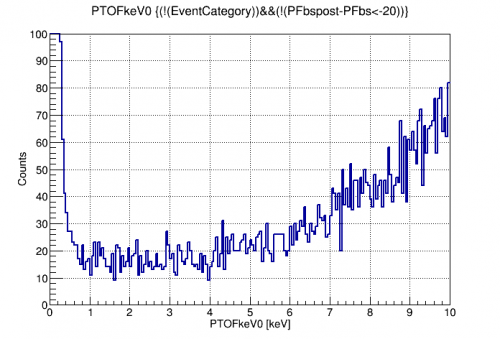 | 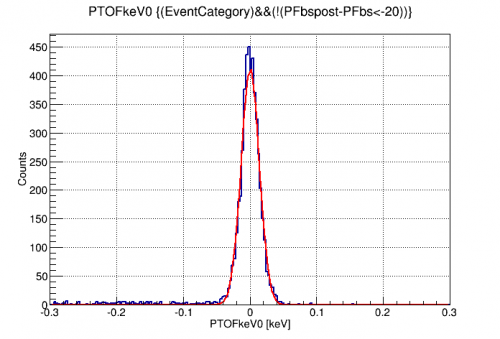 |
-125V Analysis
It was found late in the run that the optimal SNR was achieved around -125V. The spectrum was mostly flat below 10keV as shown on the left. On the right is the HV spectrum below 1 keV. The signal hump appears in the expected place and the noise width is 7.9eVee.
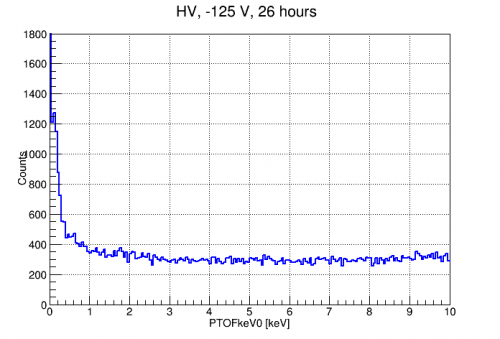 | 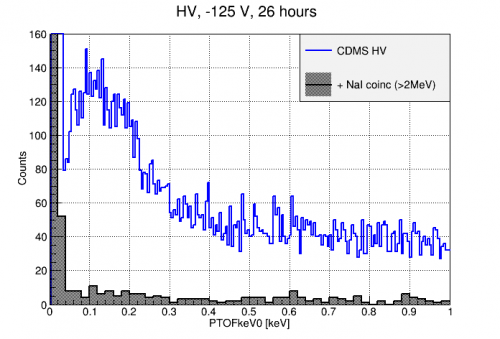 |
A full analysis can be found here: -125 V Analysis