Table of Contents
Neutron coincidence data
Below are plots from 2 hours of 40V PuBe data, triggered on SiHV with low thresholds.
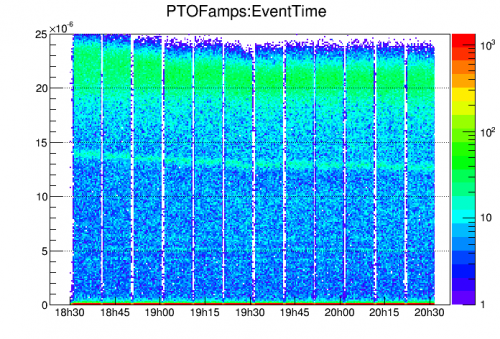 | 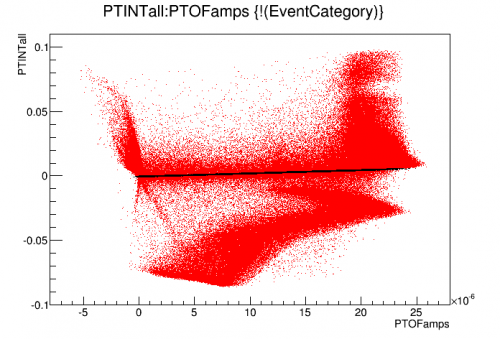 | 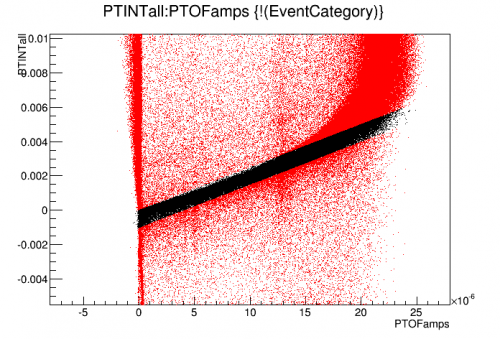 |
| Line positions vary a little over the 2-hour duration | A cut requiring consistency between the PTOF and PTINT RQs removes most pileup events and also late-trigger events (which occur frequently due to oscillations after the peak). |
|
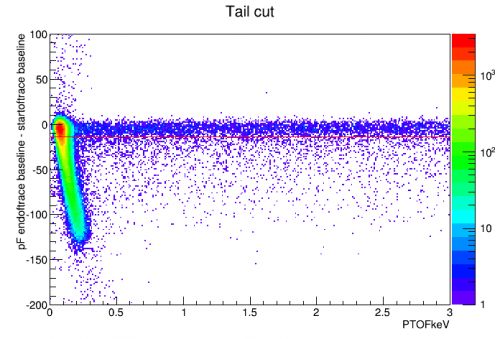 | 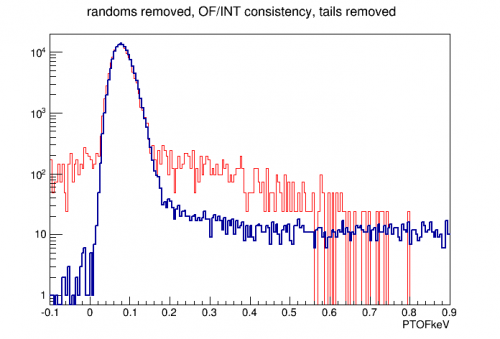 | 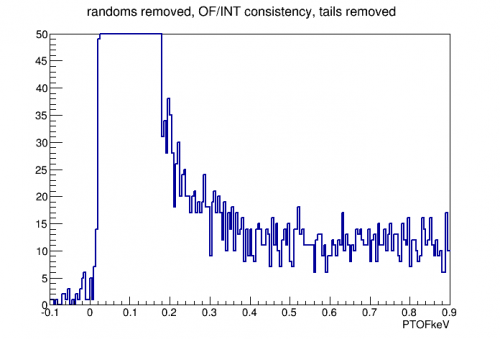 |
| A cut to remove tails, requiring that the change in baseline (post minus pre) be greater than some threshold, is necessary because noise pulses on a tail can reconstruct to energies just above threshold | Low-energy spectrum in PTOF calibrated to keVee. Red is a randoms spectrum scaled to the same amplitude. | Same spectrum in linear scale |
Update
Below are plots from 10 hours of 40V PuBe data, triggered on SiHV with low thresholds.
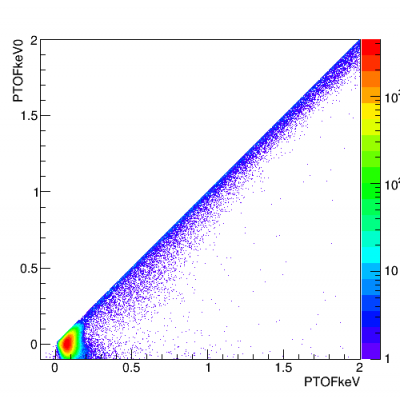
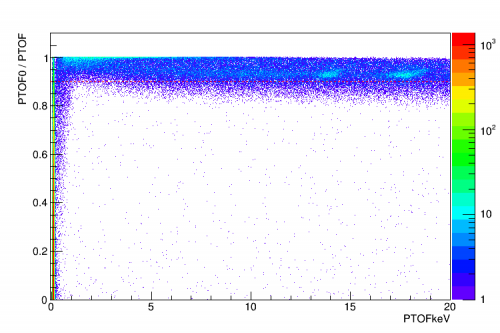
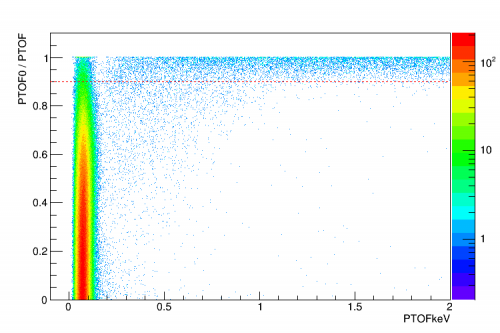
PTOF0 (the OF with fixed start time) is better behaved at low energy than PTOF (OF with variable start time) because noise events are fit in an unbiased way. But some PTOF0 values are lower than the PTOF value because the optimal start time is not zero, so we want a cut to remove these mis-fit events.
 | 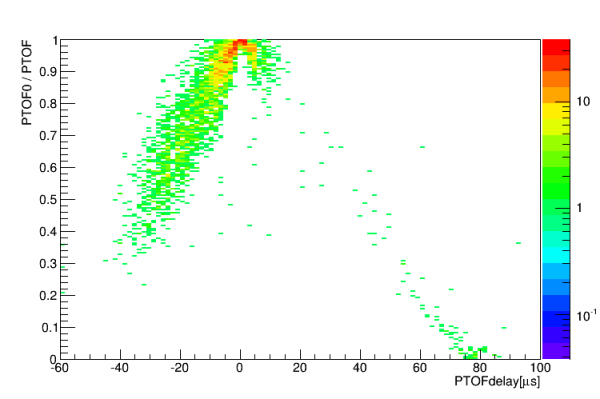 | 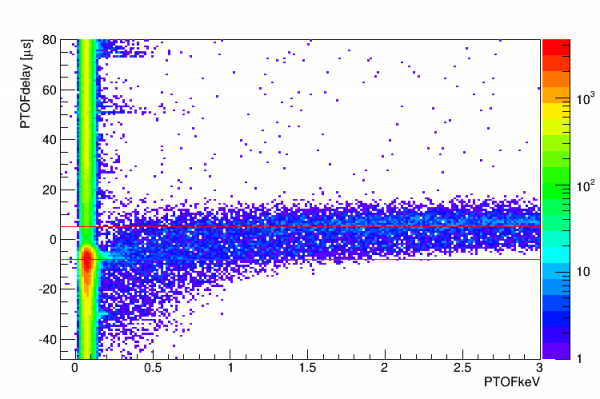 |
Initially a cut was applied restricting PTOFdelay. The second plot above is for a range 200-500 eV. But the plot on the right suggests that a flat cut on delay will have a clear energy bias. So instead I built a cut requiring PTOF0/PTOF > 0.9.
 |  |
We will also probably want a fiducial cut to remove high-radius events where the Luke gain will be reduced. Below are two plots showing Channel A (outer ring) and Channel F (center) proportions of total energy:
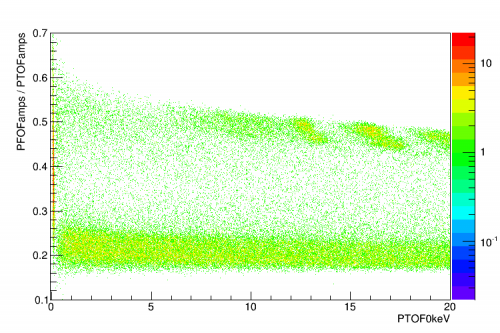 | 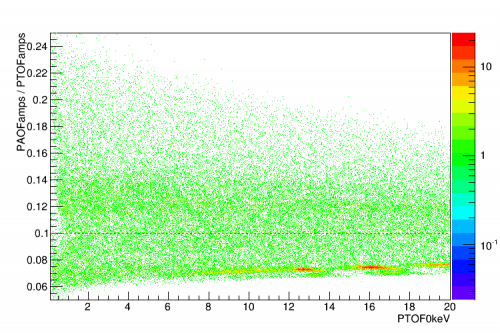 |
The 14keV and 18keV peaks are clear in the above plots, with a high fraction of energy in pF and a low fraction of energy in pA. The pA plot has a faint upper band which may be a population of events near the outer rim. A simple fiducial cut was written restricing pA/pTotal to <0.1.
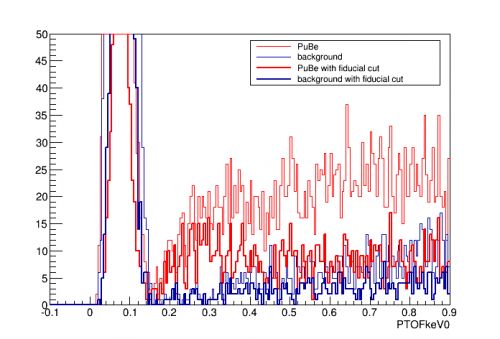 | 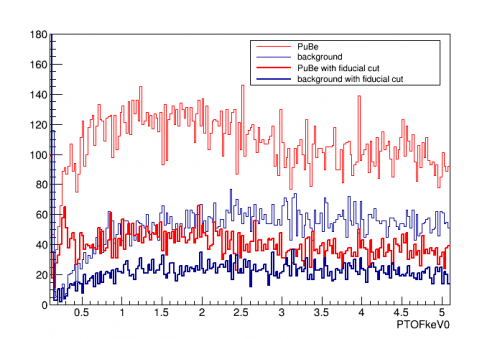 | 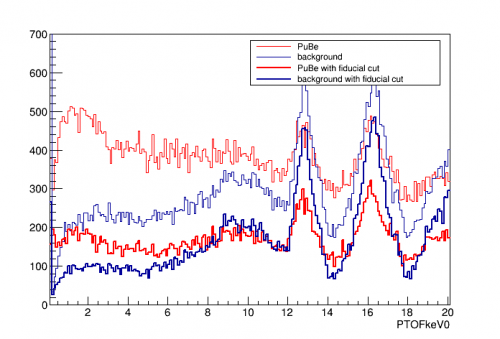 |
Above are spectra with all quality cuts applied, and with and without the fiducial cut. 10-hours of PuBe data and 10-hours of background data are compared. It looks like there may be an excess around 400eV down to threshold - is this a hint of n,γ recoil signal? In this 10-hour dataset there are 486 events between 150 and 450 eV that pass the quality cuts and fiducial cut.
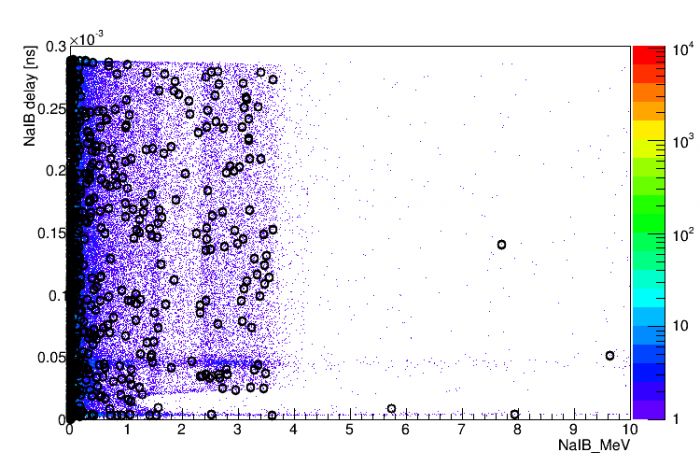
Of the 486 events in the region of interest, a quick check of the NaI data shows 17 events in a coincident time window and with above-threshold energy. Only 1 of these has an energy above 1.9 MeV according to Nick's calibrations (NaI-B = 9.6 MeV, SiHV = 301 eV). These rates are approximately consistent with the appearance of NaI events in randoms. This is not encouraging for the notion that these are n,γ recoil events. The effective solid angle for the NaI detectors is I think around 4% - if so there should be around 20 high-energy NaI coincidences for 468 n,γ recoils.
Update 2
Nick repeated this analysis with datasets p40_bkg_2 (63 hrs) and p40_PuBe_2 (67 hours). In this data, each 10 min series was calibrated to the 14 and 18keV lines using PTOFamps0, the resulting time-corrected energy quantity is PTOFamps0_TC. A hint of a possible capture feature is apparent in the HV detector spectrum, but there is little corroborating NaI coincidence information.
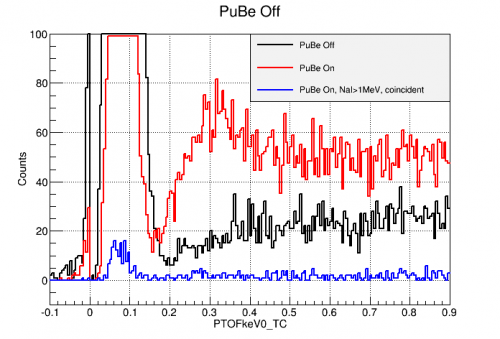 | 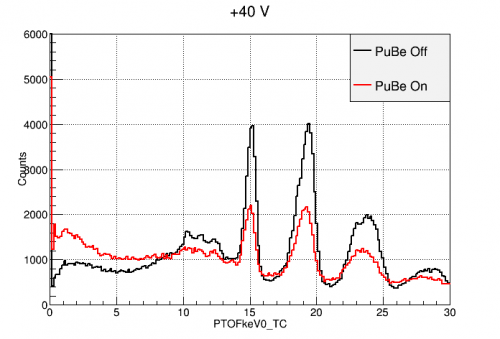 |
| SiHV time-corrected energy spectra with all of the above cuts applied. A spectrum is also shown of those events which have a coincident (40 us < 50%RT < 80 us) NaI event with >1MeV. The time-dependent energy correction has resulted in a slight shift of the aggregate 241Am peaks, which has not yet been corrected in these figures. | |
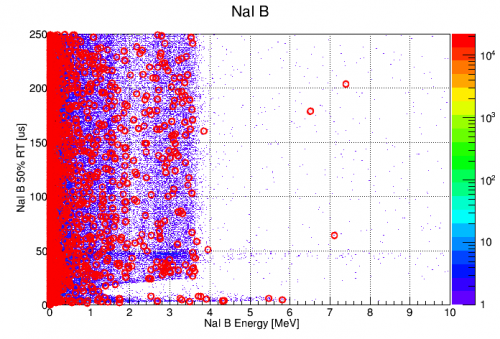 | 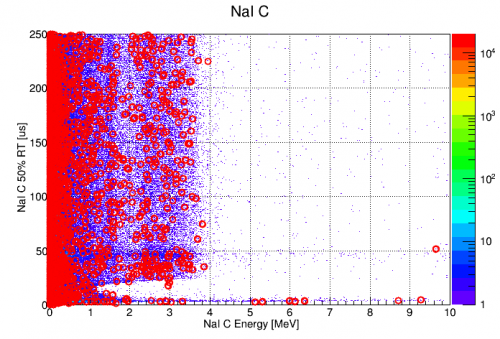 |
| NaI energy-timing plots for good events in the SiHV energy ROI from 200-500 eV. | |
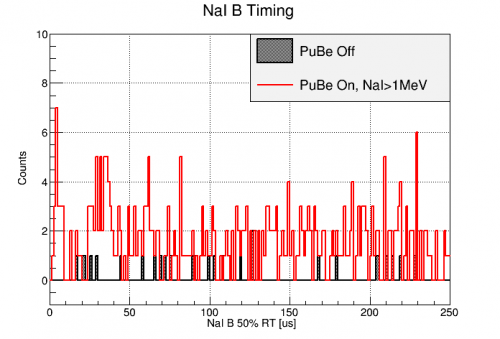 | 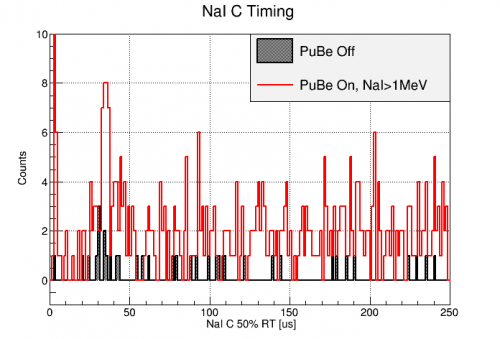 |
| NaI timing distributions for good events in the SiHV energy roi from 200-500 eV and with >1MeV in the NaI detector. The timing excesses are close to the region where the WK algorithm starts to fail, so care should be taken in interpreting these. | |
-40V and -80V data
We've seen that noise is lower at -40V than +40V, and that signal-to-noise continues to improve with increasing bias in the negative direction. This section looks at 24 hours of -40V data and 28 hours of -80V data.
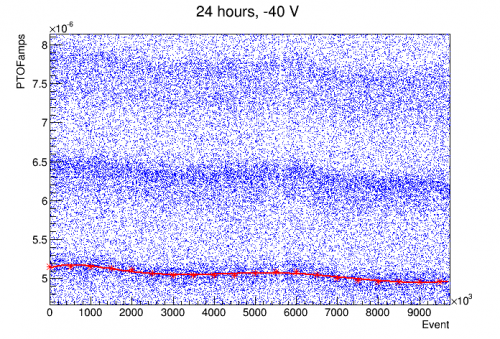
The plots below investigate stability of the gain over time. The 14-22 keV lines drift a bit over the -40V data; the -80V data is more stable. A simple time correction was applied to the -40V data (a 6th degree polynomial applied to a rough-fit to the 14keV drift).
 | 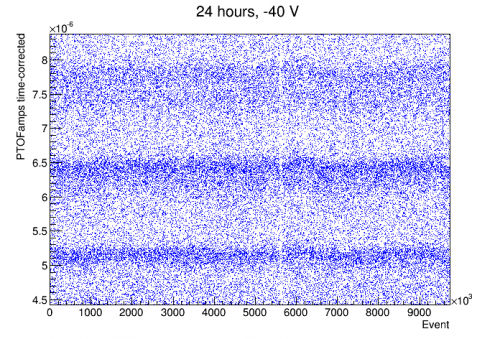 | 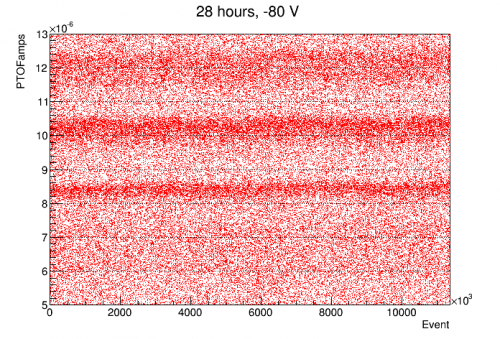 |
The plots below show the PuBe spectrum comparing the -40V and -80V datasets. The -80V dataset has been scaled down by the nominal time ratio. The expected rise is seen at the low end of the spectrum with the reduced threshold in the -80V data.
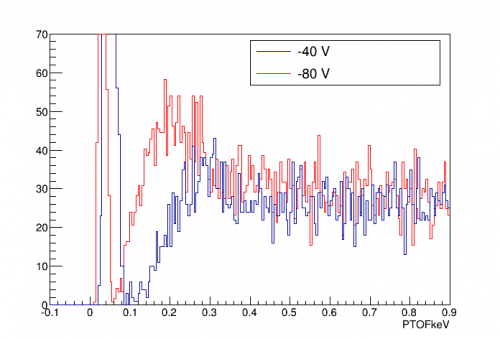 | 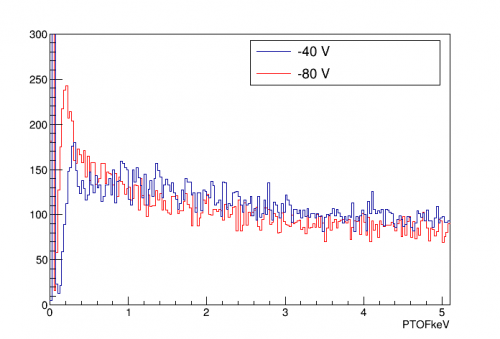 | 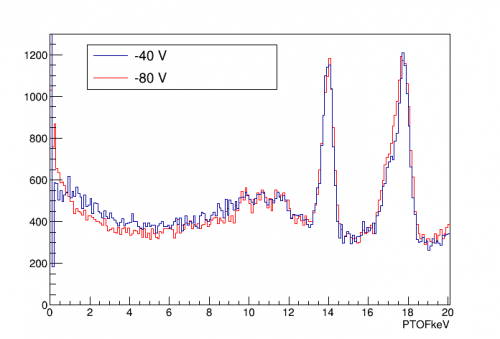 |
The third, wide spectrum above shows very good rate agreement in the region of the two calibration lines. The rate does not agree as well in 9keV and below range. This could be a difference in calibration between the runs - this is expected because the quadratic fit between the 14keV and 18keV lines down to 0 keV is an approximation, and there will be a systematic error outside the fit lines which will be different in the case of greater Luke gain, because the calibration lines will be more saturated. It's not known how large an effect this would be.
It's also possible that the cuts have different efficiencies in the two cases for some reason, though apparently not in the 9-20 keV range.
The figure below is a look at the Am-241 spectrum. A high-pF-partition cut has been applied to make the lines sharper. The 14keV and 18keV show up right where they should of course; higher lines look like they show up too low, not surprising considering saturation effects.
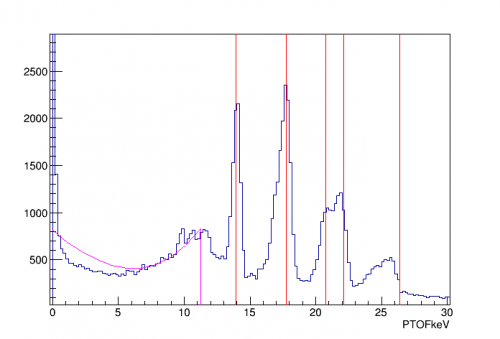 |
There are lower lines in the 9-12keV range. I don't know what they are. In a presentation Noah gave once he listed lines in this range but didn't identify them. One is likely the Compton edge of the 60 keV line, at 11.2 keV. The magenta curve above is a Klein-Nishina curve for a 60keV peak, scaled empirically. (Likely there would be a suppression at small scatter angles – <90° corresponds to <6.2 keV – because the gamma would be more likely to interact again as it moves further through the detector.) It looks like the peak may be a little high, which would be consistent with the systematic bias in the lines above the calibration lines (all the lines are pulled closer to the calibration lines).
I have no idea yet what the two peaks below the 60keV Compton edge are.
It would be good to see identifiable lower energy features. In Run 62 we were able to see the 3.2 keV peak as in this spectrum at 50V, but we haven't seen it yet in this run. (Run 62 suggests that it would not be a good calibration line anyway, probably because the events are too close to the surface.) Another thing to look for is the Compton step that should appear at the 1.5 keV K-shell energy. We haven't taken background data (no PuBe) at -70V yet - maybe these features will be clearer in that data.

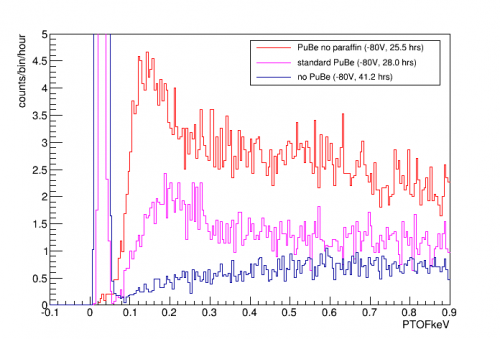
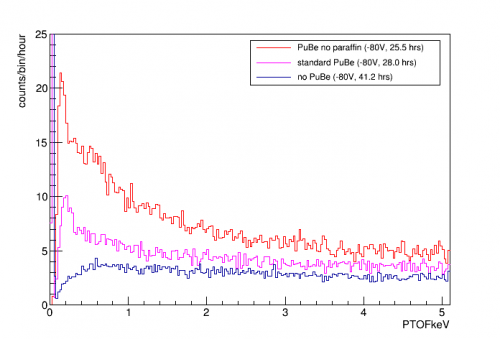
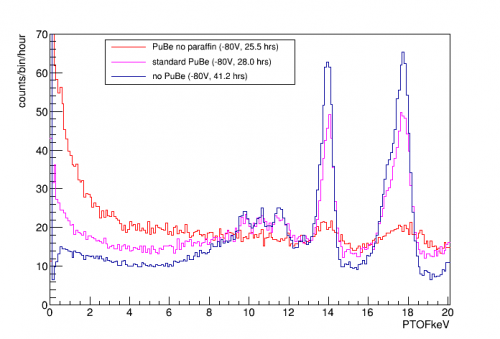
Unshielded PuBe (no paraffin)
 |  |  |