Table of Contents
R68 Simulations
Anthony constructed and ran a large G4 simulation of the R68 setup (/data/chocula/villaa/k100Sim_Data/captureCal/Run68_gdirect_bknd_R68_PuBe_0x0006_10M_155*; careful there are over 40k text files). It included the full fridge geometry, PuBe source(neutrons and gammas), CDMS detector, and NaI detector(s) on the South shield wall. It is expected to do a good job of propagating the neutrons and gammas through all material. It should also provide correct Compton and elastic neutron scattering signals in the CDMS detector as well as the neutron capture process. It also attempts to handle the resulting physics after n-capture, but we don't believe the physics is correct there. While there is work being done to incorporate the correct nuclear physics into Geant4, for now, this part of the signal will be simulated using a separate code developed by Anthony.
n-capture
Anthony's instructions on getting started
Python3 setup
Some notes on how to use Anthony's Python3 environment.
Data Analysis
Let’s start here; I have skimmed files to a single .h5 (hdf5) file for reading into Python. Take a look at the following Jupyter notebook:
~villaa/analysis/cdms_simulation/k100_ncapture_cal/R68_gdirect_spectra.ipynb
Copy it over to your directory somewhere and try to run it. Or if you like you can clone my whole repository with the simulation analysis code for this project:
git clone /data/giacdms1/villaa/repositories/analysis/k100_ncapture_cal
Once you have the notebook, run:
source activate py373_gammapi
to access Anthony's Python3 environment. Then run:
jupyter notebook
to start jupyter. This should open in your default browser. It will also print a url on the command line that you can copy into a different browser if you prefer.
The notebook mentioned is in the top directory. It references the following hdf5 file with our simulated data (Not very eloquent naming, sorry.):
/data/chocula/villaa/k100Sim_Data/captureCalhdf5/R68_gdirect_testskim_megahighstat_nocap_new.h5
The trick here is; I skim out exactly the events you want, so we have to go back to the skimming program and modify the cuts. The skimming program is here:
/home/phys/villaa/analysis/cdms_simulation/k100_ncapture_cal/sima2py/sima2py.py
Spatial Distribution
The notebook at
/home/mast/cdms/analysis/run068/simulations/k100_ncapture_cal/R68_gdirect_first_distribution.ipynb
investigates the spatial distribution of simulated events in the CDMS-HV detector. A few resulting plots are shown below.
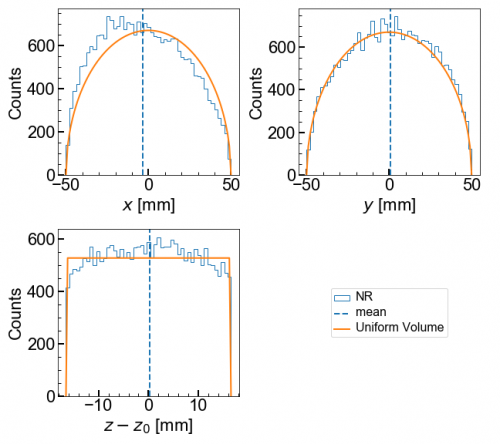 | 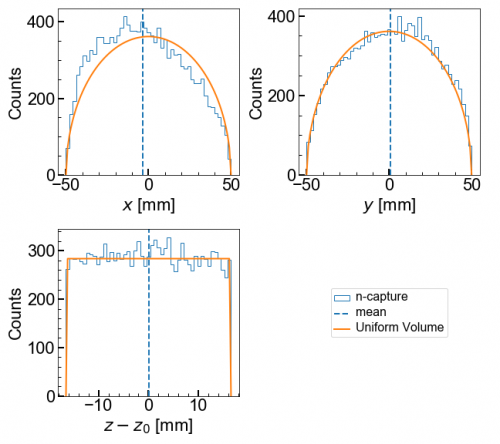 |
| Distributions of simulated Left:NR events and Right: n-captures in the CDMS-HV detector. | |
|---|---|
NR and capture events are distributed slightly closer to the southern (unshielded) side of the detector. The NR events seem to be biased away from top/bottom. This bias is because the energy-weighted average position of events with multiple hits will be biased away from edges. This has been confirmed by showing the distribution of first NR hits is uniform in z. The simulated capture (x,y,z) locations forming the above distribution have been saved at:
/home/mast/cdms/analysis/run068/simulations/k100_ncapture_cal/data/R68_sim_gdirect_cap_xyz.pkl
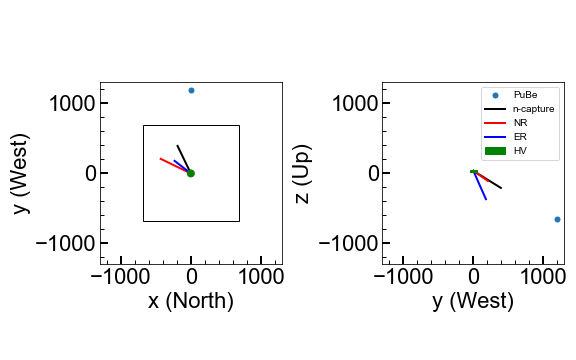 |
| Average P1 directions of simulated events in the HV detector. |
|---|
The average pre-hit momenta are from the south-west, somewhat in the direction of the PuBe source.
Energy Distribution
The distribution of initial energies (E1 in Geant4) of neutrons prior to hits marked as a capture (nCap==1) was investigated. As seen in the blue hostogram in the figure below, the majority of capturing neutrons have thermal energies. However, there is a population of events with 5-10 MeV included as well.
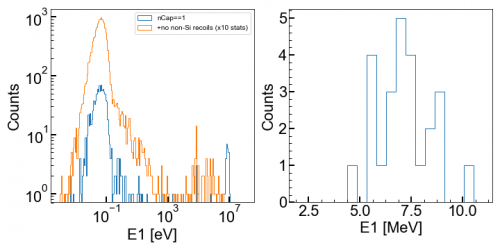 |
| Neutron initial energies (E1). Blue hist shows events labelled as captures, while orange r has 10x stats and removes (n,p) reactions. |
|---|
Those events are likely not neutron captures, but (n,p) reactions which were misclassified. It was discovered that the condition used in the simulation to identify n-captures is that the n track stops and and no new n's appear. However, reactions like 28-Si (n,p) 28-Al will also meet this criteria. Additional evidence that this is the source of these events are resonances in the reaction cross-section at n energies of 5-10 MeV.
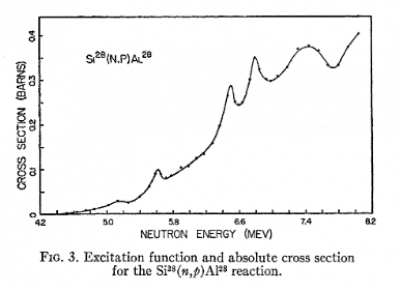 |
| 28-Si (n,p) 28-Al cross section, taken from physrev.101.247.pdf |
|---|
Combined ER/NR events
The cuts used to produce the NR and ER skims were defined such that any events with both ER and NR would appear in both of those datasets. However, the number of such events is low. One way to estimate it is to calculate the fraction of events that appear in both ER and NR skims which the same event number, 'EV'. This shows that <1% of the events in the skims are ER/NR. Because 'EV' numbers can be repeated, this estimate is an upper limit. Furthermore, the spectrum of such shared events appears to be relatively unlikely to affect the results in a meaningful way. The spectrum of ER and NR deposits for the combined ER/NR events are shown in the figure below. The NR spectrum has been converted to keVee using the Damic yield curve.
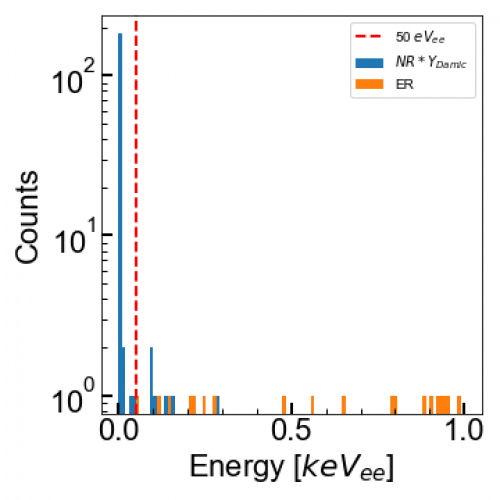 |
| Spectra of shared ER/NR events from the 'superhighstats' skims (~10% of total data). |
|---|
The NR portion is almost entirely dominated by events with <5 eVee. These are well below the measured noise wall (and eventual analysis threshold) of ~50 eVee and so will not affect the existing NR spectrum. Furthermore, combining these NR hits with the relevant ER events would only shift the observed ER energy by these <5 eVee, which will not change the total spectrum in a meaningful way. We conclude that it is therefor not necessary to treat these events separately, but rather to allow the double counting in the current skims.