Table of Contents
True position estimates (final version)
Link to original version
The original version of this note was based only on Run 71 pre-natal measurements of the source mover. The results below are based also on post-mortem measurements.
Overview
To determine the y-position of the movable source at various times during Run 71, we can make use of some benchmarks (from room-temperature distance measurements) and inferences from the number of steps moved. To know how many steps the source was moved we need to infer the “step efficiency” for all the move commands sent to the motor - how many steps it actually moved compared to how many step signals were sent.
Recall that
48 steps = 1 full turn
32 full turns = 1 inch (at room temperature at least)
Measurements in the clean room
After the run on 2019 Dec 12 we determined how far from the center position the source could move before hitting the endstops at either side.
| Table 1 | |||
|---|---|---|---|
| full turns | steps | mm | |
| Near endstop | 16.58 | 796 | 13.16 |
| Far endstop | -52.25 | -2508 | -41.47 |
| uncertainty | 0.04 | 2 | 0.03 |
This was done by turning the shaft manually, counting the turns and “clicks” and watching the multimeter for contact. You can feel individual clicks as you turn the motor - empirically there are 24 clicks per full turn, so one click corresponds to two steps. The uncertainty is 1 click, amounting to 0.03 mm.
On 2019 Oct 12 we measured the blocker positions with a caliper.
| Table 2 | |||
|---|---|---|---|
| mm | full turns | steps | |
| Blocker 1 near edge | -4.59 | -5.78 | -277.6 |
| Blocker 1 far edge | -7.19 | -9.06 | -434.8 |
| Blocker 2 near edge | -25.05 | -31.56 | -1514.8 |
| Blocker 2 far edge | -28.12 | -35.43 | -1700.5 |
| uncertainty | 0.02 | 0.03 | 1.2 |
Thermal contraction considerations
The threaded rod and carriage for the source mover are brass, and the mover is mounted on a copper plate which also holds the endstops and the blockers. And of course the detector is germanium. Brass shrinks more than copper when cooled, and germanium doesn't shrink much at all. Below are approximate linear contraction factors for the three materials:
| Table 3 | ||
|---|---|---|
| ΔL/L, 300K → <1 K | rel. to Ge | |
| Brass | 0.0042 | 0.0031 |
| Copper | 0.00325 | 0.00215 |
| Germanium | 0.0011 | 0 |
The first two values are approximations from a plot in Pobell. The third is from an approximate numerical integral from a plot found online.
Considering the maximum span of the source between endstops - 54.8 mm - the contraction of brass can alter the position by as much as 0.23 mm. So that's probably enough that we should correct for it.
It makes sense to use a coordinate system corresponding to the detector at room temperature, so in the third column I've adjusted the brass and copper factors relative to the shrinking detector. We can use those to adjust the position for contraction. I'll use these relative detector coordinates, scaled to room-temperature lengths, from here out.
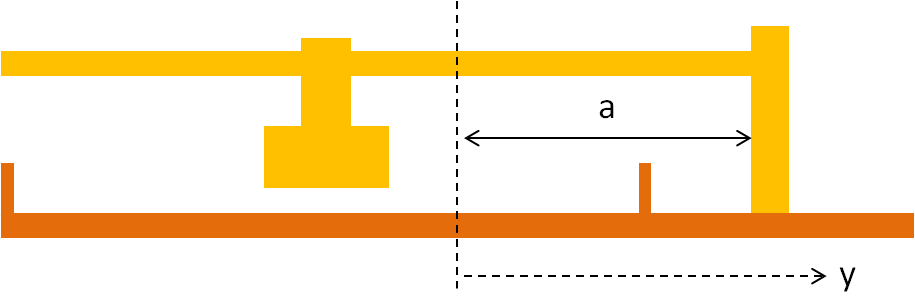
The schematic above shows the copper and brass parts. Since the brass shrinks more than the copper, there's a tendency for the source at any particular step-position to shift somewhat in the +y direction as the source mover cools. In terms of the contraction factors and the distance a (this was measured to be 30 mm on Dec 12) we can calculate the cold y position as a function of the warm position:
For example, if the source is at the center position when warm, it will be at y = 30*(0.0031-0.00215) = 0.029 mm when cold.
Check: number of steps between endstops
During the last part of the run we moved in the -y direction from the near endstop (closest to motor) to the far endstop. Here the step efficiency seemed to be 100%. One piece of evidence for this is that the actual source positions seem to correspond to 100% efficiency - this will be re-checked here. Another piece of evidence is a 48-step pattern seen in the temperature deviations while moving, suggesting that some parts of a full rotation meet more resistance than others - this pattern makes sense if every step command sent resulted in an actual step.
Let's see whether the number of steps it took to move from the near endstop to the far endstop agrees with what we would expect from the bench measurements. At room temperature we have
room temperature:
span between endstops = 3304 ± 3 steps
                      = 54.51 ± 0.05 mm
When cold it will be different, because 1) the distance between the endstops is smaller due to copper contraction and 2) the distance the carriage moves per step is smaller due to brass contraction. Since brass contracts more than copper the number of steps will be greater when cold.
In terms of the room-temperature span of the carriage between endstops, and the width of the carriage, we can calculate the cold span:
The width of the carriage seems to be 10 mm. To get the number of steps we divide the cold span (in mm) by the cold step distance (which is the warm step distance reduced by the brass contraction factor). We find
cold:
span between endstops = 3306.4 ± 2.8 steps
So it's only a couple more steps between endstops when cold than it is when warm.
Now let's compare to how many steps it actually took to move between endstops. On Nov 21 at 14:12 we apparently broke contact with the near endstop. That was during a sequence of 10 4-step moves, and the break occurred some time between the 5th and 10th move. Then another sequence of 10 4-step moves was done, then a long sequence of 231 4-step moves. Over the next four days we performed another seven sequences of 4-step moves, and on Nov 25 at 13:13 we made contact with the far endstop and stopped right after that 4-step move. Adding up all the steps we find
actual number of steps issued between endstops: 3332.5 ± 11.5
The actual number of steps is 26 ± 12 larger than the expected number (equivalent to 0.4±0.2 mm). There are two conceivable reasons for this. First, the early -y moves were done with different settings and sometimes showed poor waveforms, so they may have had lower step efficiency. Second, since the near endstop was jammed, it's possible that the endstop was bent back a little relative to its initial position, increasing the distance between the endstops. But the postmortem examination didn't really show this.
Let's consider the temperature pattern again that seemed to show 100% step efficiency. If the discrepancy between expected and actual steps above is due to an overall average loss, it implies a 99.2% step efficiency. This means that on average a step would be lost around once every 3 full turns. It may take 11 full turns to notice the change in pattern, because that would amount to 4 steps lost. We can examine more closely the temperature records to look for breaks in the pattern.
Examining the temperature records, we find that there is a span of 51 full turns (over multiple sequences from Nov 21-24) for which the pattern definitely persists. At most 4 steps could have been lost during this span, implying a step efficiency of at least 99.8%. A total of 67 full turns (3220 steps) were issued using the final, stable motor settings. It looks like there is a shift in the pattern after the first 9 full turns - but if anything it looks like it's in the wrong direction, because after the 9th turn the next cycle starts 1 move early, instead of 1 move late. There's another change starting 7 full turns from the end, where essentially the whole pattern changes, so no indication of loss or gain.
At the beginning, after we broke contact with the near endstops, there were 2.6-3 full turns (124-144 steps) with non-final motor settings - higher voltage set on the power supply. These moves heated the fridge more, and apparently had worse waveforms than we later achieved. If we assume that these moves had efficiency less than 100%, we can match the number of expected steps. It turns out it would work if the early step efficiency was between 70% and 83% (corresponding to an average of between 2.8 and 3.3 steps actually moved per 4-issued-step move). As will be seen below, this is not a lot different than what the step efficiency apparently was when we were moving forward, early in the run.
So it is a likely and consistent possibility that we had 100% step efficiency during the final part of the run, for most of the time that we were moving in the negative direction. We'll use this assumption to calculate positions for this part of the run.
Benchmark: endstops
Since we know with good precision when we hit the far endstop, this is one of the best benchmarks. If we know the y-position when the carriage is in contact with the far endstop when warm, we can calculate the y-position when cold:
Note: the above equation gives the absolute value of the y-position.
The result is y = -41.39 ± 0.03 mm, 0.08 mm less than the room-temperature value.
This is the final position of the source at the end of the run. We can get another estimate of this value by measuring the y-position of the source when warm. Then the cold value is:
This second estimate yields y = -41.42 ± 0.03 mm, consistent with the first estimate.
From this benchmark we can work backwards to get the positions at various times during the run, back to when we started moving in the -y direction.
With the same formula we can calculate the position of the source when it hits the near endstop when cold, resulting in y = +13.14 ± 0.0.03 mm, 0.02 mm less than the room-temperature value.
Cold blocker positions
We should also correct the blocker positions for thermal contraction. Here I also consider the thermal contraction of indium, which is larger than that of the other metals: around 0.0084, or 0.0073 relative to germanium.
| Table 4 | |
|---|---|
| mm | |
| Blocker 1 near edge | -4.59 |
| Blocker 1 far edge | -7.17 |
| Blocker 2 near edge | -25.00 |
| Blocker 2 far edge | -28.05 |
| uncertainty | 0.02 |
Source positions during last part of run
Using the estimated final position of the source and counting the number of steps in the last several move sequences we can get the source positions for the last part of the run.
| Table 5 | ||||
|---|---|---|---|---|
| Label | Start | End | y_source (mm) | Start Series# |
| L | 11/22/2019 6:48 | 11/22/2019 11:45 | -2.49 | 71911220648 |
| M | 11/22/2019 15:22 | 11/22/2019 20:43 | -6.05 | 71911221522 |
| N | 11/22/2019 21:15 | 11/23/2019 11:54 | -6.57 | 71911222115 |
| O | 11/23/2019 12:26 | 11/23/2019 15:55 | -7.1 | 71911231226 |
| P | 11/23/2019 16:27 | 11/23/2019 20:13 | -7.63 | 71911231627 |
| Q | 11/24/2019 13:13 | 11/24/2019 16:41 | -24.44 | 71911241313 |
| R | 11/25/2019 7:01 | 11/25/2019 10:28 | -38.62 | 71911250701 |
| S | 11/25/2019 13:13 | 11/25/2019 15:50 | -41.39 ± 0.06 | 71911251313 |
The error on the last y-value is based on the benchmark measurement. This error will shift the other values, but the error in the differences between them is very small, based on the assumption of 100% step efficiency.
The final column gives the start time for the position in SeriesNumber format, so it could be used to produce cuts to select specific positions.
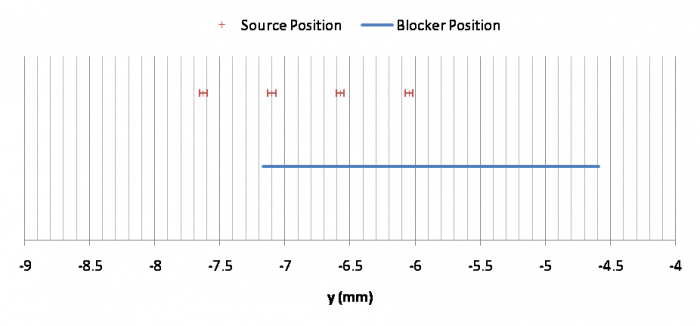
The plot below shows the positions near the blocker (M, N, O, P) with errors, compared to the position of the near blocker. This corresponds roughly to the observed pattern: M eliminated the 60keV peak, N had a small peak, O had a peak about 1/2 as high as normal, P had a normal peak.
Source positions during first part of run
It's more difficult to figure out the positions during the first part of the run when we were moving in the +y direction, because we did not operate the mover in a consistent way. Things varied over the course of the run were 1) voltage of power supply 2) dwell time between pulses 3) wakeup time before pulses start 4) number of steps issued in a single move.
Early on we were issuing single moves with many steps. Nick determined that the current to the coils dropped severely after a few steps. Later we started doing single few-step moves or sequences of few-step moves. The few-step moves were either 6 or 4 steps. On Nov 14 the wakeup time was reduced and the dwell was increased. The power was kept at 8V throughout this period - it was reduced to 6.4V when we started moving in the -y direction.
Whatever actually happened there are two clear benchmarks: we started at the y=0 (warm) position, and at some point we hit the near endstop. We can consider these positions as known, then theorize about how the source was moving so that it is consistent with these two points.
I consider two possibilities:
- Every move produces the same number of actual steps. So a 4-step move produces maybe close to 4 steps, but a longer move also only produces close to 4 steps. If we assume this, it turns out to imply 3.4 steps for every move. This would mean that even moves as short as 4 steps are less than 100% efficient, unlike later when we were moving in the -y direction. But it's possible that we only achieved that efficiency with the lower power voltage setting we used at the end.
- The number of steps per move improved when we increased the dwell from 15 to 40 ms. The extreme version would be that step efficiency was 0 when the dwell was less than 40 ms. This seems unlikely since waveforms were not dramatically worse with a shorter dwell. But if we assume that, then the average number of steps per move for higher dwells is somewhat higher, about 3.6.
#1 is probably closer to the truth. But I’ll consider both possibilities to give an idea of systematic error to quantify our ignorance. We can take the #1 assumption as the default value then assign a systematic error to include #2.
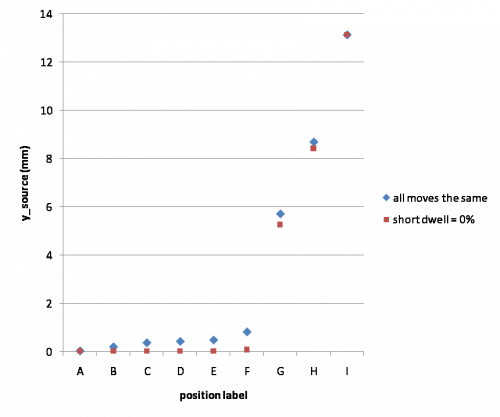
In the plot above we can see that there are large-ish differences in Positions G and H depending on which scenario we use. H varies by as much as 0.4 mm. Possibly we can make empirical plots of position reconstructions for Positions F, G, and H to see if one scenario looks more plausible than another. For now we'll just estimate systematic errors.
| Table 6 | |||||||
|---|---|---|---|---|---|---|---|
| Systematics | |||||||
| Label | Start | End | y_source (mm) | stat | + | - | Start Series# |
| A | 11/6/2019 0:00 | 11/8/2019 14:28 | 0.03 | 0.02 | 0 | 0 | 71911060000 |
| B | 11/8/2019 15:09 | 11/8/2019 19:16 | 0.2 | 0 | 0.17 | 71911081509 | |
| C | 11/8/2019 19:32 | 11/12/2019 15:49 | 0.37 | 0 | 0.34 | 71911081932 | |
| D | 11/12/2019 15:50 | 11/13/2019 15:46 | 0.42 | 0 | 0.39 | 71911121550 | |
| E | 11/13/2019 15:47 | 11/14/2019 9:36 | 0.48 | 0 | 0.45 | 71911131547 | |
| F | 11/14/2019 17:23 | 11/18/2019 12:23 | 0.82 | 0 | 0.73 | 71911141723 | |
| G | 11/19/2019 6:42 | 11/19/2019 10:48 | 5.71 | 0 | 0.44 | 71911190642 | |
| H | 11/19/2019 16:04 | 11/19/2019 21:32 | 8.69 | 0 | 0.26 | 71911191604 | |
| end | 11/20/2019 3:02 | 11/20/2019 3:03 | 13.14 | 0.06 | 0 | 0 | |
This table shows the current mean values and the (asymmetric) systematic errors. Also for the two benchmarks - the first and last positions - I've included statistical errors based on how they were measured (from clean room measurements).
Note that the final position is not “I”. In this table the final position represents when the endstop was first hit. The move sequence continued after that for another 14*4=56 steps, nominally about 0.9 mm - but in the process we jammed the source mover, so it may not have moved that far. So positions I, J, and K are even less well known. From temperature patterns Nick guessed that the first 3 of those 14 moves were “normal”, and so we may have been pushing the endstop for about 12 steps (0.2 mm), after which it jammed. And it's a reasonable guess that J and K are the same as I, because although we attempted to move it was clearly jammed during those moves (though it's possible it shifted a little - we can't really know). So here's the best guess of the I, J and K positions:
| Table 7 | ||||
|---|---|---|---|---|
| Label | Start | End | y_source (mm) | Start Series# |
| I | 11/20/2019 3:58 | 11/20/2019 11:43 | 13.93 | 71911200358 |
| J | 11/20/2019 15:40 | 11/20/2019 17:20 | 13.93 | 71911201540 |
| K | 11/21/2019 1:20 | 11/20/2019 11:57 | 13.93 | 71911210120 |
We could assign systematic uncertainties here as well: basically all of these could be thought to have a range from 13.14 (just touching the endstop) to 14.06 (if all the positive steps issued actually happened).
At the post-mortem we looked at what happens when you keep turning after hitting the near endstop. You could certainly turn it further than the total 56 steps during the run, without any additional pieces coming into contact or anything getting distorted. But the resistance increased, probably because of increased force between the carriage and the threads on the rod. So probably during the run the carriage simply stopped moving when the torque exceeded the motor's maximum torque.