Table of Contents
Run 63 Summary
Detector
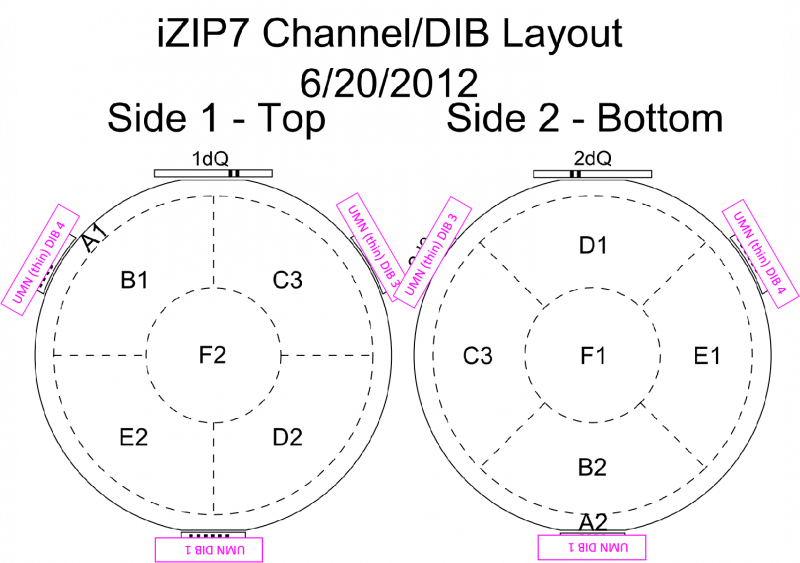
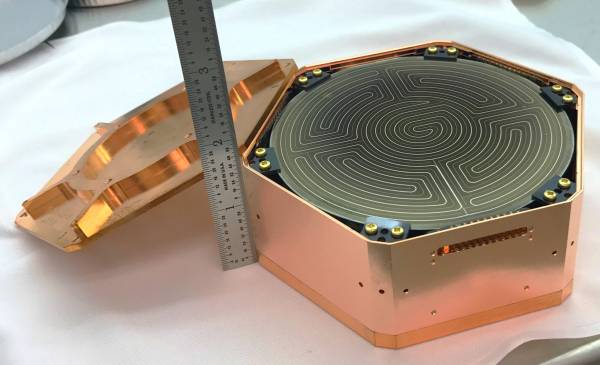
| G132 aka ZP#2 aka Ge iZIP Pathfinder | |
|---|---|
 |  |
Setup
Notes on detector wiring scheme
| pA | pB | pC | pD | qI | qO | LEDs | |
|---|---|---|---|---|---|---|---|
| DIB1 | Side1 pD | Side1 pF | Side1 pE | Side2 pA | Side2 qI | Side2 qO | Pin9/10 = Side1/2 |
| DIB3 | Side2 pA | Side2 pC | Side1 pA | Side1 pC | Side1 qI | Side1 qO | n/c |
| DIB4 | Side2 pE | Side2 pF | Side2 pD | Side1 pB | n/c | n/c | n/c |
| Matt C's Wiring. Note that due to an error, Side2 pB is not connected. Two DIB channels are connected to Side2 pA. | |||||||
| Internal source positions |
|---|
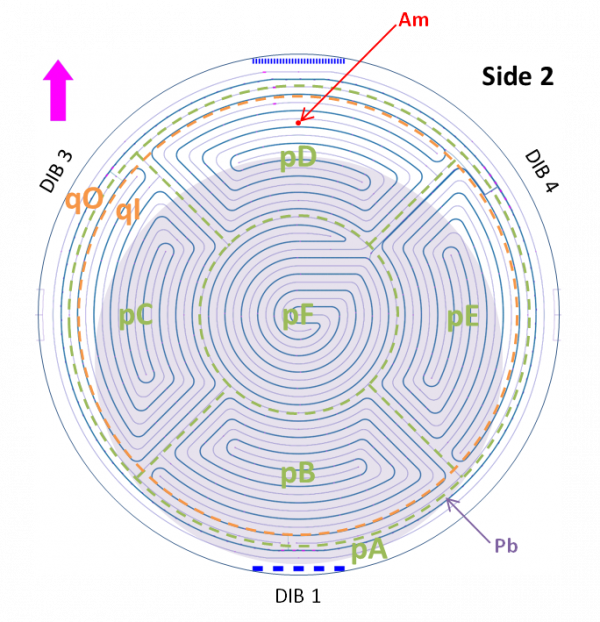 |
| Collimated Am-241 source and Pb-210 plate source facing Side 2 |
LEDs and thermometry:
- Two LEDs built into DIB1, one on each side
- Four external LEDs in adjacent housing, facing Side 2. Source holder plate is between detector and LEDs; a hole was drilled in the source plate to allow more light through.
- One external LED is 1650 nm, from Queen's (DIB3 LED1). It's been proposed to install one of these in each SNOLAB detector for calibration/stability measurements. (The other LEDs are the standard 940 nm.)
- The tower thermometer is on the LED plate.
Critical Temperatures
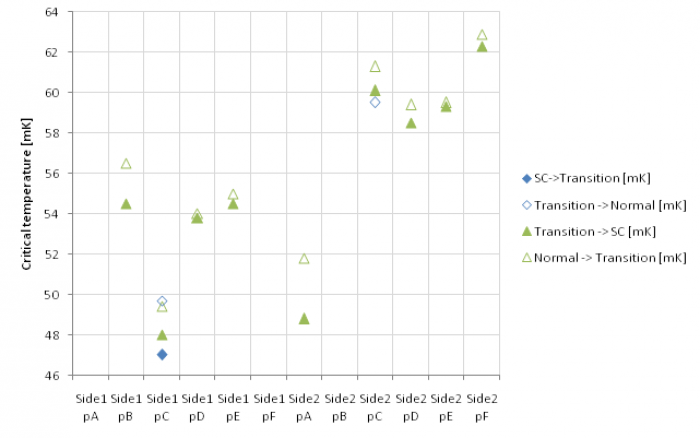
| G132 Critical Temperatures |
|---|
 |
Charge breakdown and parasitic power
The first attempts to apply bias showed shifting phonon baselines. The baselines shifted at surprisingly low biases.
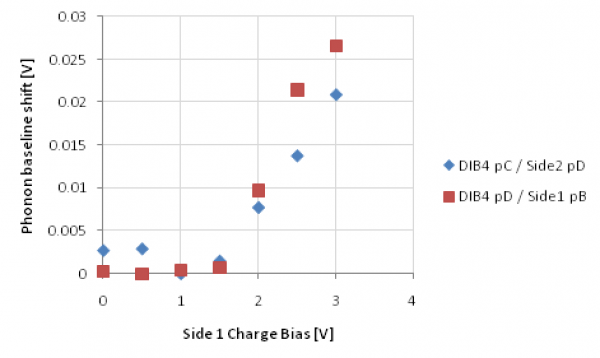 | 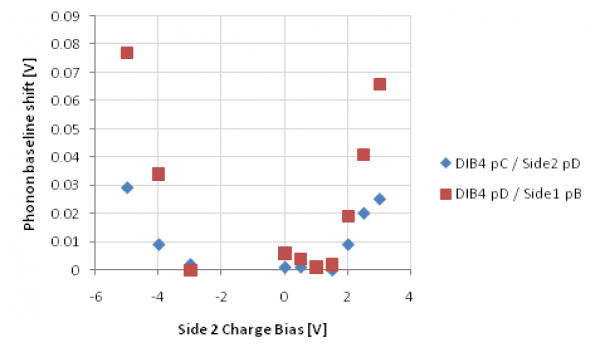 |
| DCRC1 (Rev C.1) with x1 Driver Gains. One side biased, other side grounded. For Side 2 bias tried negative biases as well - similar behavior but doesn't kick in until about -4 V, as opposed to +2 V. |
|
The plots above are from 1-sided biasing. 2-sided symmetric biasing doesn't seem to make it worse, i.e. +2/-2 V is no worse than +2/0 V.
Bias scan data taken on July 18-19 was taken from 0/0 V to +10/-10 V with flashing and cooldown periods between series. Tests before starting this sequence showed no breakdown in the charge traces. However breakdown was seen in the recorded data. Breakdown generally kicked in some time after applying the bias and starting to take data. Breakdown was first seen at +4/-4 V about 20 minutes after applying bias; at higher biases it appears sooner.
Charge collection efficiency “seagull” plots were generated for this scan. The first plot below is based on a high-energy feature seen in the spectrum, with a charge-symmetry cut applied. But this turned out not to be the 60keV peak - that is seen in the second plot below.
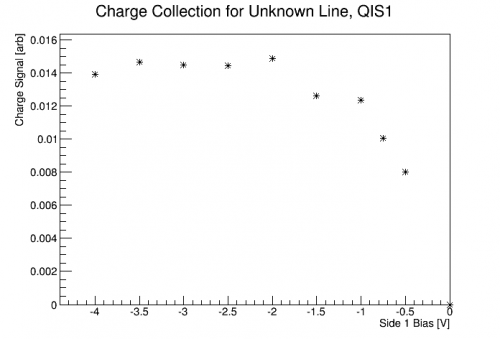 | 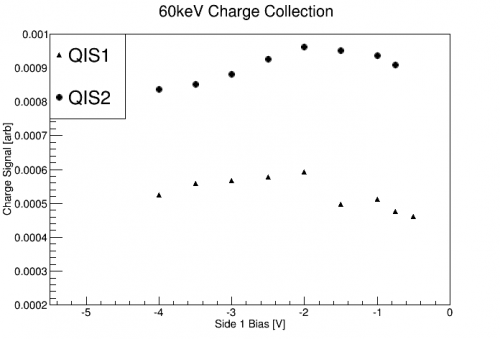 |
One difficulty with this data is that the trigger was based on a charge threshold. This is not as sensitive as a phonon threshold, so the energy threshold is high, and the 60keV line (if present) seems to fall below threshold at the lowest biases. We should try again with a phonon trigger, but it's a little difficult because the phonon pulses may become weak or disappear at the higher voltages.
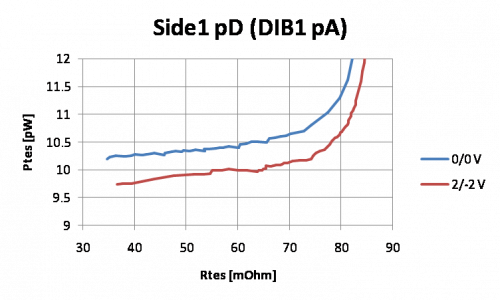
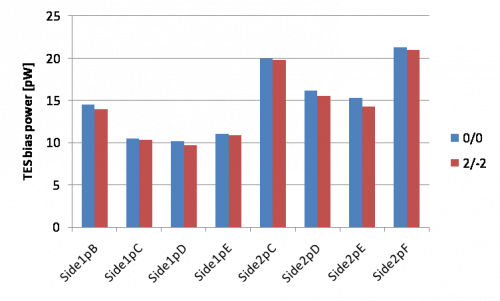
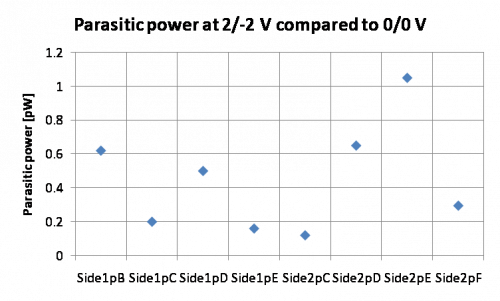
The seagull plot seems to be better than that for G106a, with the plateau occurring at lower voltages. We have chosen +2/-2 V as a working setting. IbIs were taken again for all phonon channels at this new bias. Compared to 0/0 V IbIs it looks like a uniform increase in parasitic power, example below:
 |  |  |
The parasitic power in each channel was also estimated as a function of bias from the baseline shifts in the bias-scan data, results below:
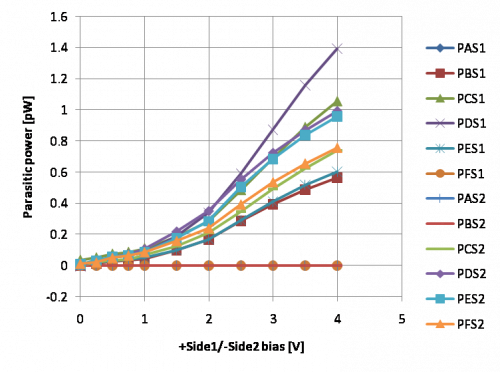 | 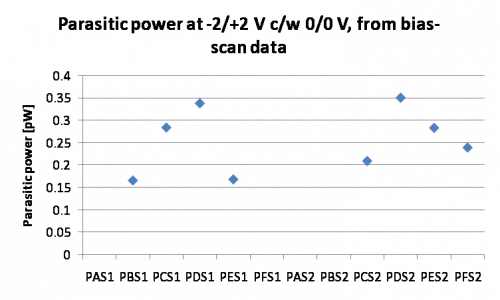 |
The parasitic power calculation includes both linear and nonlinear terms. The decrease in slope at the highest voltages shown may be due saturation as the TES is driven close to its normal resistance (I need to verify whether this is plausible…).
If we assume this power is from athermal phonons in the crystal we can estimate the total added phonon power, given an assumed phonon collection efficiency of 12%. If we assume there is some dark current whose charges are drifted through the full bias, then this current is just the power divided by the bias. This is shown below:
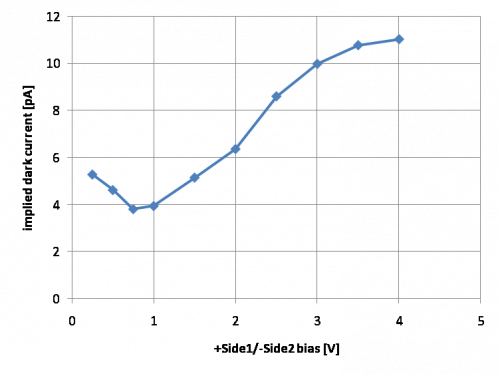
It sort of looks flat up to around 1.5 V (a constant current) then follows Ohm's law at higher biases (charge leakage). Above 3 V it slopes off, again possibly due to saturation. In the ohmic regime the implied resistance is about 600 GΩ. (As it turns out this is on the same order of magnitude as HV#2 aka G101c, which seemed to have a 1.0/1.7 TΩ resistance depending on polarity.)
Baseline shift with temperature variations
The data above were complicated by the fact that the phonon baselines also varied with time during a data series, as the tower continued to cool after a flash. The plot below at 0/0 V is an example:
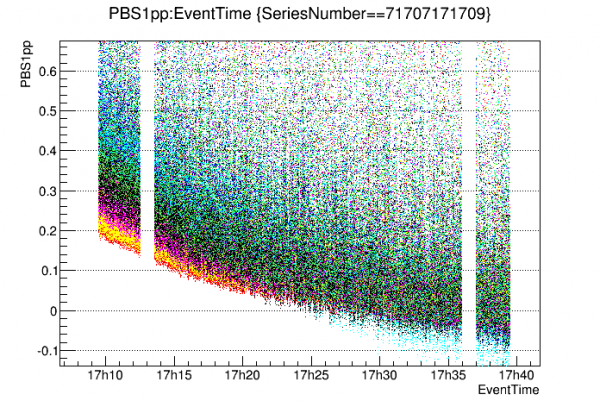 |
| Parasitic power [pW] versus time, as calculated from phonon baseline shifts. Different colors represent different channels Ppar tracks tower temperature which fell from 27 mK to 26 mK during series. |
This sensitivity to temperature is rather surprising. It shows a change in TES bias power of around 4%. Detector Tc is around 55 mK, while the tower temperature falls from 27 to 26 mK. The usual assumption is that the TES bias power is proportional to Tc^5-Tbath^5. But if so then, given these temperatures, the change in bias power should only be about 0.5%. The change in power seen is roughly proportional to Tc^1-Tbath^1.
One possible explanation is that as the crystal is cooling, the tower thermometer is not a good measure of the crystal temperature. Heat is flowing from the crystal through the clamps to the tower, so there will be a temperature gradient. If we assume 26 mK is the base, then a detector temperature of 31 mK at the beginning of the series would explain the parasitic power observed. (The relationship to base temperature could be measured with a dedicated run using the mixing chamber heater.)
This may mean we need to wait longer than 25-30 minutes after flashing. Alternatively we could run at a higher temperature so that it takes less time to cool to base.
Neutralization
On July 30-31, after a 2 hour bake, a set of 12 hours of -2/+2V data were collected without flashing in order to study the neutralization hold time. The data was triggered on Side2pF in order to reach a low charge threshold.
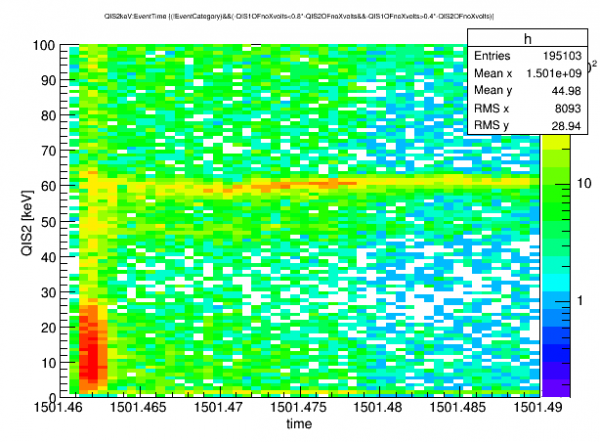
The above plot shows the 60 keV line as mesured by QIS2, the side nearest the Am source. There is a randoms and a charge symmetry cut applied. This channel's signal was dominantly due to hole transport. In these 12 hours of data, there is no significant degradation of the 60keV signal, indicating a great neutralization hold time. The overall event rate did change significantly during this time period. This decrease in rate was correlated with a lowering phonon baseline, indicating that the detector temperature was falling. Why this should lower the overall rate is not yet understood.
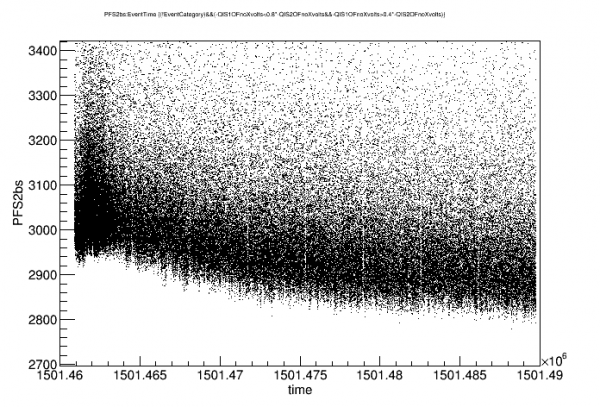
On Aug 3-4 another long flashless date sequence was taking. Results are remarkably similar:
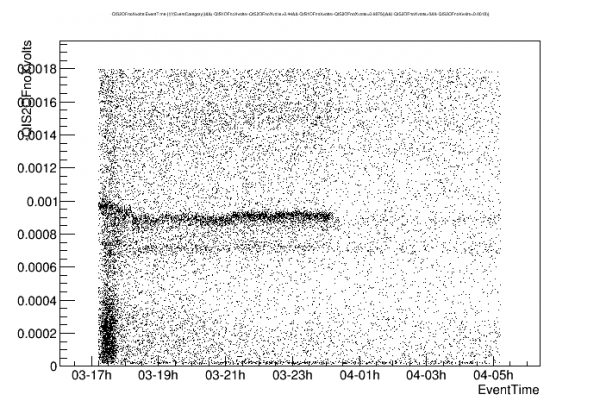 |
| Side 2 charge energy versus time, with charge-symmetry selection, showing 60 keV peak |
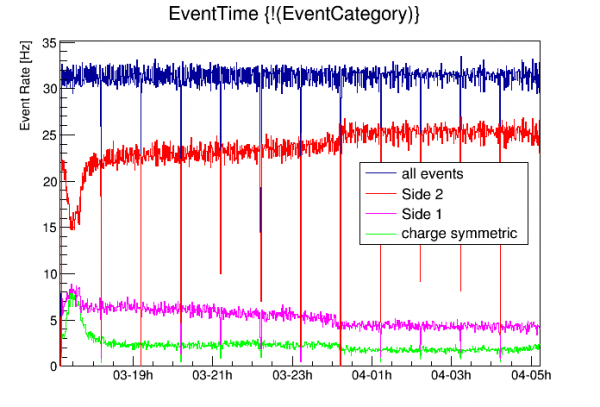
These plots suggest an overall decline in event rate but this is not the case. As shown below, the event rate is constant but fewer events are charge symmetric - the rate of events appearing as Side 2 asymmetric events (source side) increases with time.
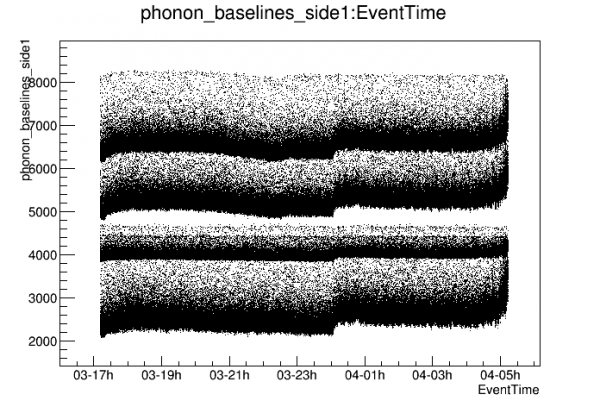
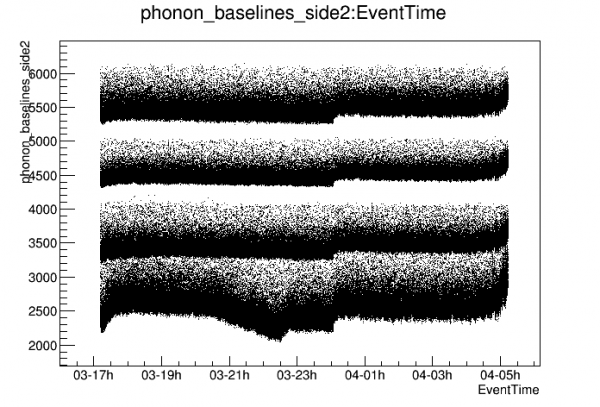
The plots below show phonon baselines versus time for this sequence. There's an indication of a small increase in parasitic power at around midnight, close to when the symmetric 60keV peak disappears.
 |  |
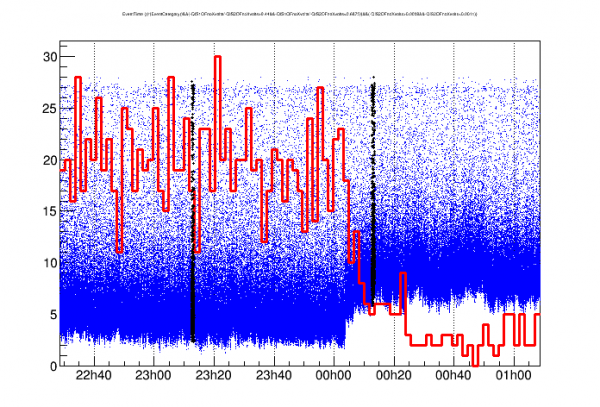 |
| Phonon baseline shift with overlay of rate of charge-symmetric 60 keV events Black dots are randoms, indicating the beginning of a new series. |
Comparing the July 30-31 sequence with the Aug 3-4 sequence there is similar behavior: at some point the charge-symmetric 60keV line disappears. On July 30-31 this occurred 8 hours 50 minutes after data began, around 4:15 am. On Aug 3-4 it occurred sooner, 7 hours 0 minutes after data began around 12:00 am.
| July 30-31 | 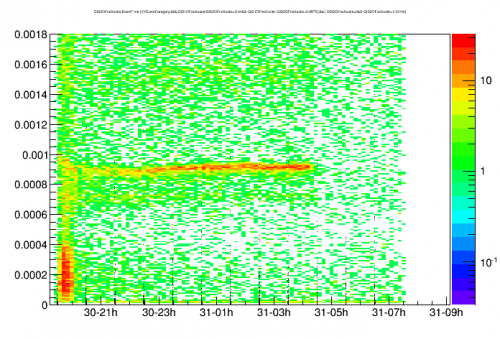 | 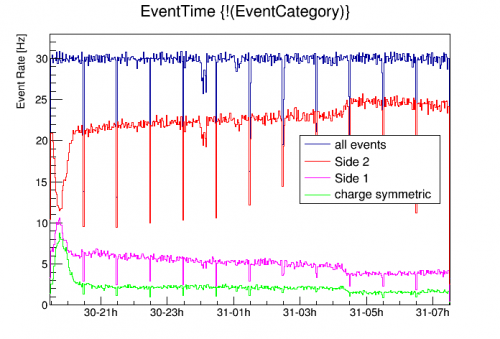 |
|---|---|---|
| Aug 3-4 | 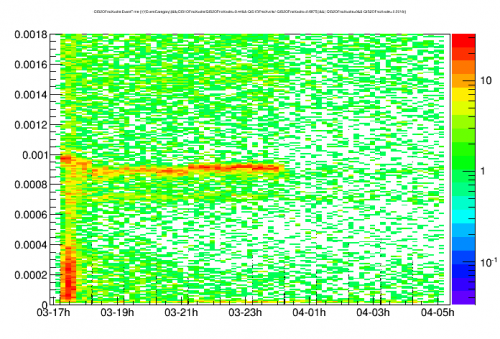 | |
On both July 30-31 and Aug 3-4 the phonon baselines show an uptick at the same time that the charge-symmetric 60keV line disappears.
Phonon channel response to base temperature
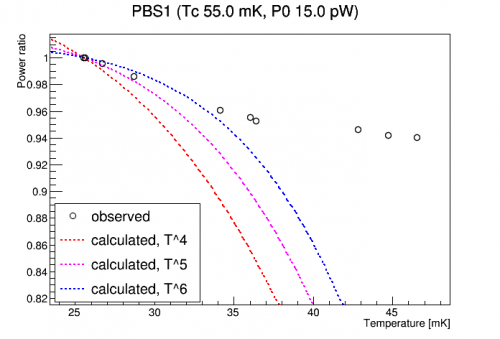
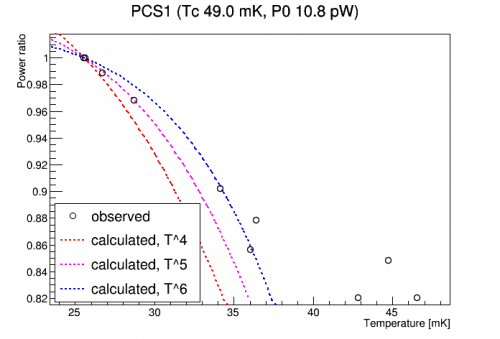
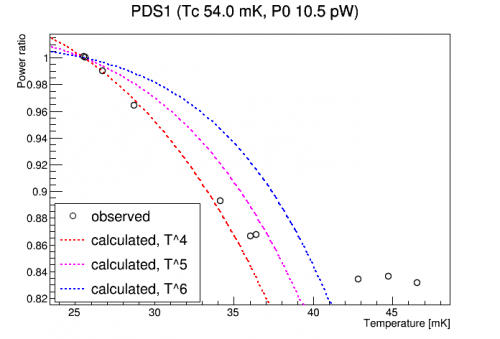
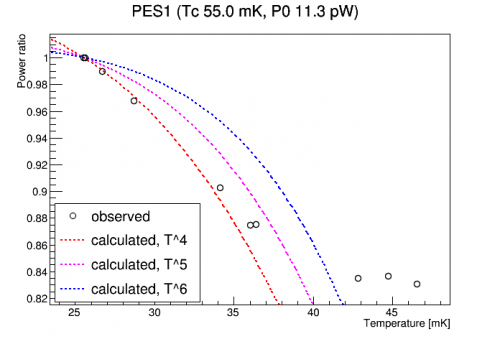
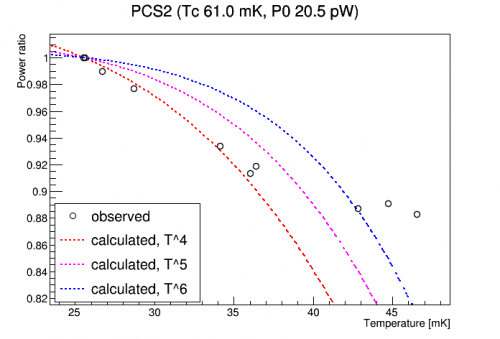
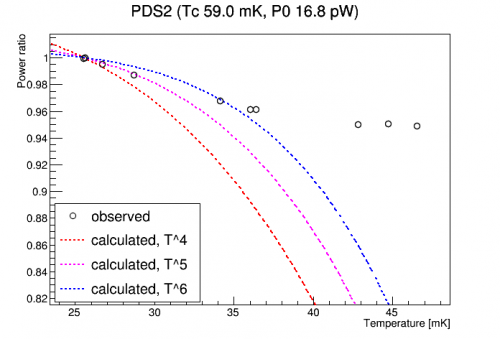
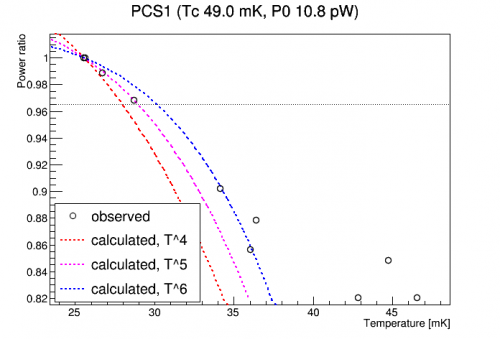
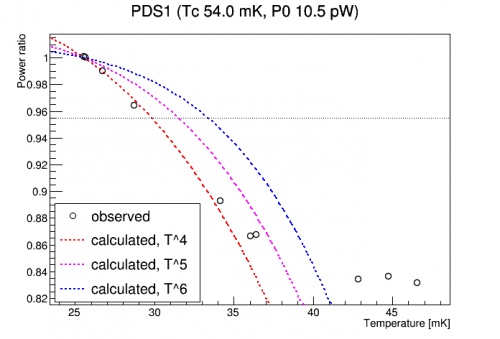
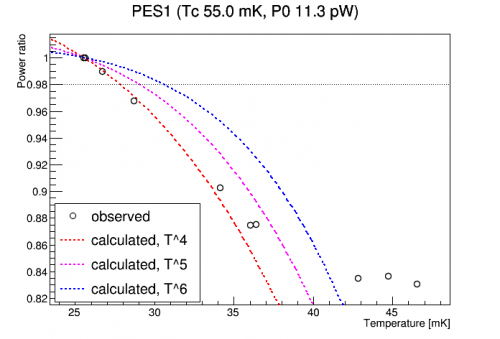
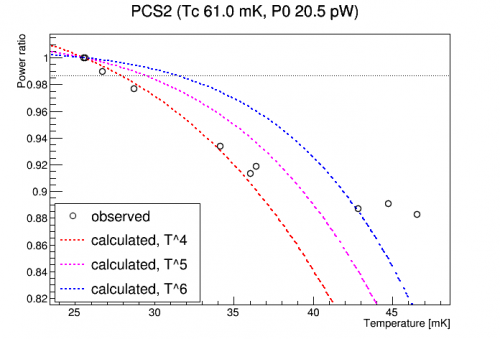
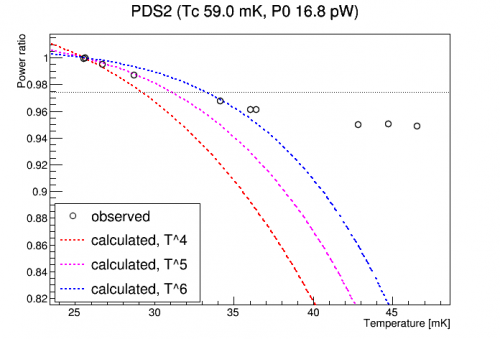
The power required to hold a TES at its critical temperature is expected to go as (Tc^N-Tbase^N), where N=5. On July 27-28 we took some temperature-scan data. We applied power to the MC heater, waited for the temperature to stabilize, then took a few minutes of randoms. From the phonon baseline shifts I calculated the parasitic power at each temperature. Knowing the TES power at base temperature (from IbIs) and knowing the Tc values I made the plots below, with empirical data compared to the predicted temperature behavior.
| Observed and predicted TES power ratio versus base temperature | |
 |  |
 |  |
 |  |
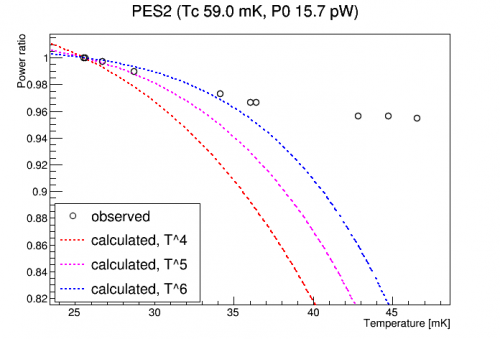 | 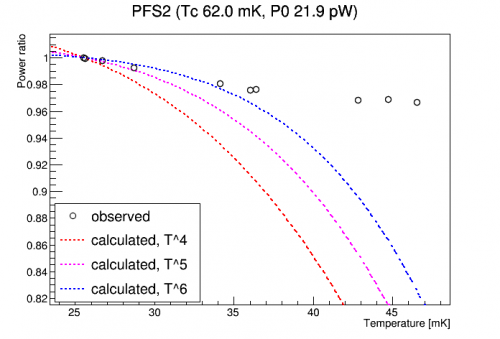 |
| TES bias power relative to power at base temperature. Curves show the calculated relationship based on Tc and base temperature. At the lower temperatures some of the TESs follow the N=5 rule closely, others are closer to N=4. At higher temperatures all TESs deviate from the predicted curve - this is probably because they are saturating, approaching Rnormal. |
|
There is a trend across TESs that we could investigate more closely: higher Tc values correspond to higher bias powers. This of course makes sense for the same reason that the power shifts with temperature. The plots below show how closely the trend across TESs follows the temperature rule:
| TES bias power versus temperature difference | |
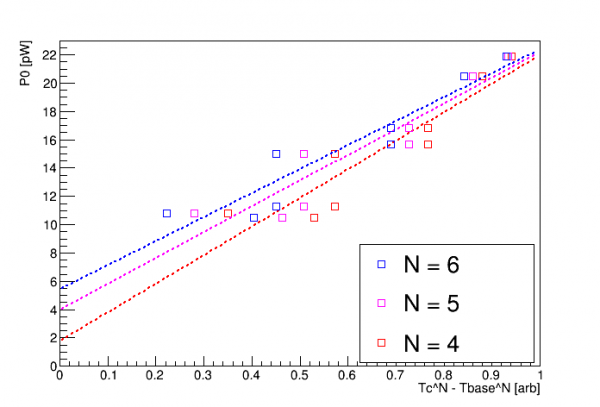 | 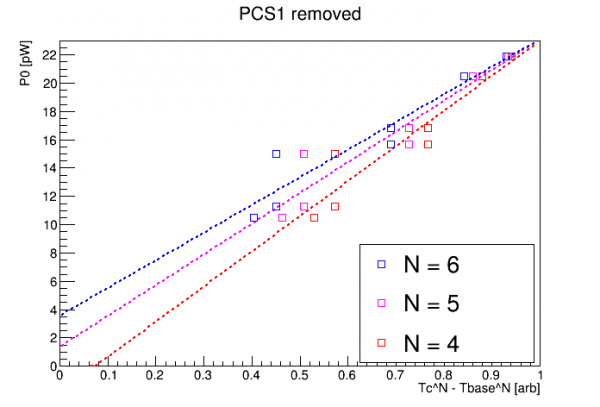 |
| Across TESs the relationship between bias power and Tc follows the general rule. This implies that the thermal conductivities of the different TESs are roughly the same. Fitting to all points does not quite match the N=5 rule, but removing one outlier shows a close match. |
|
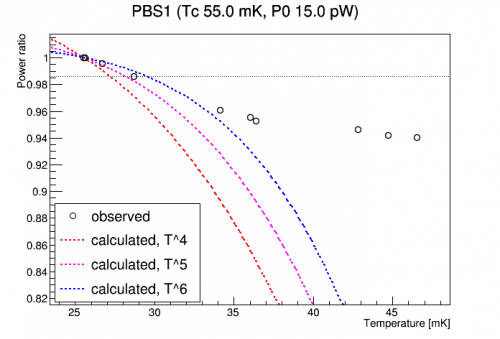
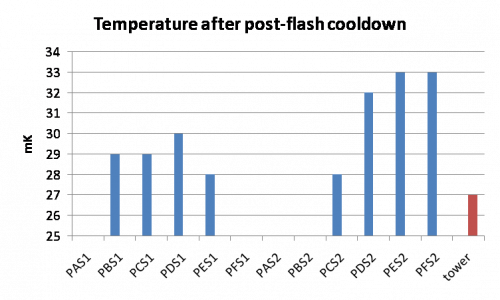
We can compare the parasitic powers seen after a post-flash cooldown to the power-versus-temperature curves above, to calculate the effective temperature after the cooldown:
| Observed and predicted TES power ratio versus base temperature, compared with power after cooldown | |
 |  |
 |  |
 |  |
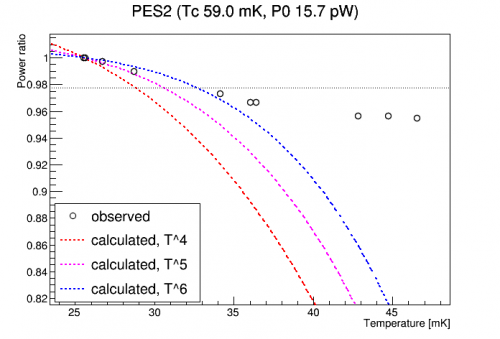 | 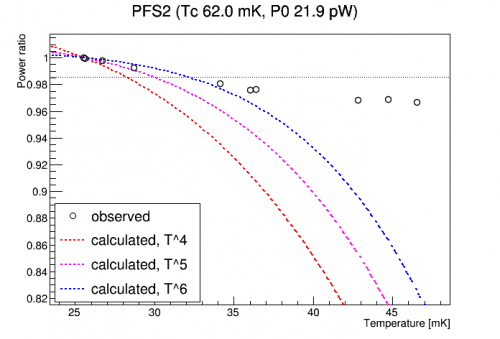 |
| Horizontal lines indicate TES power just after a post-flash cooldown. Where the lines intersect the curves gives an indication of the temperature after cooldown. | |
The temperature according to the Tower thermometer after cooldown was around 27 mK, as compared to a 26 mK base. But the plots above suggest that the detector was warmer, between 28 and 33 mK depending on which phonon channel you use.
Charge Collection Efficiency
Side2/1 -/+ bias-scan data was taken on July 26-7 and +/- on July 28-9. 30-minute series were taken at each bias with flash+30minute cooldown between.
As with G106a, there seems to be a difference in charge pulse shape when the polarity is switched, because the maximum 60 keV amplitude is not the same on either side when the polarity is switched. To make the plot below I
- removed randoms
- determined a charge-symmetry selection that works in the 60keV range
- fit 60keV peaks (note that there was frequently a second peak at somewhat lower energy that I ignored)
- normalize the four peak-versus-bias curves – two sides, two polarities – to their maximum value
- use the error in the fit parameter as an error in the plot
Biases were scanned up to 5 volts in each polarity but breakdown occurred at the higher biases. If a peak was not visible the point was left out of the plot - this occurred both at low and high biases (in the latter case due to breakdown).
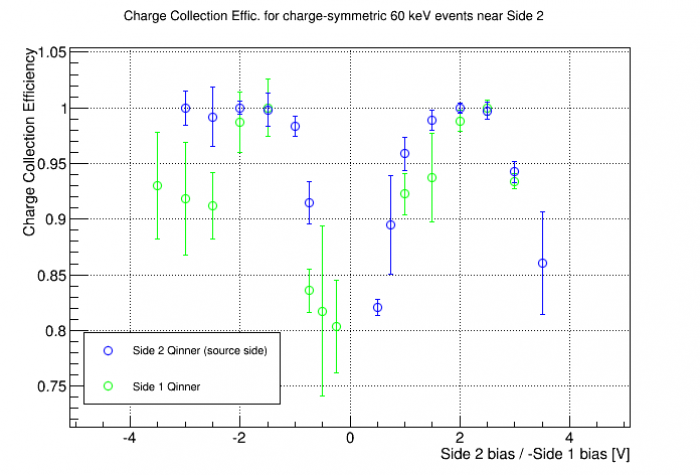
Observations:
- Before breakdown kicks in completely, effic. drops off at higher biases, at least in the -/+ case (right side of plot).
- As expected from Ramo arguments, Side 1 effic. is somewhat worse than Side 2 (because more of the signal comes from the final part of the drift on the side opposite the source)
- Positive bias on the source side leads to somewhat lower charge collection efficiency, so hole trapping distance is apparently shorter than electron trapping distance. The opposite was true for G106a
Phonon Collection Efficiency
Analysis note, with a modification to the below (peak selection based on balanced pSum).
As with G106a, the iZIP prototype, we can measure the phonon collection efficiency of this iZIP using the 60 keV peak from the Am source. The 60 keV events fall into two categories - near-surface charge-asymmetric, and charge-symmetric. All the 60 keV events in Ge detectors are relatively near the surface but some penetrate far enough to escape the curved surface field so that charge carriers are drifted through the detector bulk. So we use a charge symmetry cut to select the bulk events so that we then know they have the full Luke gain, rather than the 50% Luke gain from one-sided charge collection.
Data from July 25-6 is used. This is a sequence of -2/+2 V data, 1-hour series with 30-minute wait after the flash. As stated above a 30 minute wait after the flash is probably not long enough for the phonon channels to cool to their base behavior. We can see that here:
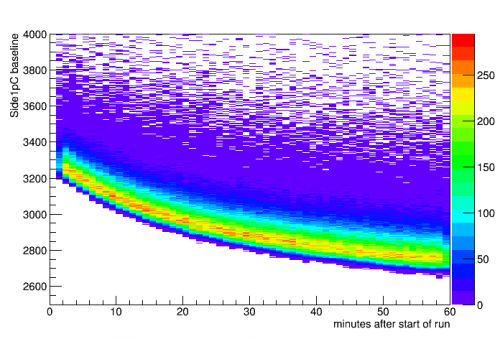
A cut was applied to remove the first 20 minutes of each series, where the TESs are closer to their base behavior.
Comparing pTotal OF to charge, the 60keV peak identified in charge spectra seems to be at about 0.8-1 e-6 in pTotal OF. Plotting pTotal OF shows a weak peak or shoulder. Since the source is situated above Side 2 pD I looked at the partition in this channel to see whether it could be used to discriminate the Am events.
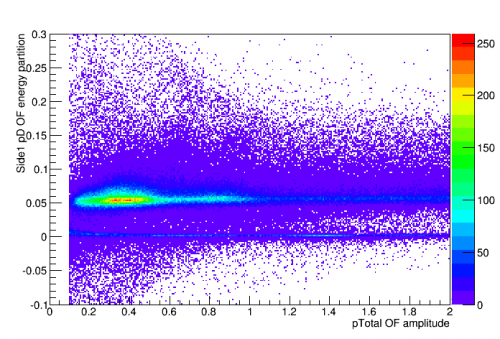
There is a population of events at Side2pD Partition = 0, indicating events with significant total energy but almost zero in Side2pD. These are the trace-scrambling glitches first seen in Run 62 coincident data. These seem to be more prevalent when running 3 DCRCs simultaneously. I applied a cut to remove most of these glitches.
With these cuts along with an attempt at a pileup cut we can plot the pTotal amplitude versus time after the start of the series:
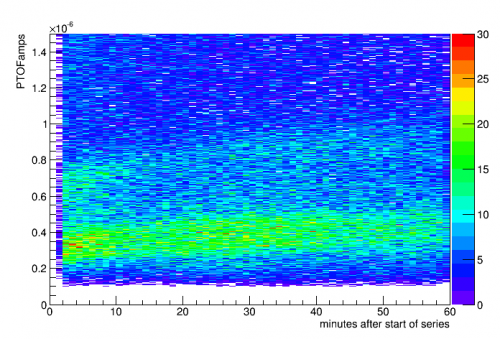
The upper band is identified as the 60 keV line (with no charge-symmetry cut applied). As expected it rises over time as the TES continues to cool from an elevated point in its transition to its base setting.
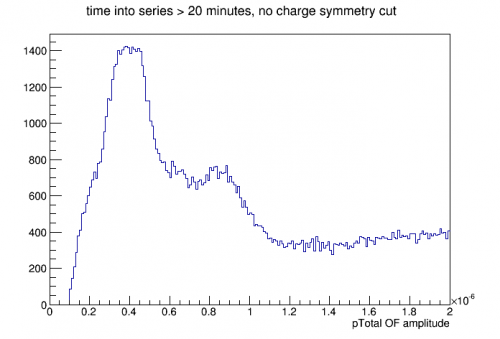
Here, with no charge-symmetry cut applied yet, the 60 keV peak is seen at about 0.85e-6. There's a hint of a lower peak around 40 keV, which was also seen in charge spectra and is probably from the 210Pb source.
Defining a charge z-partition gives a basis for a charge symmetry cut:
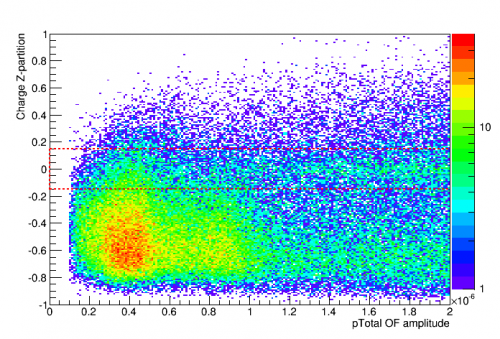
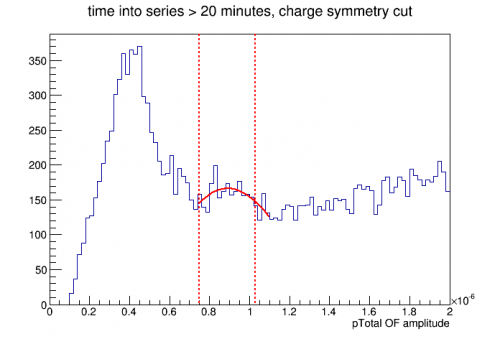
The charge-symmetric band is seen faintly in the middle. Most events are at low Z, Side 2 events from the Pb and Am sources. From this plot I constructed a charge-symmetry selection cut. Using this cut I plot the pTotal OF spectrum and make a selection cut to choose events near 60 keV (since the peak may not be resolved in the integral quantities used for PCE calculation):
To calculate phonon collection efficiency the dP/dI absolute calibration factors were calculated from IbIs data using techniques developed in the Run 62 analysis. Note that the IbIs were taken at the same -2/+2 bias but with the tower temperature at base, so it should correspond to the data long after the flash.
Summing the integral quantities and comparing the calibrated absorbed energy to the calculated total phonon energy (recoil energy + Luke energy) is the basis for calculating phonon collection efficiency. We had only 8 of 12 phonon channels functioning, so to get total absorbed energy it is necessary to extrapolate.
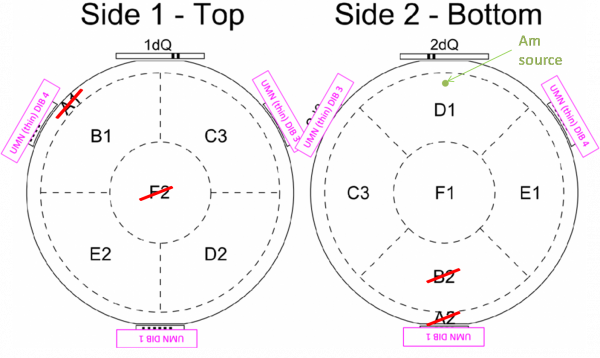
The figure above shows the approximate location of the Am source and which channels were non-functional. Unfortunately we don't have either outer ring channel, so it is somewhat difficult to guess what fraction of the energy is absorbed in those channels.
One issue with calculating absorbed energies from pulses in this detector is that the fall times are long compared to the HV detectors, so some of the pulse integral is lost that falls outside the trace window. Using the RTFT walk quantities I estimated the amount of energy lost outside the window. For 60keV events it turns out to be a small effect, about 2%.
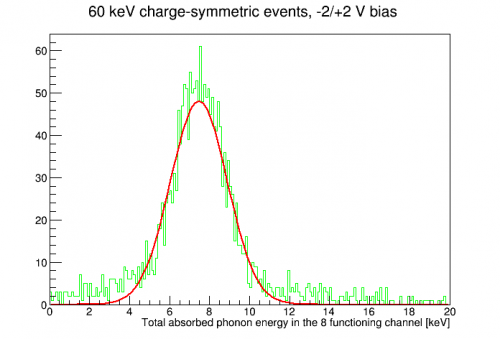
The plot above shows the total absorbed energy for 60keV events based on the absolute dP/dI calibration. With a recoil energy of 59.54 keV and a Luke gain of 2.333, the total phonon energy is 138.9 keV. The 8-channel absorbed energy peaks at 7.48 keV giving an 8-channel PCE of 5.38%. A naive scaling to 12 channels is to simply multiply by 12/8, giving 8.08% 12-channel PCE. This is surprisingly low.
The next thing I checked was the partitioning of energy across the channels for the 60 keV events.
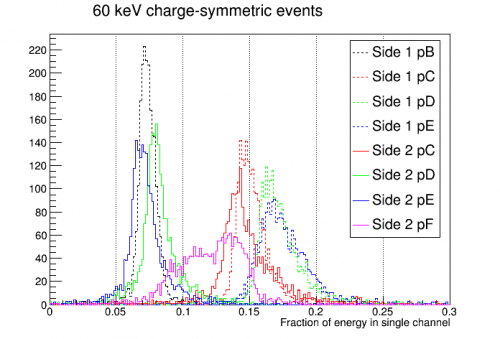
The plot above is not what one would expect. Four channels peak around 14-18%, three channels are low outliers peaking around 7-8%, and one has a relatively wide, possibly two-peaked distribution. Side 2 pD would be expected to have a high partition for Am events since that's where the source is, but it is one of the low outliers. What the outliers (the low ones and the wide one) have in common is that they are all from DCRC4. In fact it looks like if the gains for those detectors were actually 1/2 what was assumed, the channels would show much more uniform behavior. Checking the ODB logs however indicates that the phonon driver gains were set at 4x, our standard for Rev C.1. But in Run 62 coincident data, Nick saw apparent changes at different times of phonon relative calibrations by factors of 2x or 4x, also suggesting changes in gain, but also with no changes in ODB logs.
Looking at noise trends reinforces the notion that the phonon gains were low by a factor of two in the DCRC4 channels for this data. See the 2017 July 26 noise trends. The DCRC4 channels - PBS1, PDS2, PES2, PFS2 - show noise levels about 1/2 as high as the DCRC1 channels - PDS1 and PES1. At 3 kHz the DCRC1 channels show 1.2e-11 to 1.3 e-11 A/rtHz, while the DCRC4 channels show 6e-12 to 7e-12 A/rtHz - almost exactly half as much. The gain settings on the noise plots may not be correct, but they are consistent. The 1.2e-11 range is typical for phonon channels when the gains are at their standard values - this was seen in G106a for example. So it looks like good evidence that the DCRC4 gains were half what they should have been in this data, despite the fact that they are correct in the ODB log. (And a quick look at some noise in Run 62 suggests that the gains in one DCRC were small at a time when their relative calibration factors were large.)
Recalculating the absolute calibrations under the assumption that the DCRC4 phonon driver gains were x2 rather than x4, the channel partitions now look like this:
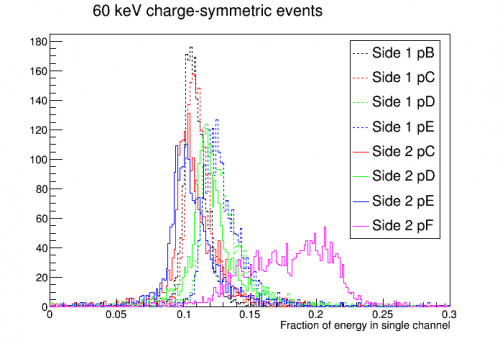
Now they are of course much more uniform. The only significant difference is Side1 pF. If this were the channel closest to the source this would make more sense - the higher partition values would be the Am events. But it's a different channel. I should double check whether the channel mapping is correct.
Now plotting the total absorbed energy for events in the 60keV peak yields
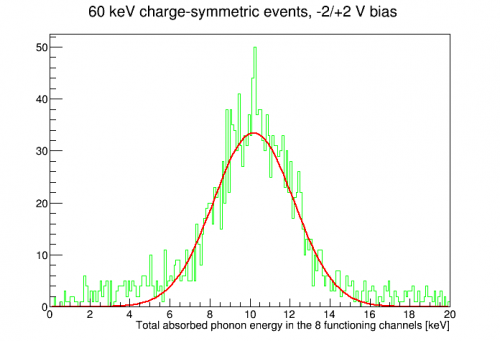
With a mean absorbed energy of 10.205 keV, an 8-channel PCE of 7.35%, and a naively extrapolated 12-channel PCE of 11.02%. This is closer to the expected 13%.
A better motivated extrapolation from 8 channels to 12 channels involves estimating the partition in the unavailable channels based on ratios in available data. To estimate the amount of energy in the outer-ring pA channels, I looked at G106a(iZIPv6) data from Run 55 used to calculate phonon collection efficiency. The pA channels for charge-symmetric events <100 keV collected on average 82% as much energy as one of the inner ring channels on the same side. Note that there is a lot of scatter in the phonon partitions in that run so this is a pretty rough calculation.
Side2 pB was assigned an energy equal to the average of the other Side 2 inner ring channels. Empirically all the inner ring channels seem to have about the same average energy for the 60keV events. Side1 pF (center) was assigned an energy based on the sum of the inner ring Side 1 channels, with the same proportion as seen on Side 2. Side1 pA and Side2 pA were assigned 82% of the average inner-ring energy on the same side.
Below is the corresponding 12-channel extrapolated absorbed energy for 60keV events:
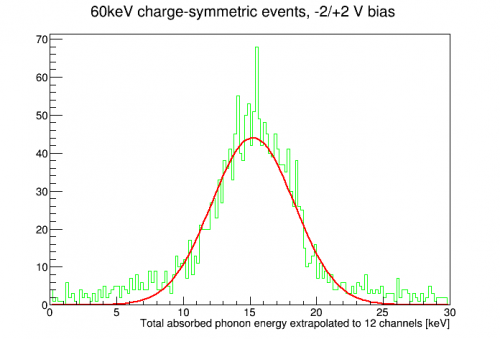
The mean extrapolated absorbed energy is 15.24 keV, giving a 12-channel PCE of 10.97%. Quite close to the naive extrapolation.
Bad Channels
Side2 pA (DIB3pA)
This channel was shorted to chassis. At room temperature it was difficult to tell which Side2 channel was shorted, but upon cooling it was clear that it was Side2 pA.
Leakage-to-chassis data taken during cooling on June 30
| DIB3 resistances during cooldown |
|---|
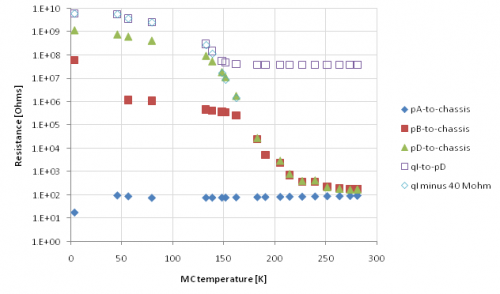 |
- DIB3pA (Side2 pA, outer ring) shows low resistance leak to chassis - the resistance actually goes down as temperature falls, like a direct metal contact.
- DIB3pB (Side2 pC) rises to a level consistent with same-side interchannel resistances
- DIB3pD (Side1 pC) rises higher to a resistance characteristic of opposite-side interchannel resistances
- The qInner Side 1 continuity through the bias resistor increases to values similar to the opposite-side resistances, though it ends up even higher
This channel showed weak pulses. The response was readable enough that we were able to take a Tc measurement. But we took no pulse data with this channel.
Side1 pF (DIB1pB)
On July 3 after cooling to base it was noted that this channel seemed to be stuck in the normal state. On July 5 the measured resistance was 3.08 Ω, much higher than other normal resistances. That was at near 0 bias - at high bias, it seems that on the same day we measured 109 mΩ, which doesn't seem to make much sense.
This channel showed no problems during electrical checkout.
After opening the IVC and removing the SQUETs a tower-level check showed this channel was continuous.
Side1 pA (DIB3pC)
This channel was sporadically open during room temperature checks. It seemed to be open after cooling to base. On July 5 it was reported that there was no change in output with changes in QET bias, implying high resistance / open.
After opening the IVC and removing the SQUETs a tower-level check showed this channel as open.
Side2 pB
This channel was left unconnected due to a mistake described in these notes on detector wiring. It should have been connected to DIB1pD, but that DIB channel was instead connected to Side2 pA.