Table of Contents
Run 60 Summary
The purpose of this run is to test new contract-free hardware designed to go with a new 150 mm, 1.25“ thick Si crystal. More information on the design and initial testing for this run can be found at 150 mm Si Detector Designs.
Link to results paper draft can be found at overleaf.
Setup
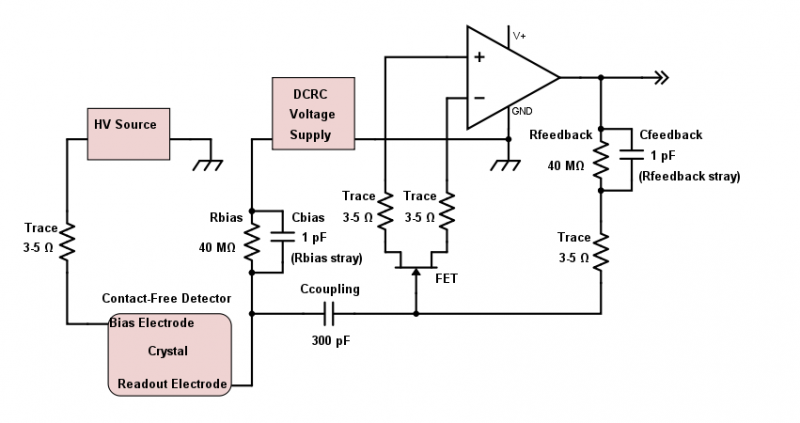
For this run a polished (but no mask), 150mm diameter, 1.25” thick Si crystal is housed between two Al electrodes, with a distance of 0.2-0.4 mm between the crystal and electrode faces. One electrode will have a high voltage applied through the QET D return line. The other electrode will be the readout electrode, with one small Am source on the electrode and charge readout only through Qouter. Both electrodes have two UV and two IR LED's facing the crystal. The IR LEDs are connected to the usual DIB pin location (Pin 9 and 10), and the UV LEDs are connected through Pins 3 and 5 (usually QET B return and C return lines). As this setup indicates, there are no phonon readout lines, and only one Q readout on one side of the crystal.
| Figure 1: Circuit diagram for Run 60 |
|---|
 |
Tower Setup
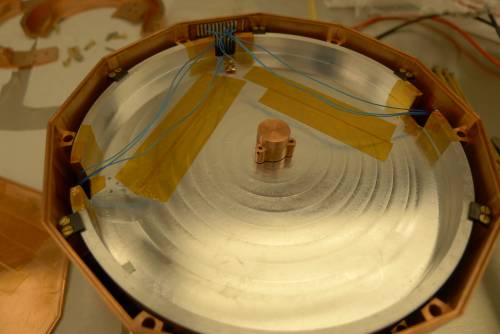
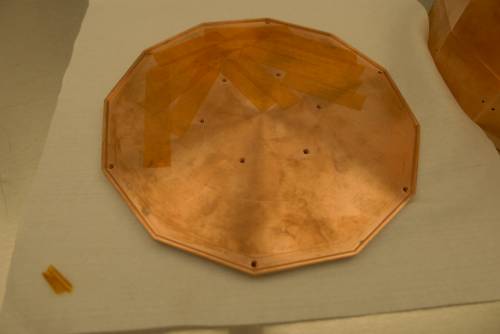
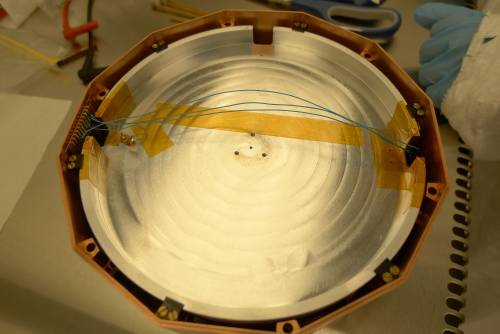
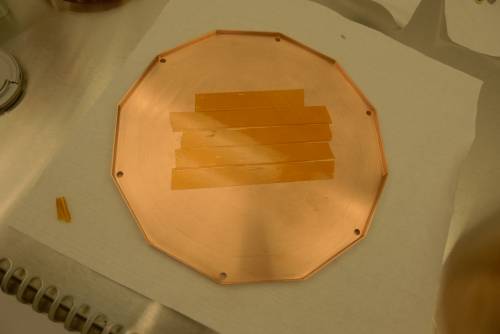
The detector stack is constructed such that the bias electrode is on top and the readout electrode (with Am source) is on the bottom. Kapton tape was applied on the corners of the electrodes and on the electrode housings anywhere that a wire could potentially reach.
| Figure 2: Electrode and housings with Kapton tape applied | |
|---|---|
 |  |
 |  |
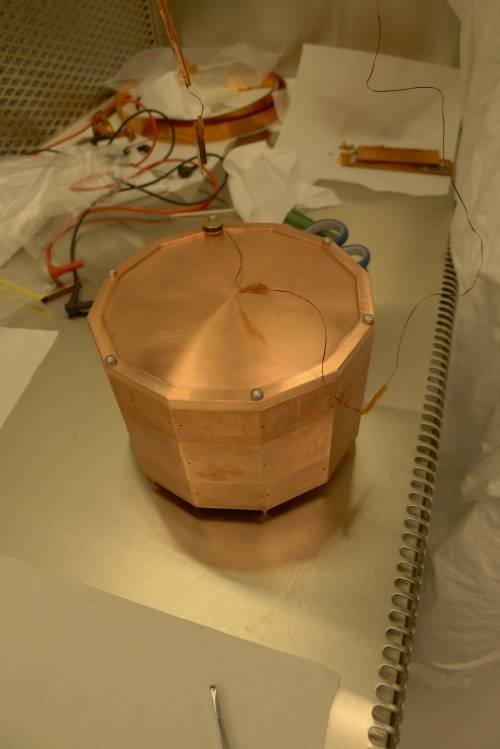
The tower thermometer is attached by fixing it to the top of the bias electrode housing with the threaded rods made to secure the detector stack.The other end of the thermometer passes through a hole at the top of the new 30 mK can to connect to this end of the thermometer. See Figure 3 below.
| Figure 3: Detector stack |
|---|
 |
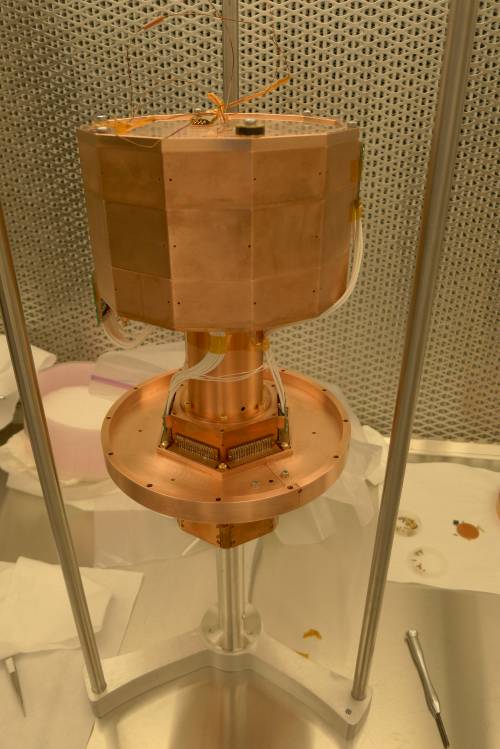
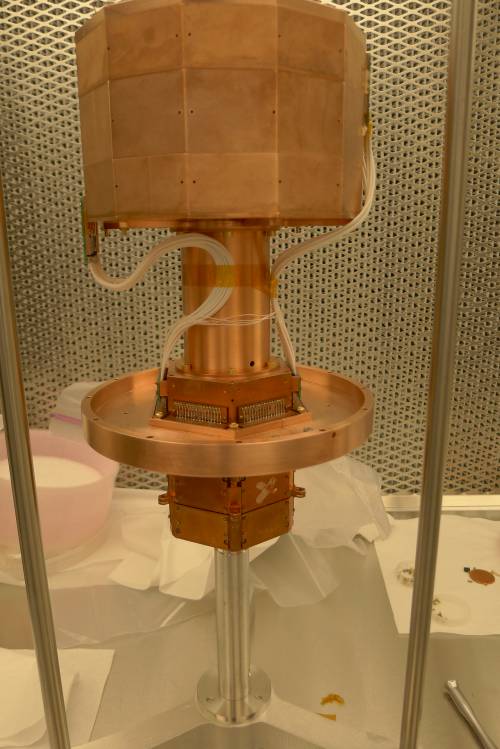
| Figure 4: Detector Stack Mounted on Tower | |
|---|---|
 |  |
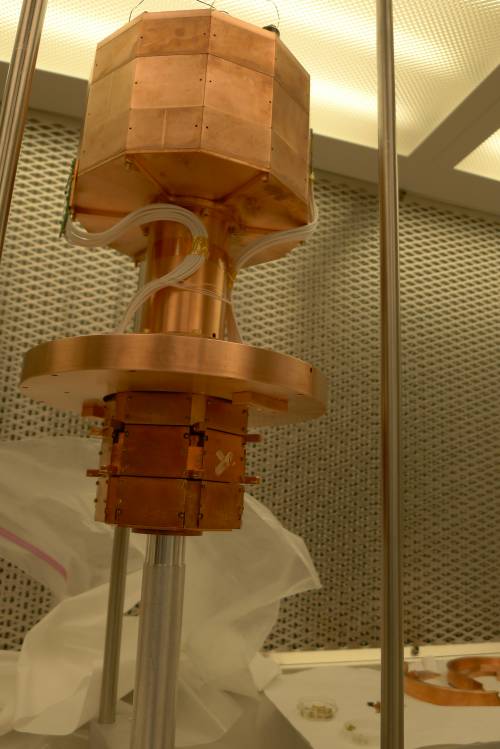 |
The detector stack was mounted on the original UMN tower, with the bias electrode on face 2 of the tower and the readout electrode on face 5 of the tower (LED on electrodes are thus at 90° to each other.
Data
LED Tests
LED choice: IR25-21C/TR8 UV LED choice: E305SL
| IR25-21C/TR8 Stats | E305SL Stats | |
|---|---|---|
| Maker | Everlight | International Light Technologies |
| Wavelength | 940 nm @ 20 mA | 310 +/5 nm @ 20mA |
| Material | GaAlAs | Si Lens |
| Chip Size | 320 x 160 x 110 um | 345 x 345 x ~190 um |
| Emission Angle | 160 ° | 120 ° |
| Operating Temperature | -25 to 85 °C | -20 to 45 °C |
| Spectral Halfwidth/bandwidth | 45 nm @ 20 mA | 10 nm @ 20mA |
| Output Power | min: .5 mW, typ: 1 mW @ 20 mA | |
| Forward Voltage | max: 1.5 V, typ: 1.2 V @ 20 mA | max: 4 V, typ: 5.5 V @ 20 mA |
| Unit Price | $0.50 | $29.99 (must buy 10) |
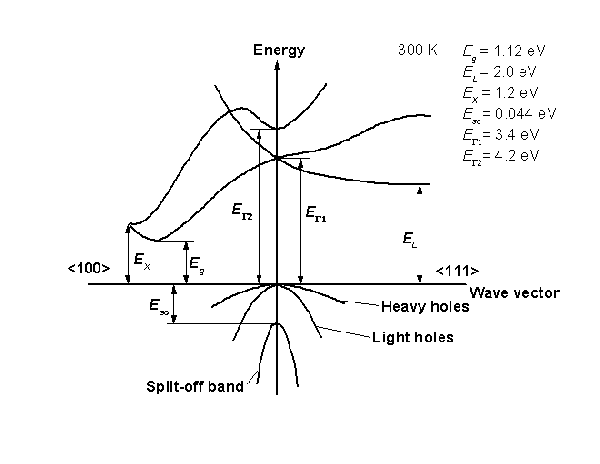
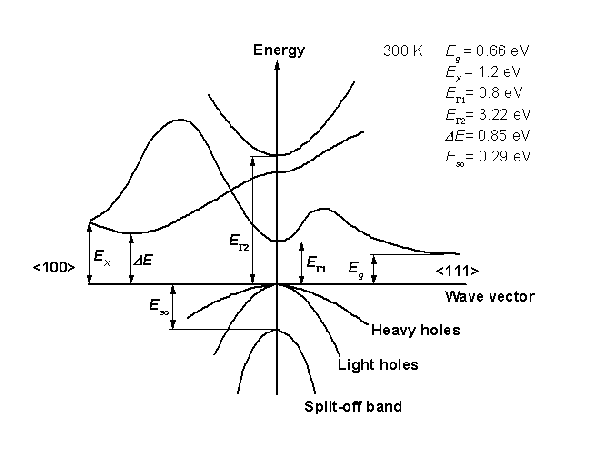
As the table shows, the traditional LED is an IR LED with a 940 nm (1.32 eV) and provides enough energy to excite to the indirect Si band gap or the Ge direct bandgap. The new UV LED is 310 nm (4.0 eV) and would provide enough energy to excite to the Si direct band gap.
| Si Bandgap | Ge Bandgap |
|---|---|
 |  |
IR LEDs are connected to the DIB via the usual pins (Detector level pins 9 and 10), and UV LEDs are connected to the DIB via pin 3 (QET B return) and pin 5 (QET C return). The following table outlines the pins and switches tied to LED use for this crystal.
| Name | DIB Pin | D50 Connector Pin | Diverter Switch Number |
|---|---|---|---|
| QET B Returns | 3 | 29* 47 48 33 | U08-1 U09-5 U09-2 U10-3 |
| QET C Returns | 5 | 5* 9 10 28 | U03-3 U-5-2 U06-3 U07-3 |
| LED 1 (IR) | 9 | 42 | U06-1 |
| LED 2 (IR) | 10 | 26 | U06-2 |
* These are open on Stripline 27, which is connected to readout side of electrode.
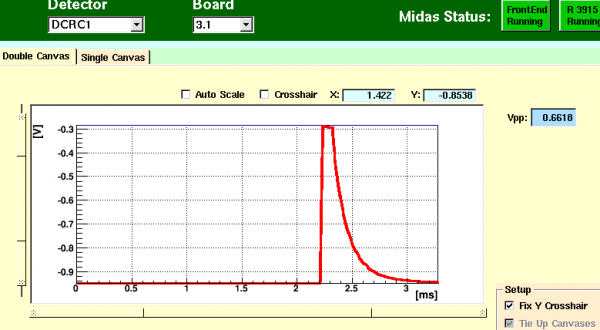
At the warm end, we use modified diverter boards to switch between LEDs. They are described briefly here
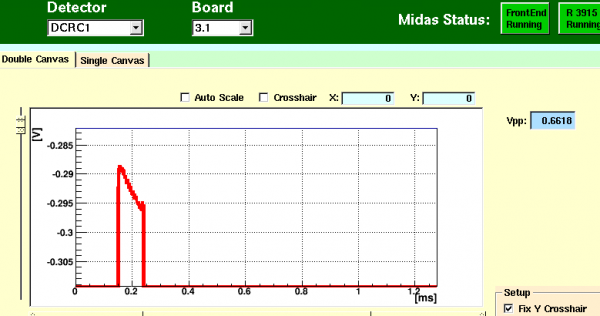
| G106 IR LED flash | |
|---|---|
 |  |
Processing
Test processing series 07160614_1451 was made to practice processing when only one charge readout was not noise. See description below from run diary page. <blockquote>Use switch board to turn off DIB 1 QI bias, source, drain and feedback (Switches 9-3, 9-4, 10-2, 10-5, respectively). Disconnect DCRC 3. Start 15 minute test series, reading out only DIB1 (Qouter pulses, all else should be noise) at 0 V Bias with 30s initial flash and 25min cooldown. Triggering on DIB1 Qo at 60ADC bins. 1000 randoms before and after.</blockquote>
Analysis
Later Analysis
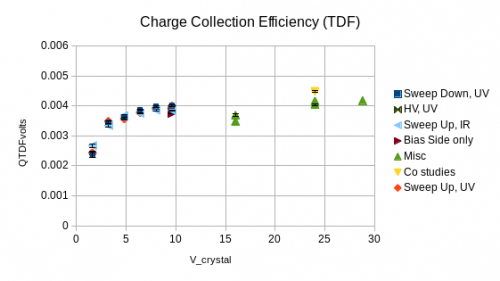
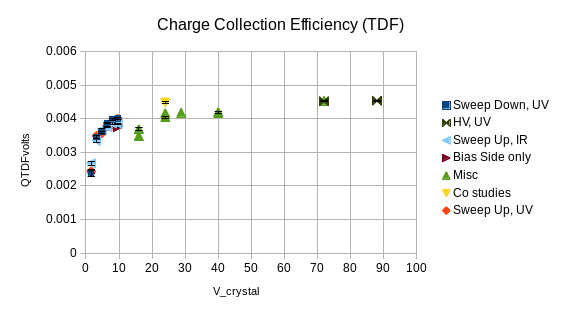
Some analysis was done in early 2018 for use in the combined r60/r65 150mm paper. First, the charge collection efficiency (seagull) plot was modified to include dcrc gain asymmetries measured in subsequent runs. Additionally, CCE values at each bias point were combined to clean up the plot. The final version is shown if figure 1 below.
| Figure 1 |
|---|
 |
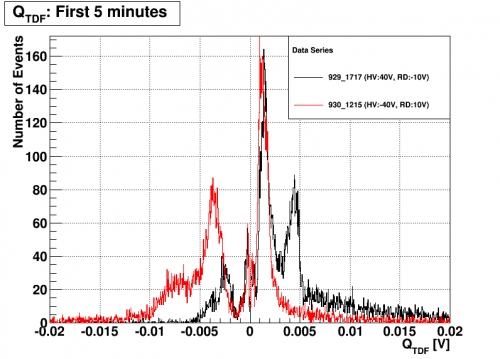
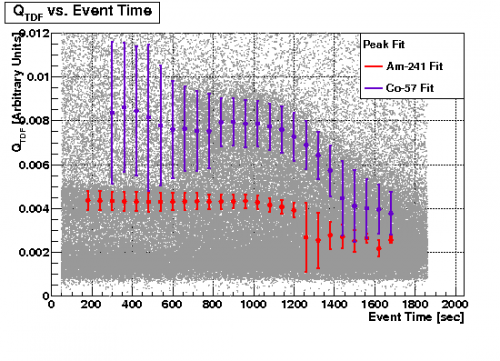
Allison's peak fit v time data was used to calculate the 80% and 60% hold times for various series. These values, along with an emprical fit of the CCE plot to a power law, were used to calculate the implied counter-bias in the crystal as a function of time (in the style of Matt's r65 analysis here). The result of this analysis is shown in figure 2.
| Figure 2 |
|---|
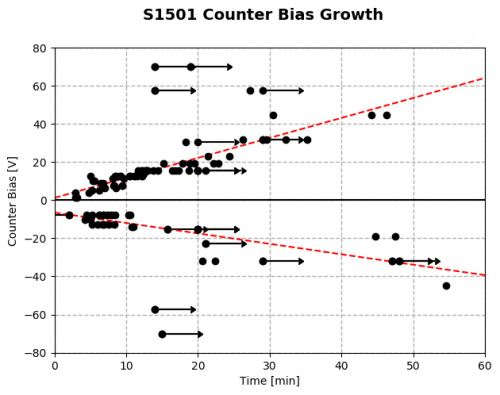 |
| Implied counter bias vs time. Some series did not reach the 60% or 80% fall times in data, so points are shown as limits. |
The measured counter-bias growth rate was 1.05 V/min for positive biases, but only 0.55 V/min for negative biases. It is not known why there is such a discrepancy. There was some trouble reconstructing some negative bias pulse amplitudes, but the %fall times should be agnostic to this. Treating the system as a set of parallel plate capacitors and assuming that all liberated charges come from events and contribute to a smooth surface charge density as described in Matt's note linked above, these rates imply ionizing energy deposition rates of 93 and 49 MeV/s for positive and negative biases respectively. Given the quality positive bias data, 93 MeV/s is the more trustworthy number.
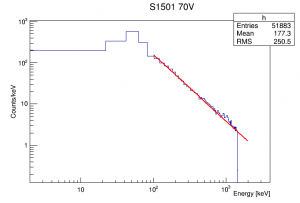
Calculating the average event energy is difficult because the detector signal saturated at ~1.5 MeV. A rough fit was made to the spectrum above 100 keV. using this fit, the average event energy above 100keV is 534 keV. Including the data below 100keV and extrapolating the flat background below threshold gives an overall average energy of 280 keV. This assumes the energy calibration is linear up to MeV and neglects muons.
| Figure 3 |
|---|
 |
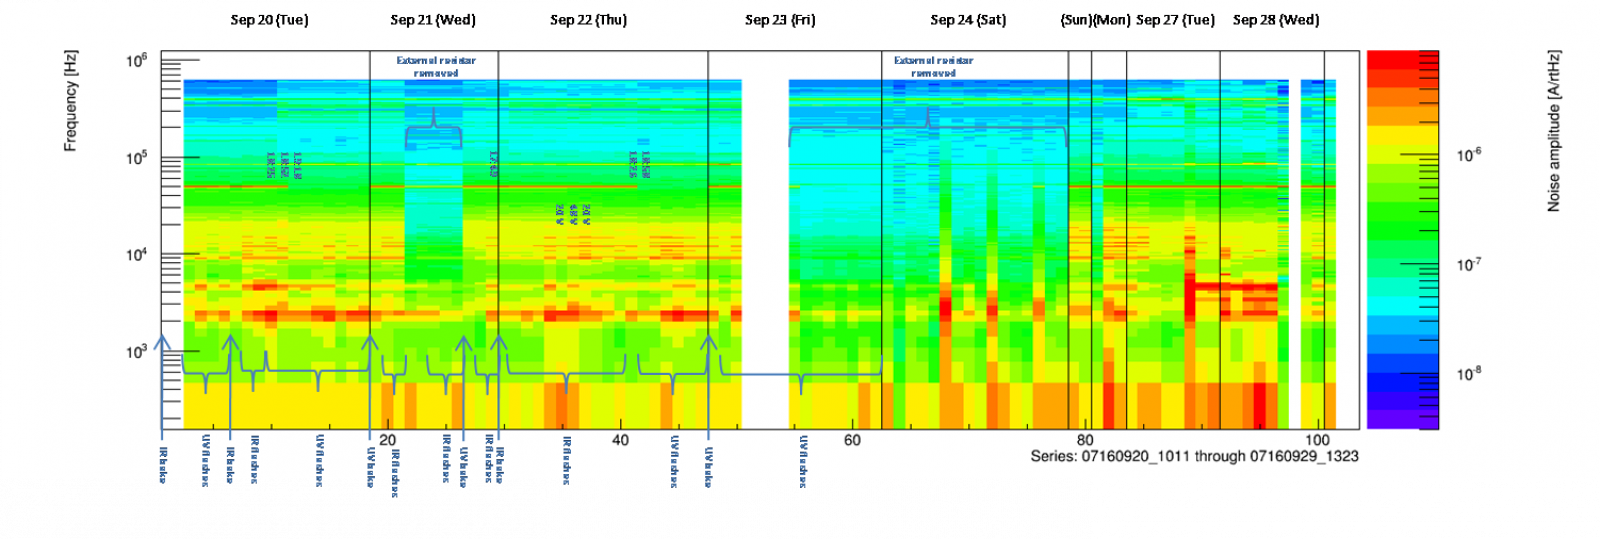
Noise studies
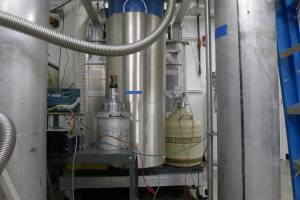
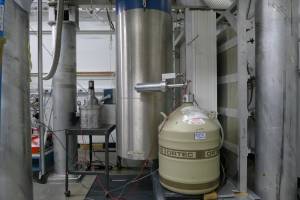
NaI and HPGe
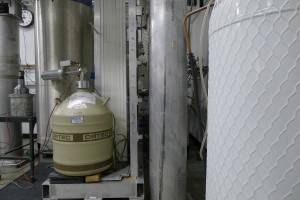
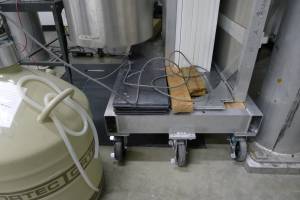
Photos of the NaI and HPGe detector setup. During Run 60 these detectors were set up near the fridge with and without the PuBe thermal neutron source present for capture-gamma coincidence calibration studies. These were early tests, no attempt was made to look for coincident events in the 150mm Si detector because its energy threshold was too high.
 |  |  |  |