Table of Contents
Run 56 Summary
Pi-filter board noise and parasitic power tests
Main results
Note on analysis page Presentation for Tower Technical Meeting 2016 Feb 26
Further parasitic power tests
- No increase in P_par was seen with the Rev2 board's shield plate removed. Test was done using pi-filter boards with all lines unfiltered. (Had a difference been seen it may have explained why DIB2(RevC) is much less affected by unfiltered lines.)
- Boards versus Dsubs: P_par was about 1 pW higher for the RevC.2 boards' channels using the boards (all filtered) versus the Dsub filters. No difference seen in the Rev2 board's channels.
- Inspired by a suggestion at the Tower Technical meeting, we tried plugging the pi-filter boards in at the E-box, far from the DCRCs, to test the idea that they were radiating RF to the boards over the filters. Test was done with all lines filtered. P_par was significantly higher at the E-box than when the pi-filter boards were close to the DCRCs, by about 4 pW for RevC.2 and 1.5 pW for RevC. I don't know why this is the case.
- Inspired by suggestions from Sunil about building hermetic RF shields, we tried wrapping the pi-filter boards in foil, with holes for the connectors, with the foil electrically isolated from the boards. Test was done with all lines filtered. No improvement was seen in P_par.
- With the DCRCs stacked, with Dsub filters (as opposed to the normal horizontally separated arrangement) we found a small increase in DIB3(RevC.1), the middle of the stack: about 0.5 pW greater P_par. In the past we had measured notably higher noise in the stacked configuration.
- With the DCRCs stacked, with pi-filter boards (all lines filtered), we found about 0.4 pW greater P_par in DIB3(RevC.1), a similar result to the Dsub case above. If the effect had been larger it would be a possible explanation for the higher P_par seen when the pi-filter boards were at the E-box, since that is also a stacked arrangement. But the stacking effect is too small to explain the E-box effect.
Photoneutron calibration
Mu-metal shield tests
Purpose
Effect of mu-metal shield on W TES
- Sunil: “The most obvious way in which magnetic fields affect TESs is in moving Tc around. When you work it out mathematically, one finds that this does pretty much what you expect: a changing B field causes the transition curve to shift up and down in temperature, effectively creating a fake signal.”
- measure Tc with and without shield
- measure IbIs with and without shield
Effect of mu-metal shield on Al fins
- cooling below 1.2 K transition without shield present may trap flux
- Sunil: “Phonon collection is definitely the most interesting quantity — we want to see whether trapped fluxes creates qp trap sites and reduces the diffusion length.”
- measure phonon collection efficiency in normal setup
- remove shield, warm above 1.2 K, cool again, replace shield
- remeasure phonon collection efficiency
Method
Prior to lowering the shield,
- the TES critical temperatures were measured
- mini-IbIs data was taken to measure TES bias power at transition, and
- Ba data was taken to measure phonon collection efficiency.
On 2016 March 8 the mu-metal shield was untied from the cryostat ears and lowered into the pit using the hoist:
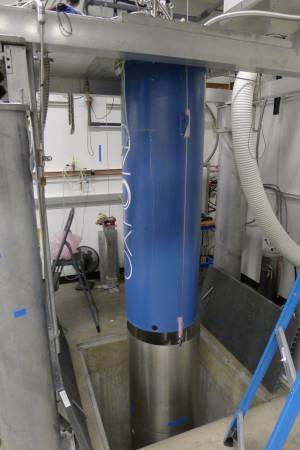
Care was taken to electrically isolate the cables from the fridge as per usual policy to avoid ground problems.
With the shield down, more mini-IbIs data was taken and the critical temperatures were remeasured.
On 2016 March 9 the tower was warmed to about 1.6 K, above the 1.2 K Al transition, then cooled again. The warming was accomplished by suspending circulation and apply 1 mW heat to the MC. It was not necessary to turn off the 1K Pot.
After cooling back to base the mu-metal shield was raised again and tied to the cryostat ears as normal. More Ba data was taken to remeasure the phonon collection efficiency.
Also on 2016 March 9 the magnetic field was measured at a position in the pit with and without the shield present, using a Hall probe borrowed from the undergrad labs.
Results
Magnetic field measurements
The magnetic field at a position about 70 cm below the cryostat was measured along three axes with and without the shield present. Details are listed here. Each measurement was repeated four times, each time re-zeroing the Hall probe. The standard deviations between repeat measurements averaged about 4 μT, suggesting an error in the mean measurements of 2-3 μT.
| Magnetic field (μT) | ||
|---|---|---|
| With shield | Without shield | |
| North | -2 | 13 |
| West | 0 | -5 |
| Up | -4 | -61 |
| Measurement uncertainty: 2-3 μT | ||
The without-shield measurements are consistent with the Earth's magnetic field in this region according to Wikipedia. The with-shield measurements are roughly consistent with zero, although the probe is not very sensitive to know how well the shield works. The best that can be said is that it's less than a few μT. (Since the shield is open at top and bottom it would not be surprising if there is some residual vertical field.)
Update
On 2016 April 19 the field in and out of the shield was remeasured using a magnetometer borrowed from SLAC. The summarized results:
| Magnetic field (μT) | ||
|---|---|---|
| With shield | Without shield | |
| North | -0.55 | 12.32 |
| West | -0.11 | -1.40 |
| Up | -1.60 | -54.23 |
| using SLAC magnetometer | ||
| attenuation factor ≈30 | ||
More detailed field-versus-height data was taken on 2016 May 17
Critical temperature and IbIs data
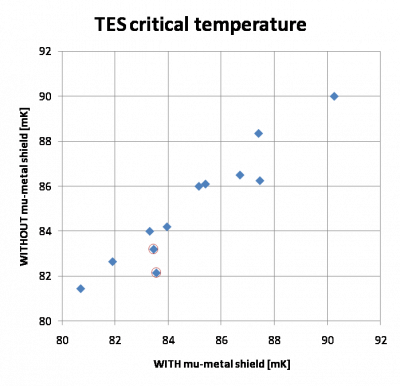
The critical temperatures all fell between 80 and 90 mK. (G106a's Tc's were originally measured in Run 34 - those measurements were on average about 7 mK lower than the new measurements.)
Without-shield Tc values are not significantly different from with-shield Tc values. On average the without-shield values are higher by 0.1 ± 0.8 mK. If anything one would expect them to be lower. If we remove four outliers (DIB1pB, DIB2pA, DIB2pC, DIB3pA), the without-shield Tc values are higher by 0.6 ± 0.4 mK.
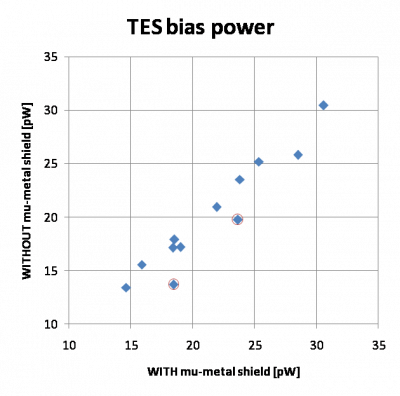
The TES powers derived from the mini-IbIs are slightly smaller in the no-shield case, by 1.5 ± 1.5 pW. This may suggest some effective parasitic power but it is small. Removing a few outliers (DIB2pA, DIB3pA, DIB3pD) reduces the apparent parasitic power to 0.8 ± 0.6 pW.
Comparing the mini-IbIs results the Tc results, there is some evidence that two outlier channels may be susceptible to the lack of a mu-metal shield. DIB2pA and DIB3pA have lower Tc's (-.3/-1.4 mK) and significantly higher parasitic powers (5/4 pW). These channels are physically close on the detector, Side2pB and Side2pC, two adjacent quad channels. These channels are not unusual in terms of Tc - they're somewhere in the middle.
 |  |
Phonon collection efficiency
The phonon collection efficiency was measured using the technique described in this Run 55 phonon collection efficiency note. Ba series were used to verify the calibration. The charge calibration was consistent between the shielded-cooldown and unshielded-cooldown cases.
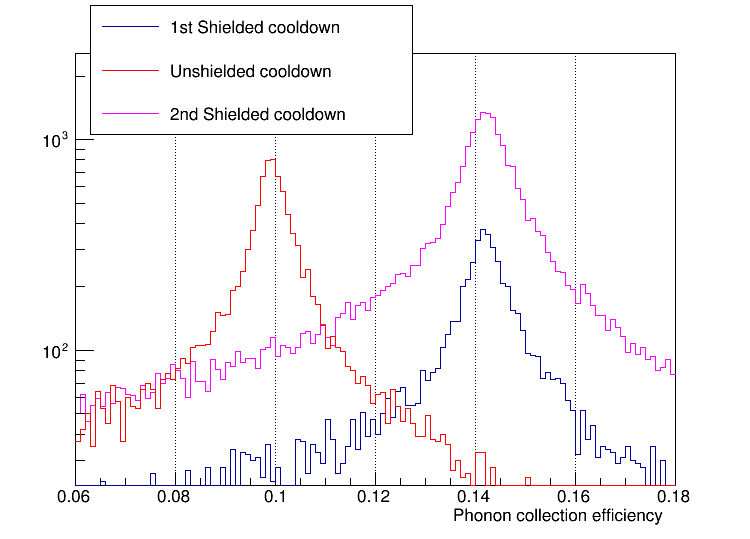
Phonon collection efficiency turned out to be significantly lower in the unshielded-cooldown case:
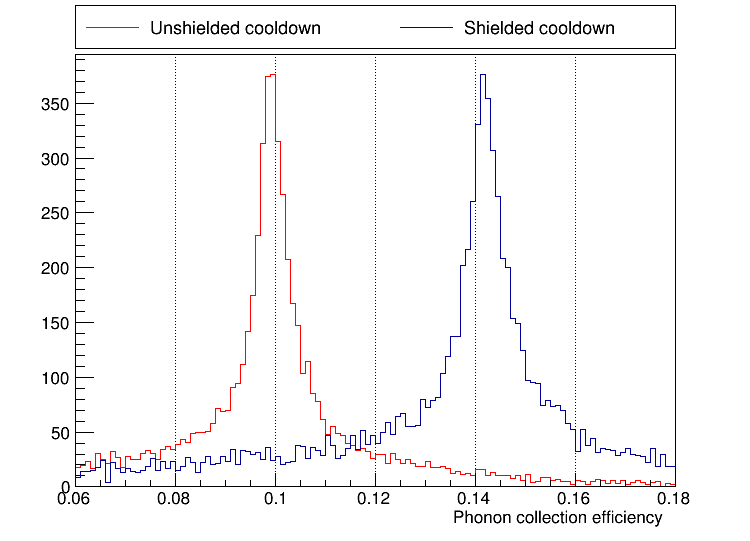
Apparently the Al fins are susceptible to external magnetic fields during cooldown and don't work as efficiently if significant fields are present.
On Pi Day we again warmed the fridge above the Al transition and cooled again, this time with the shield in place. Then we took more Ba data to verify that the higher phonon collection efficiency could be restored. Indeed that was the case:
Unstable Phonon Settings in MIDAS ODB
It has been noticed this run that sometimes the phonon settings in the MIDAS ODB change without us intentionally changing them. There are three ways to adjust the values:
- directly in the online ODB browser page
- on the DCRC Settings GUI browser page
- with the SQUIDtuning (pulse-viewer) GUI, a stand-alone Root application
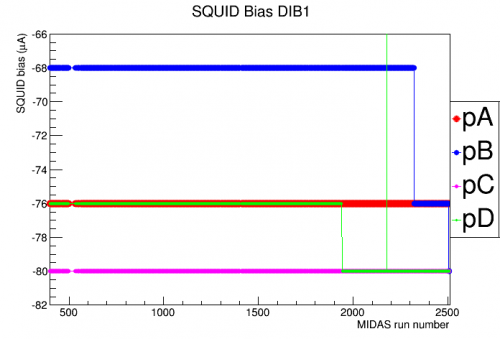
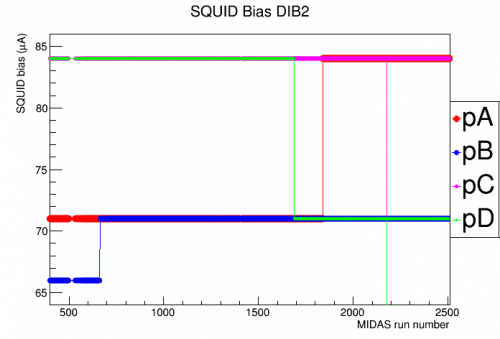
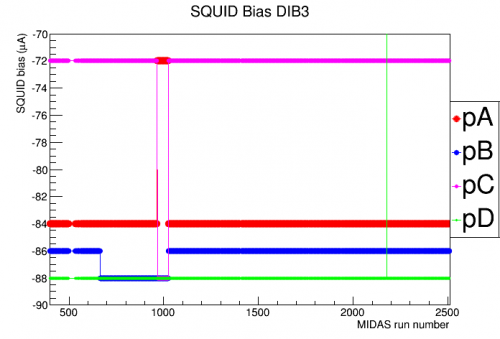
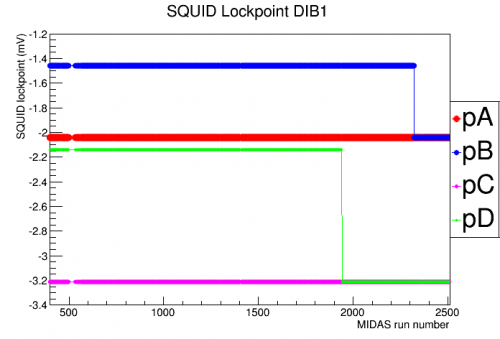
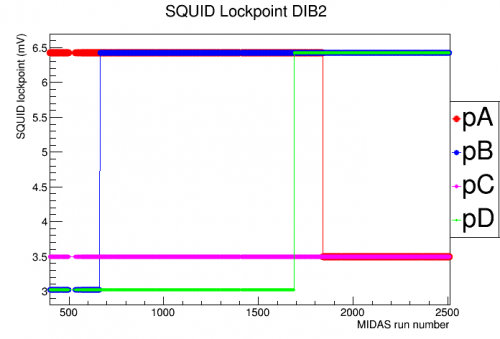
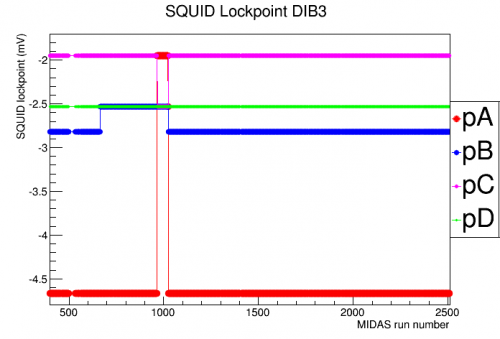
The unscheduled changes generally occur after tests or DCRC power cycling, when we generally need to look at pulses to verify that the phonon channels are working, and we often need to adjust phonon voltage offsets. I suspect that the SQUIDtuning GUI is causing the unscheduled changes. David noticed on March 2 that using the Editor on the SQUIDtuning GUI “caused all the channels of DIB 1 to have their Lockpoints and SQUID Biases set to the same values (i.e. the values that were previously only applied to DIB1 pD)”.
The plots below show phonon settings versus MIDAS run number. A MIDAS run is any instance in which data taking is started and stopped. This includes regular running and also turning the SQUIDtuning GUI on and off (in the way that we most commonly use it). ODB settings are saved for every MIDAS run. The plots cover a time range that includes the last fridge run and the current fridge run (Run 55 and Run 56). Near the beginning the values were set to the tuned values from Run 54. As can be seen there are instances in which one channels value spontaneously changes to match a different channel. There are also instances of intentional corrections and some intentional changes in the QET biases (third row).
 |  |  |
 |  |  |
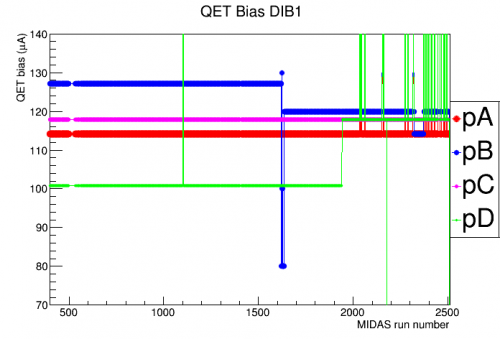 | 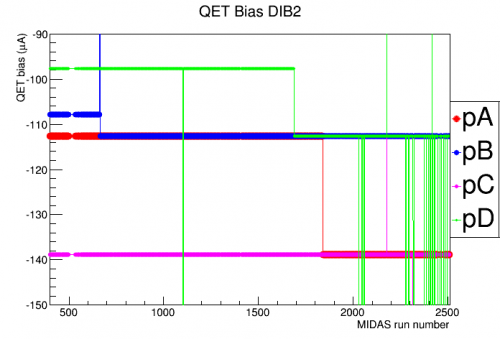 | 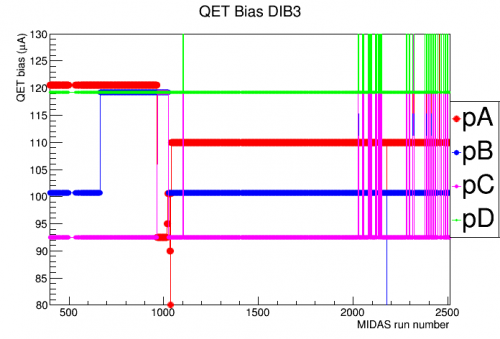 |
| Note: the vertical lines represent “mini-IbIs” tests, during which the QET biases are set to large values then back to the TES transition value. These plots are zoomed to the transition bias range. | ||
Below is a list of dates and circumstances for various incidents in which the settings changed:
| MIDAS run | date | circumstances | affected DIB/channel |
|---|---|---|---|
| 663 | Jan 4 | restarting after New Year's | DIB2pB and DIB3pB |
| 965 | Jan 15 | restarting after calibrating DCRCs | DIB3 pA&pC |
| 1025-1040 | Jan 17 | manual corrections by David | DIB3 |
| 1622-1626 | Feb 10 | intentional adjustments | DIB1 QET bias |
| 1688 | Feb 12 | Pi-filter noise tests | DIB2 pD |
| 1840 | Feb 16 | Pi-filter noise tests | DIB2 pA |
| 1941 | Feb 19 | restarting after some MIDAS tests | DIB1 pD |
| 2322 | Feb 29 | mini-IbIs tests | DIB1 pB |
| 2374 | Mar 1 | mini-IbIs tests | DIB1 pB QET bias (correction?) |
| 2504 | Mar 2 | intentionally reload recent ODB settings |
Taconis Noise
In the current run we are seeing strong low-frequency noise when the bath is high, as in the last run:
Taconis noise from Run 55 summary
This seems to be due to Taconis oscillations in the fridge. Such oscillations can occur if there is a tube extending into the bath, with an open end above the liquid level and a closed end on the warm side (at the top). One possible fix is to extend the length of such a tube at the warm end; this was attempted at the fill line with a rubber hose, see below:
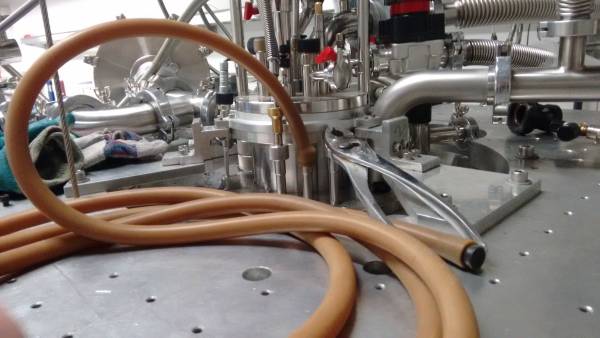
Looking at the data I initially thought that this helped significantly. Below is a noise-versus-level plot for the first several fill periods this run. The 9 Jan fill was the first period in which we tried the hose, and the low-f noise level is not elevated when the bath is 70% and 85%, unlike all the other periods. However in the subsequent fill period the problem is still present - and looking back I realized that the low noise for the 9 Jan fill corresponds to series during which Side 2 was accidentally left unbiased. It seems that leaving it unbiased must be the actual reason for the low noise. Which raises the question: why would biasing the detector make the phonon channels more susceptible to microphonics???
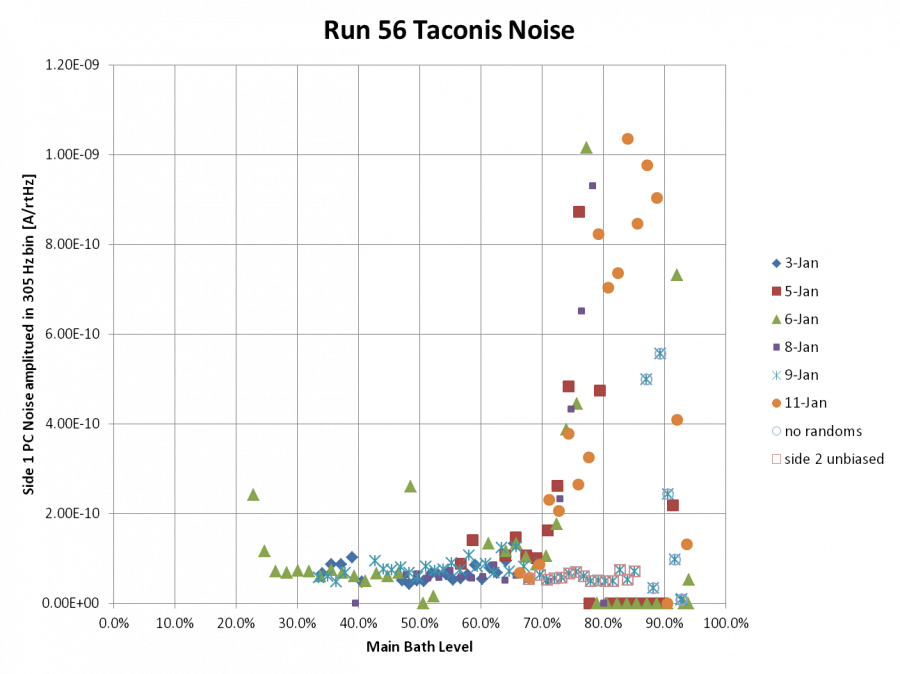
As a rule of thumb, 10 mVpp sinusoidal low-frequency noise corresponds to about 1.2e-10 A/rtHz in the noise plots. So amplitudes greater than this should be considered “elevated” and several times this should be considered “high”.
There are other tubes extending from the top at room temperature into the bath. In the figure below “10” is the fill port; there's an unused port to the right of it. “11” is the tube in which the LHe cold trap is inserted. There is another tube to the left in the picture in which the level meter is inserted.
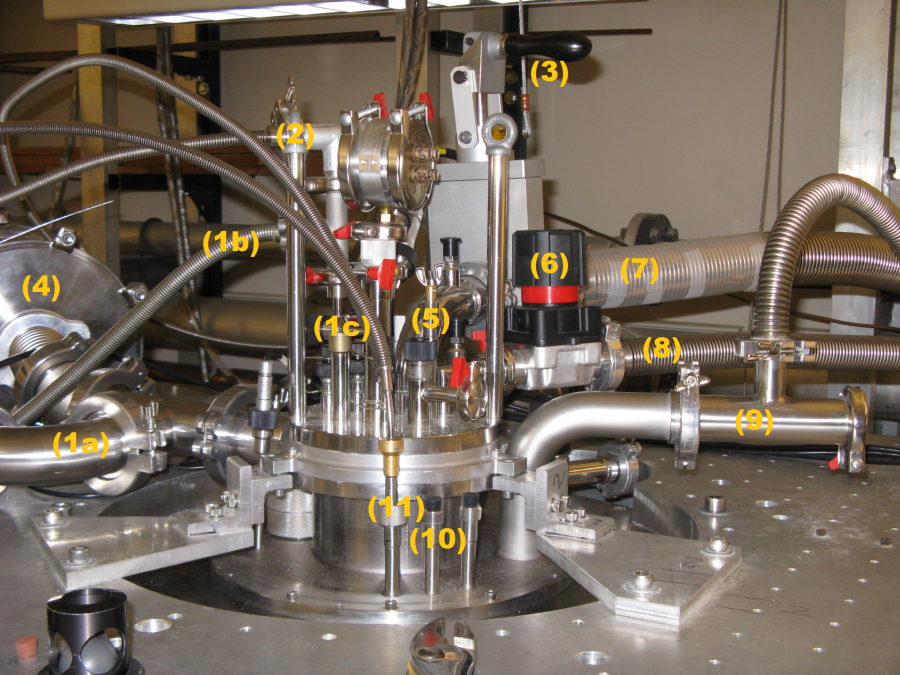 |
The tube for the cold trap and the tube for the level meter are perhaps better candidates for oscillations since according to this note online, Taconis oscillations are strongest when the (effective) radius is around 1 mm. The open tubes for the fill port and the unused port are a lot larger than that, but the two mostly-filled tubes would have an effectively smaller radius.
Here are photos giving some indication as to how far the tubes extend into the bath.
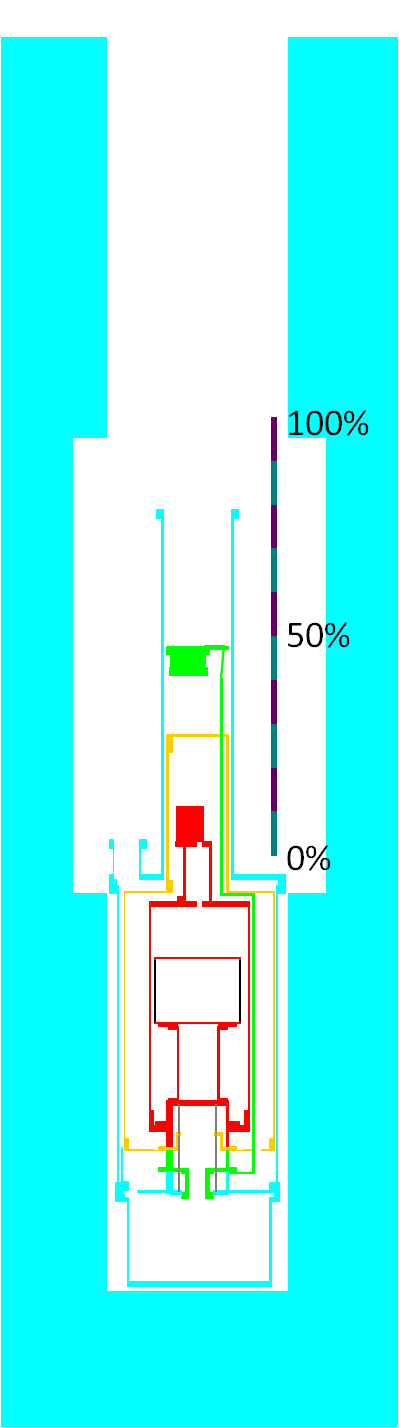
Below is a diagram showing what the bath level meter's values really mean, based on measurements of the level using a “thumper” dipstick at three different levels. The measurements show that the level meter is quite linear.
Update: remediation
Recently we have been filling to slightly lower levels, around 90%. When the bath is high, we look at traces before starting data, and typically there is noticeable low-frequency noise. We have been letting pressure out of the fill port before starting data, then replacing the stopper. It's been known that releasing the pressure makes the Taconis noise disappear at least temporarily - but as can be seen below we seem to have eliminated the Taconis noise problem entirely, either because of releasing pressure or the combination of decreasing pressure and not filling much above 90%.
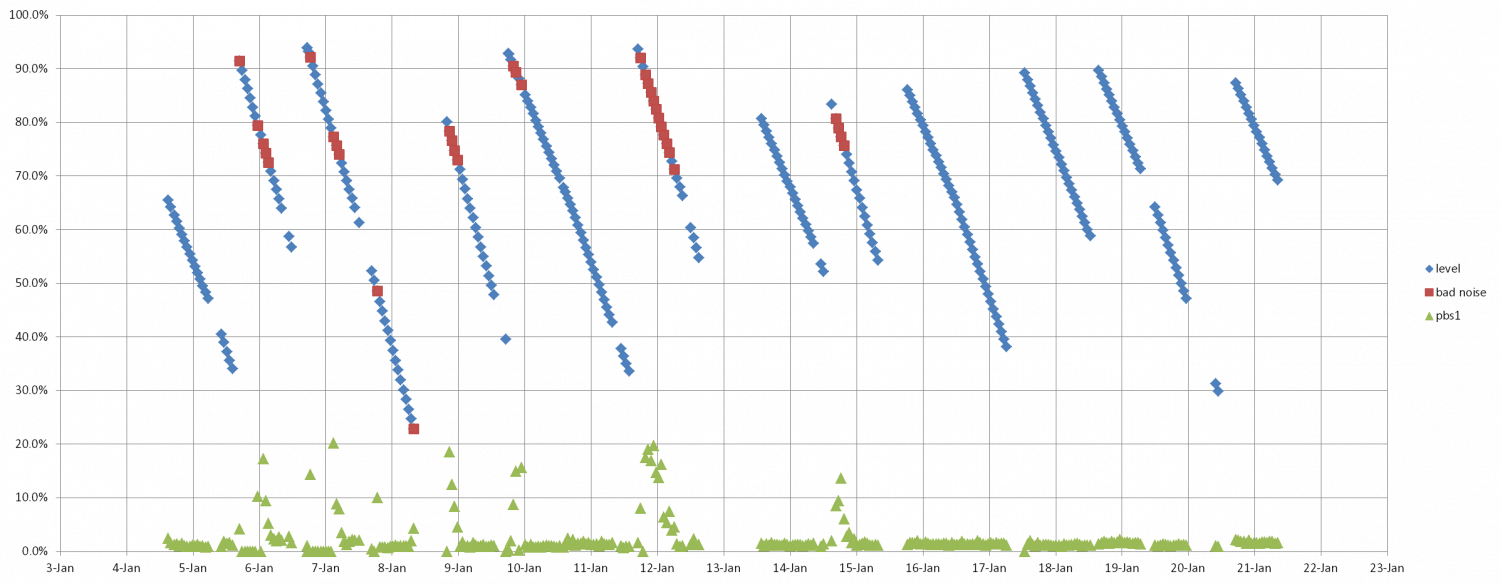
The plot above shows bath level versus time; each point represents the start time of a data series, which are spaced ~1 hour apart. Superimposed is the low-frequency noise from Side1pB. Red points on the level plot indicate where the noise was elevated above normal.
It is also clear from the plot above that in the fill periods in which the Taconis noise is suppressed, the boiloff rate is lower. Since we began the policy of releasing pressure shortly after a fill, we have seen a clear increase in the hold time of the bath. It takes more than 48 hours now to go from 90% to 20% full… previously this was not the case and we often had to do fills two days in a row.