Run 34
Run 34 is focused on testing detector G106a - a complete 100 mm iZIP crystal from Umicore (the full run setup is described in Table 1). This run is focused on charge studies, and our next run will be full detector testing with the phonon channels. The reason for this is that we wish to replace SQUET card ZC-28 for a new card because we suspect it is the reason for the the large parasitic resistance on channel C, Dib 2. Hopefully, then, all phonon channels will be responding appropriately and allow us a completely thorough test of G106a.
The tower checkout and initial electrical checkout at the breakout box can be found here. The only significant concern was that LED 2 on Dib 3 fully conducts. However, we can use all the LEDs on Dibs 1 and 2 and that seems to be sufficient for detector flashing purposes.
Our base temperature has been ~ 51 mK. We use 350 mbar of He3-H4 mixture in our circulation, leaving 370 mbar of mixture in the dump.
| Table 1: Run 34 setup |
| Detector | G106a |
| Tower | T1 |
| DIB | 1 | 2 | 3 |
| Face | 2 | 5 | 6 |
| Side coax | ZB1-1-6 | ZB1-1-9 | ZB1-1-11 |
| SQUET | ZC23 | ZC28 | ZC70 |
| Stripline | #19 | #20 | #21 |
| Readout | DCRCv3 |
| Source | 1 Am-241 disk above Ch. C1 |
DCRC boards and Switch Issues
In attempting to tune channels, take TC measurements, and collect data, there were several problems encountered related to the DCRC boards and the switch which have caused significant delays within the run.
DCRC Boards
Each DCRC board has its own quirks that must be managed.
| Table 2: DCRC Issues |
| Board | To be aware of | How issue is currently dealt with |
| DCRC31 | * When plugged into the PoE, the board does not pull power on its own. It only establishes a connection. Thus, you need to power the board manually.
* Need to turn on the clock.
* Need to power the FET heater
* The charge channel baseline is around 2 V. | * All power/enable operations can be done manually via the PuTTY session with the appropriate commands.
* This board is used with Dib 3 where there are no charge channels, so we can avoid this baseline issue. |
| DCRC32 | * Need to power the board.
* Once the pulser has been turned on, it can't be turned off without crashing the LabVIEW program and disconnecting the board.
* When attempting to adjust the driver offset to enlarge the triangle wave signal to take Tc measurements, the LabVIEW program crashed and the board was disconnected. | * All power/enable operations can be done manually via the PuTTY session with the appropriate commands.
*The pulser issue affects SQUID tuning and Tc measurements. We just have to accept the fact that the board crashes, and so we have to collect all information for DCRC32 at one time.
- QET biases are estimated after we've tuned SQUID bias, let program crash, and re-established the board. This is a huge time sink because we have to reset the board, re-zap SQUIDs, etc.
- We take all Dib2 Tc measurements at once, and then let program crash. Then re-establish board.
* The output gain was kept at 1, which made the signals small, though still readable. |
| DCRC33 | * FET heater randomly turns on.
* Qi is noisier than other channels. | * Unsure of how to correct the FET heater randomly turning on. We didn't notice this until after taking data overnight and noticed our charge data for Dib 1 was bad. We can only check to make sure everything is off before starting to take data.
* Not sure if this is necessarily a board problem, but it seems consistent with other runs. Higher trigger thresholds in data taking is used. |
| All boards | * From time to time a board doesn't completely disconnect from a port when a control or readout program VI has been stopped. If this isn't checked for, and data taking commences, data taking gets interrupted. | * Need to check the putty sessions before starting to take data to ensure that the boards aren't connected to multiple ports; Must clear a port if necessary.
- Unfortunately, if we set up a pre-flash request before data taking, this may also cause a board to be connected to two boards when transitioning to data taking. This is not a consistent problem, but it's also unpredictable. |
Switch Problems
There were several problems that suggested our switch was faulty. The DCRC boards would randomly lose power, though maintain a connection. Often we saw this after we stopped flashing the detector, but whether there truly was a connection between these two events are unsure. Also, when flashing the detector the temperature reached by the mixing chamber was inconsistent. This suggested that the switch was not providing sufficient power continuously. This was also supported by the individual power output readings for the ports- the port for DCRC33 was receiving less power than that of DCRC32's. When the board randomly powered off, attempts to re-establish it were also troubled by inability to turn on the FET heater.
The above problems were sometimes reduced by completely turning off the switch (unplugging it). This allowed us to finally get to the point of taking data (i.e. take Tc, IbIs, and charge breakdown measurements), but more problems were evident when we analyzed our data and found extremely poor charge collection. The collection was much too poor to accept that this is what our detector was capable of, and repeated data taking at the same voltage bias produced significantly different results.
We decided to remove the switch's capability to power the DCRC boards and only let it act as a connection to the DAQ computer. We also connected two external PoE supplies to the switch to act as power sources for the board. This has proven to be a dramatic improvement: we've not lost power with the boards yet, flashing produces a consistent temperature of 180 mK, and we have collected very good charge data, which will be described below. We probably will buy a new switch to replace our current set up, but we are now able to take data and that is a huge relief.
Charge Studies
Charge Breakdown
Charge breakdown studies were conducted by looking for breakdown across the crystal as well as on individual sides between the Qi and Qo electrodes. These tests were done with both polarities. The results can be found below. To summarize: this crystal shows little evidence of charge breakdown. Few hints were detected around 9 and 11 V between charge electrodes on one side, and it only became very obvious at 12 V.
| Table 3 : Charge Breakdown Studies |
| Dib 1 Polarity | Dib 2 Polarity | Comment |
| + Qi, + Qo | - Qi, - Qo | No charge breakdown detected across the crystal. |
| - Qi, - Qo | + Qi, + Qo | At 11-12 V, there were some hints of charge breakdown, but the signal wasn't continuous. |
| + Qi, 0 Qo | 0 Qi, 0 Qo | No charge breakdown detected between electrodes. |
| 0 Qi, + Qo | 0 Qi, 0 Qo | No charge breakdown detected between electrodes. |
| 0 Qi, 0 Qo | + Qi, 0 Qo | At 9 V there were slight signs of charge breakdown between Qi and Qo on Dib 2. At 10 V there were very clear signs of charge breakdown. ( details @ 1232) |
| 0 Qi, 0 Qo | 0 Qi, + Qo | No charge breakdown detected between electrodes. |
| 0 Qi, 0 Qo | - Qi, 0 Qo | No charge breakdown detected between electrodes. |
| 0 Qi, 0 Qo | 0 Qi, - Qo | At 11 V there was slight signs of charge breakdown between Qi and Qo on Dib 2. At 12 V there were very clear signs of charge breakdown. ( details @ 1848) |
| - Qi, 0 Qo | 0 Qi, 0 Qo | No charge breakdown detected between electrodes. |
| 0 Qi, - Qo | 0 Qi, 0 Qo | No charge breakdown detected between electrodes. |
Charge Spectra and Stability
Charge-only data has been collected using DCRCs 33 and 32 with Dibs 1 and 2, respectively. A complete inventory of data taken thus far can be found here. To briefly summarize the data taken thus far, see Table 4.
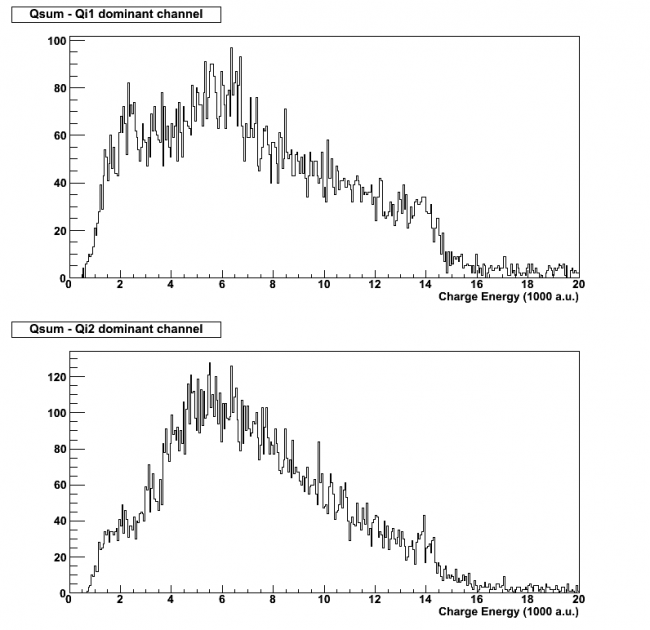
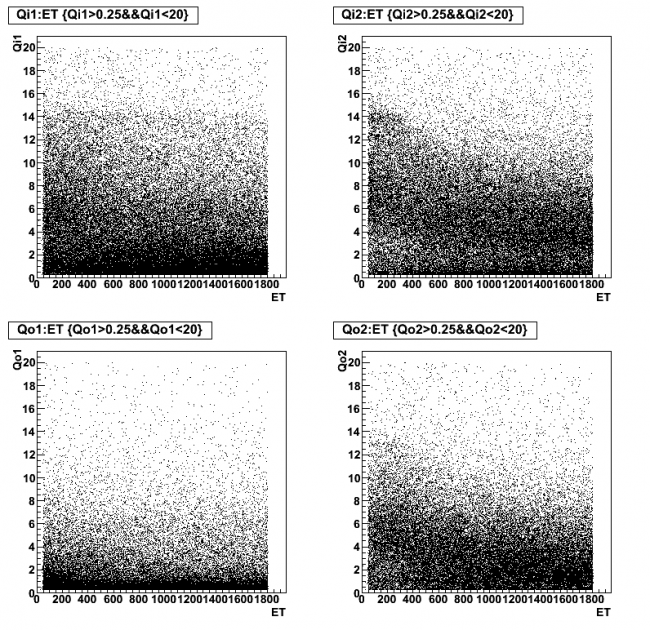
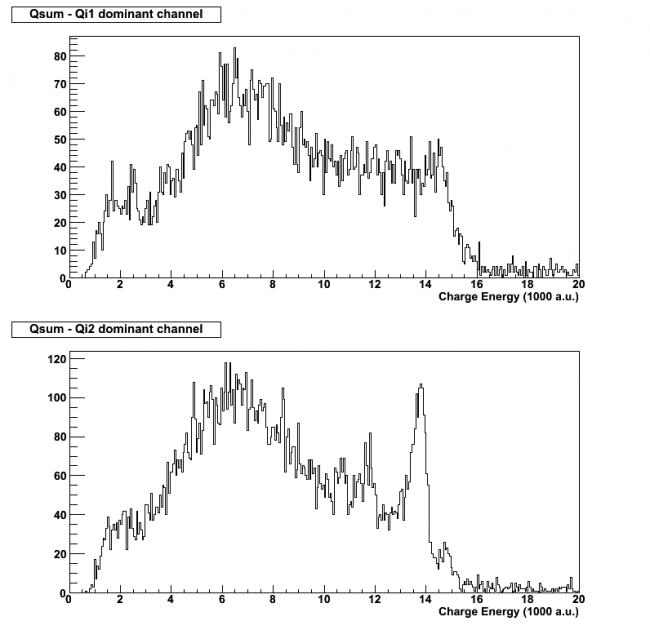
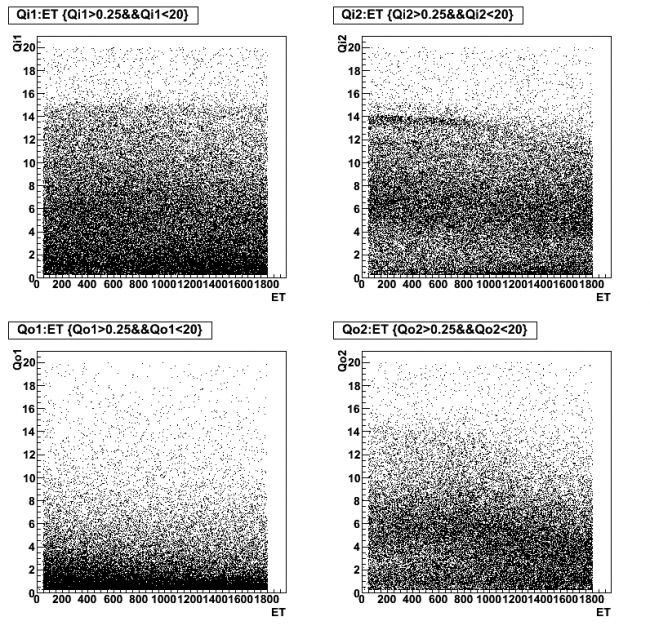
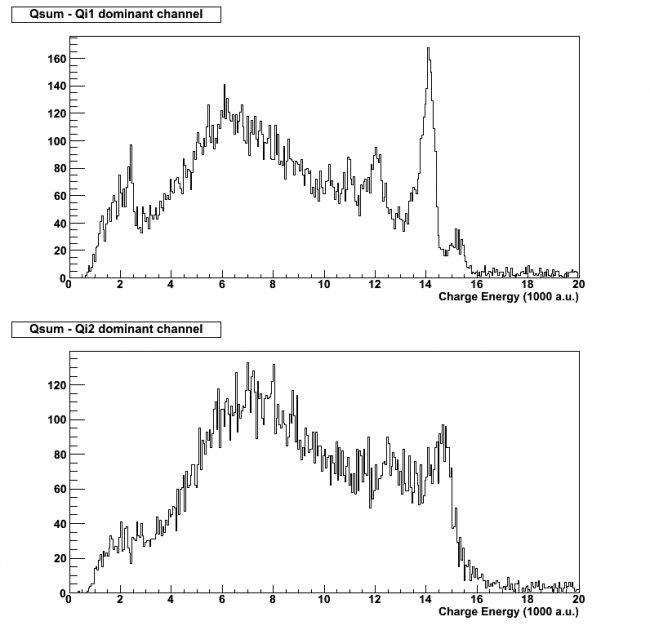
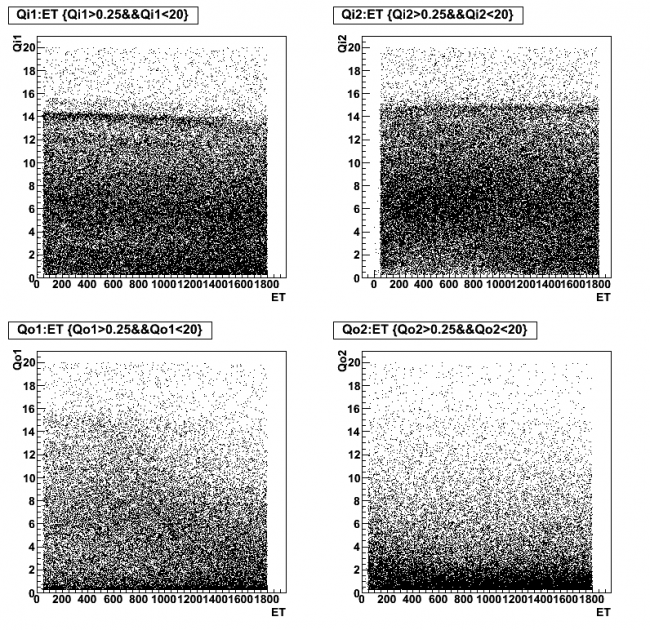
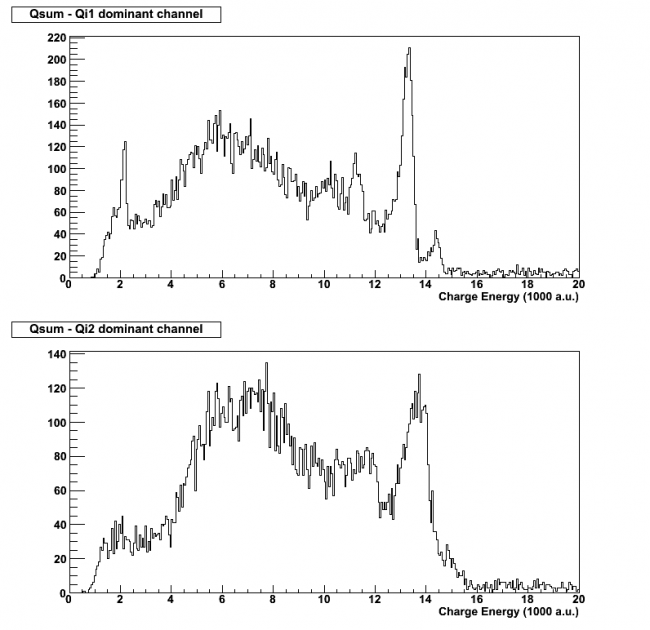
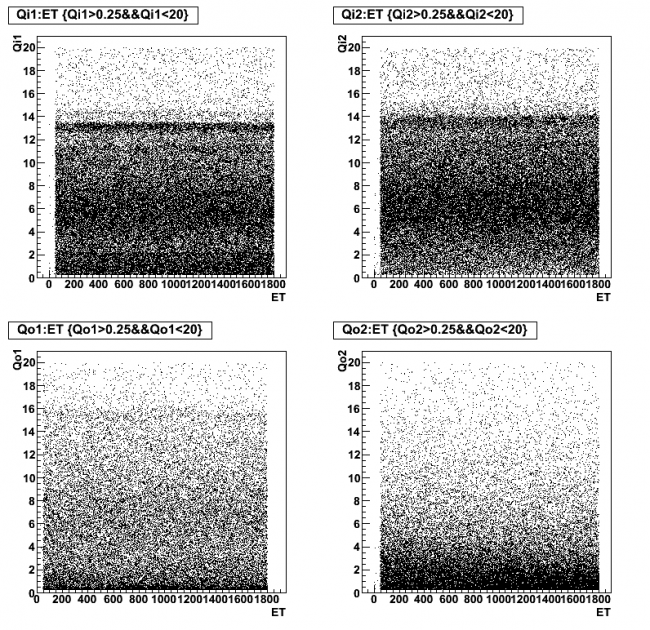
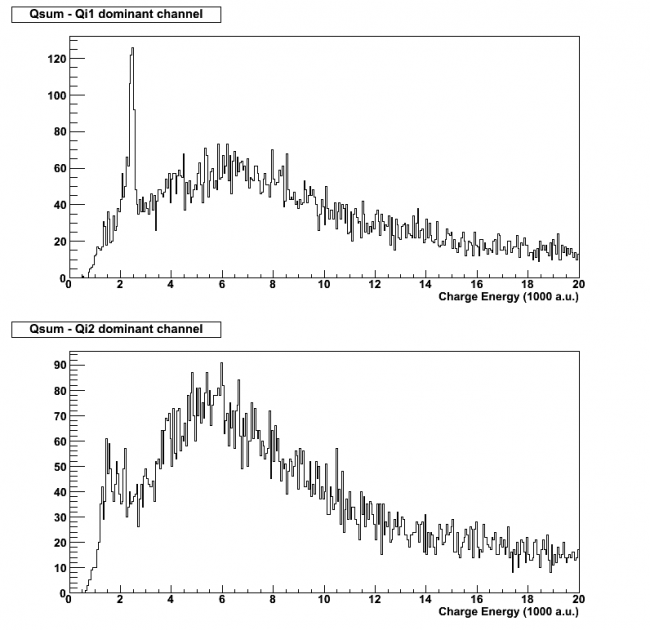
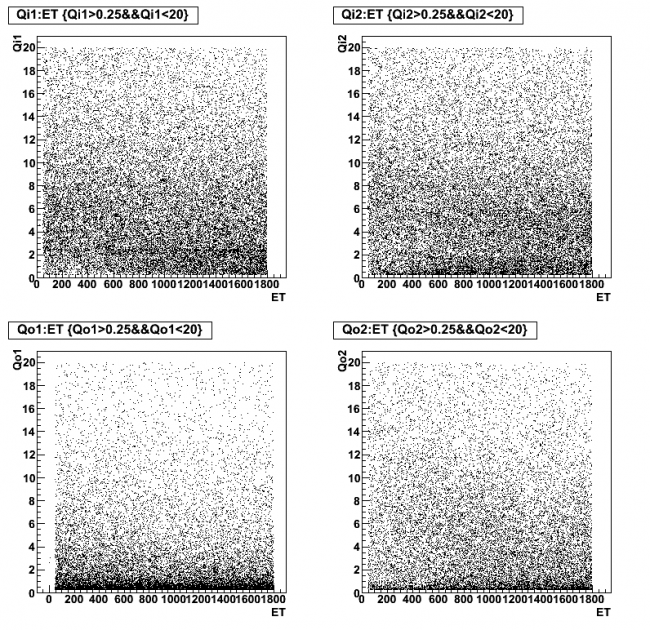
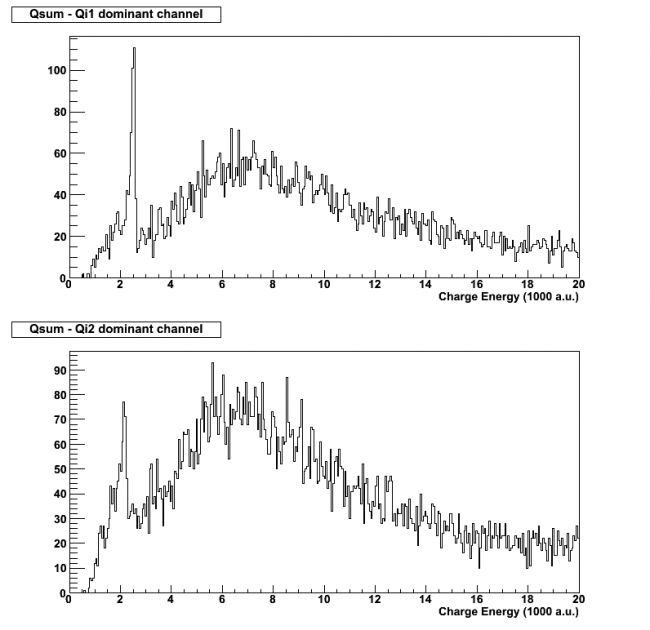
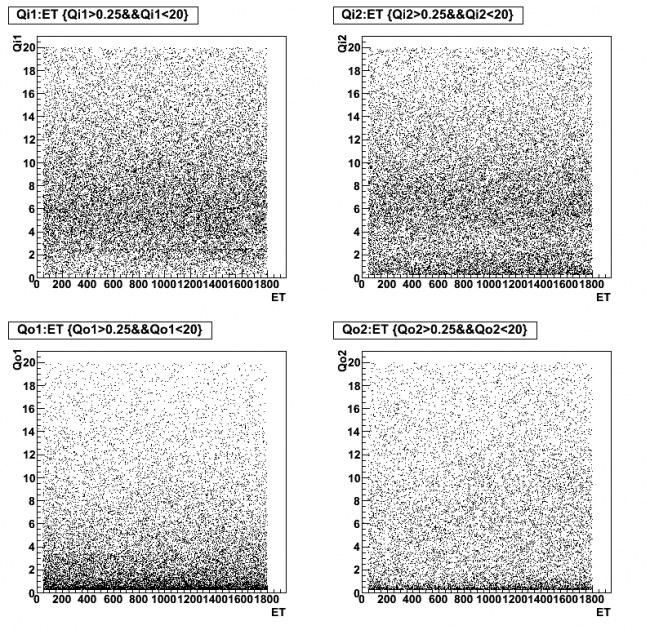
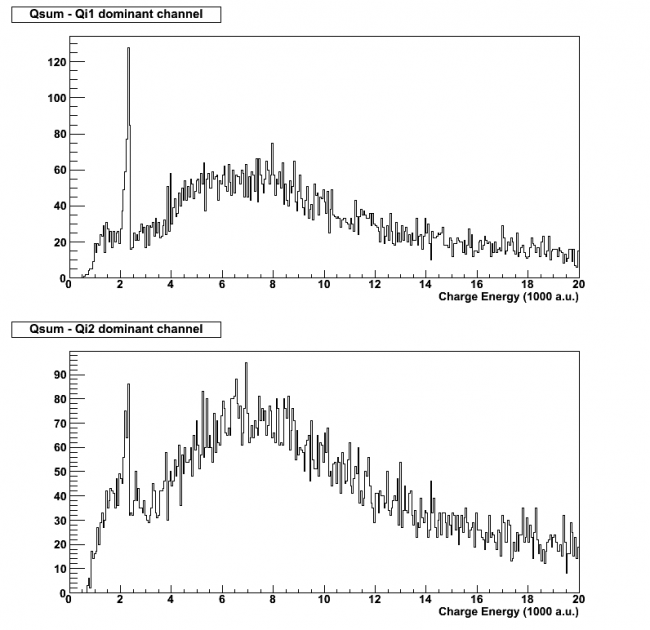
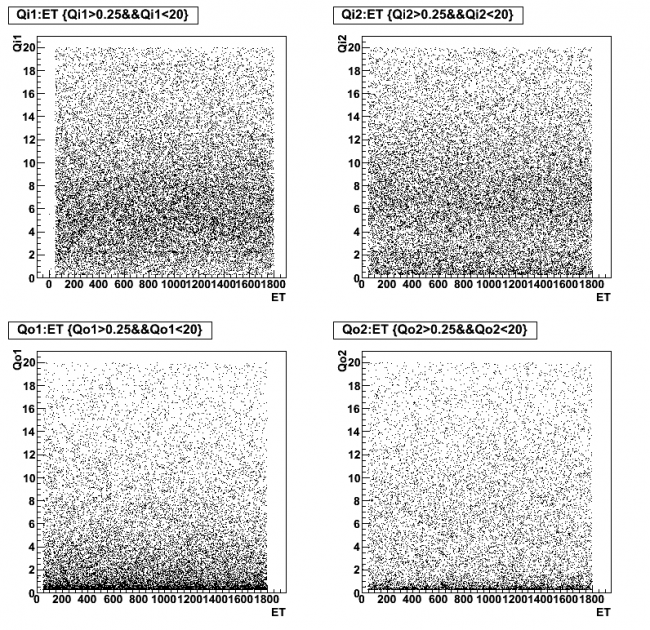
Examples of the charge spectrum at different biases are shown in Figs. 1-9. The biases are displayed for +/- 2 V, 4 V, and 8 V with the Ba-133 source and without. Biases of the reverse polarity with the Ba-133 source are also displayed.
| Table 4: Charge Data Inventory |
| Dib 1/2 Bias (V) | Source | | | Dib 1/2 Bias (V) | Source | | | Dib 1/2 Bias (V) | Source |
| +/- 2 | Ba-133 & Am-241 | | | -/+ 2 | Ba-133 & Am-241 | | | +/- 2 | Am-241 only |
| +/- 3 | Ba-133 & Am-241 | | | -/+ 3 | Ba-133 & Am-241 | | | +/- 3 | Am-241 only |
| +/- 4 | Ba-133 & Am-241 | | | -/+ 4 | Ba-133 & Am-241 | | | +/- 4 | Am-241 only |
| +/- 5 | Ba-133 & Am-241 | | | -/+ 5 | Ba-133 & Am-241 | | | +/- 6 | Am-241 only |
| +/- 6 | Ba-133 & Am-241 | | | -/+ 6 | Ba-133 & Am-241 | | | +/- 8 | Am-241 only |
| +/- 8 | Ba-133 & Am-241 | | | -/+ 8 | Ba-133 & Am-241 | | | +/- 10 | Am-241 only |
| +/- 10 | Ba-133 & Am-241 | | | -/+ 10 | Ba-133 & Am-241 | | | +/- 12 | Am-241 only |
| +/- 12 | Ba-133 & Am-241 | | | -/+ 12 | Ba-133 & Am-241 | | | | |
Ba-133 & Am-241 Data
| Bias | Series | Board Configuration | Trigger | Data Run Time Length |
| +/- 2V | 07130204_1755 | Dib1=DCRC 33, Dib2= DCRC32 | Qi/Qo on Dib2 | 30 min |
| Fig 1: First 15 Minutes | Charge vs. Time |
 |  |
| Bias | Series | Board Configuration | Trigger | Data Run Time Length |
| +/- 4V | 07130204_1255 | Dib1=DCRC 33, Dib2= DCRC32 | Qi/Qo on Dib2 | 30 min |
| Fig 2: First 15 Minutes | Charge vs. Time |
 |  |
| Bias | Series | Board Configuration | Trigger | Data Run Time Length |
| +/- 8V | 07130204_1430 | Dib1=DCRC 33, Dib2= DCRC32 | Qi/Qo on Dib2 | 30 min |
| Fig 3: First 15 Minutes | Charge vs. Time |
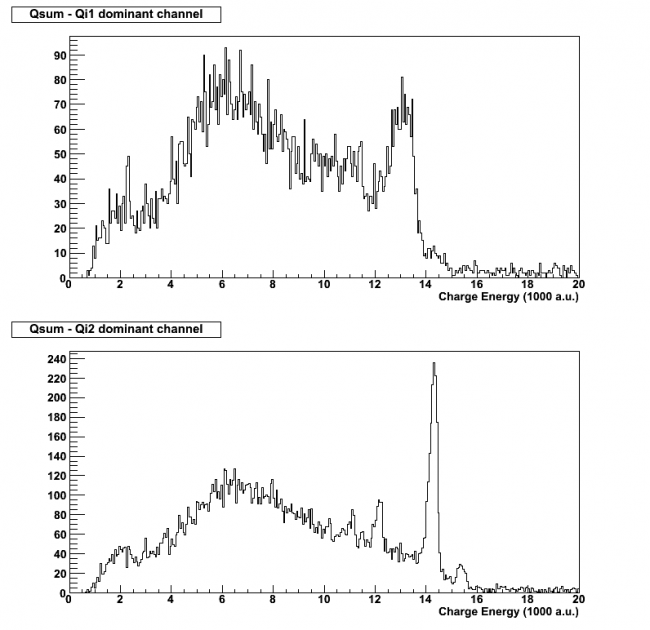 | 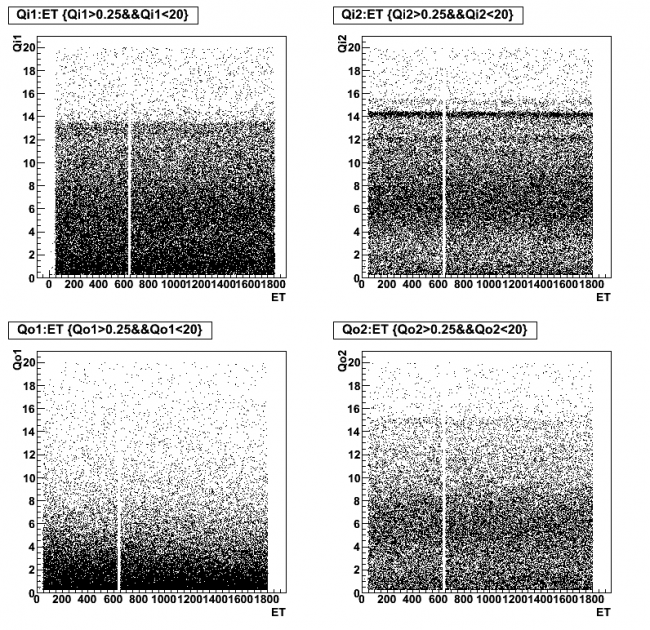 |
| Bias | Series | Board Configuration | Trigger | Data Run Time Length |
| -/+ 2V | 07130205_0115 | Dib1=DCRC 33, Dib2= DCRC32 | Qi/Qo on Dib1 | 30 min |
| Fig 4: First 15 Minutes | Charge vs. Time |
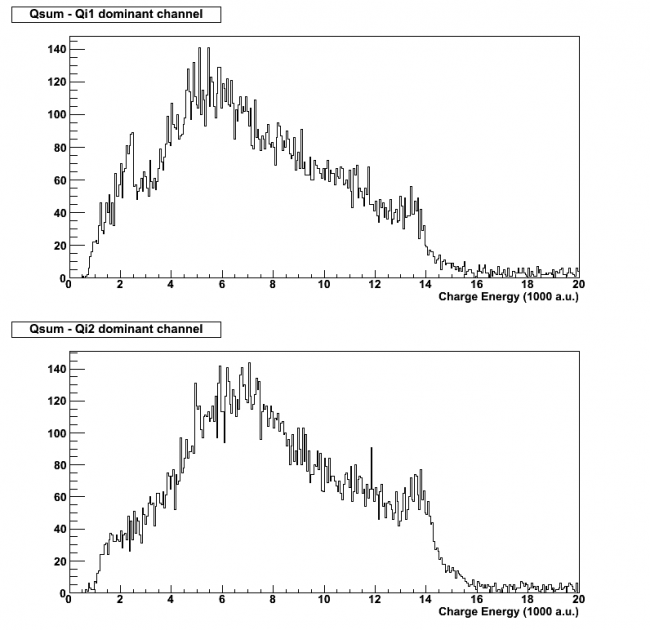 | 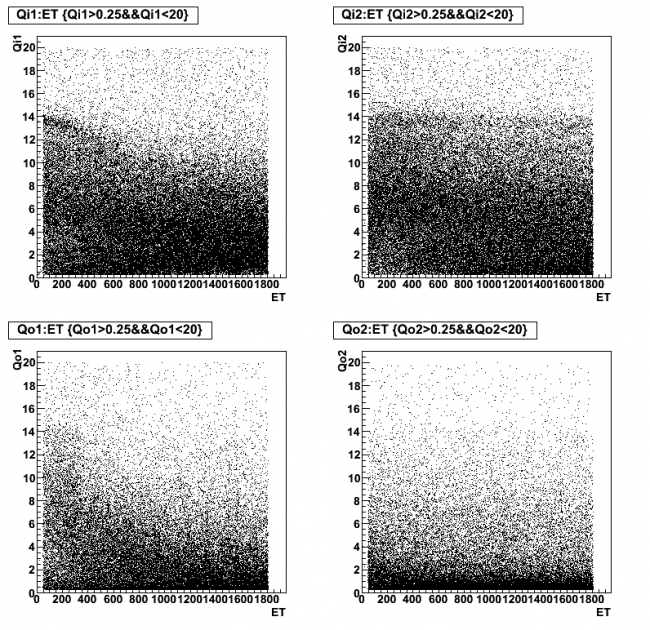 |
| Bias | Series | Board Configuration | Trigger | Data Run Time Length |
| -/+ 4V | 07130204_1430 | Dib1=DCRC 33, Dib2= DCRC32 | Qi/Qo on Dib1 | 30 min |
| Fig 5: First 15 Minutes | Charge vs. Time |
 |  |
| Bias | Series | Board Configuration | Trigger | Data Run Time Length |
| -/+ 8V | 07130204_1613 | Dib1=DCRC 33, Dib2= DCRC32 | Qi/Qo on Dib1 | 30 min |
| Fig 6: First 15 Minutes | Charge vs. Time |
 |  |
Am-241 Data Only
| Bias | Series | Board Configuration | Trigger | Data Run Time Length |
| +/- 2V | 07130205_2022 | Dib1=DCRC 33, Dib2= DCRC32 | Qi/Qo on Dib2 | 30 min |
| Fig 7: Qsum 1 and 2 | Charge vs. Time |
 |  |
| Bias | Series | Board Configuration | Trigger | Data Run Time Length |
| +/- 4V | 07130208_1204 | Dib1=DCRC 33, Dib2= DCRC32 | Qi/Qo on Dib2 | 30 min |
| Fig 8: Qsum 1 and 2 | Charge vs. Time |
 |  |
| Bias | Series | Board Configuration | Trigger | Data Run Time Length |
| +/- 8V | 07130208_2304 | Dib1=DCRC 33, Dib2= DCRC32 | Qi/Qo on Dib2 | 30 min |
| Fig 8: Qsum 1 and 2 | Charge vs. Time |
 |  |
Charge Collection Efficiency (WIP)
Phonon Studies
IbIs and Resistance Values
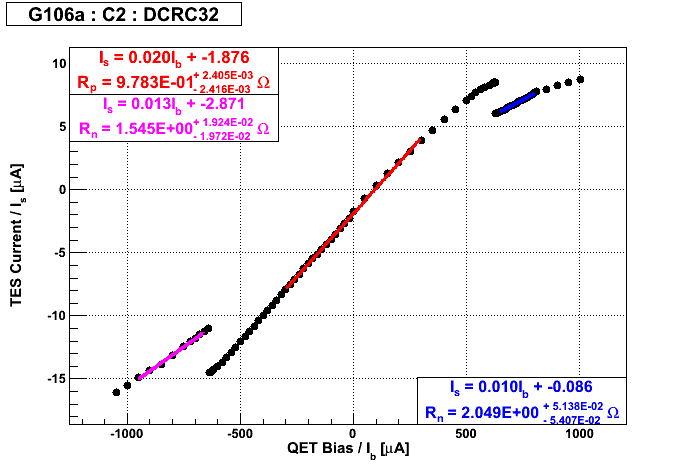
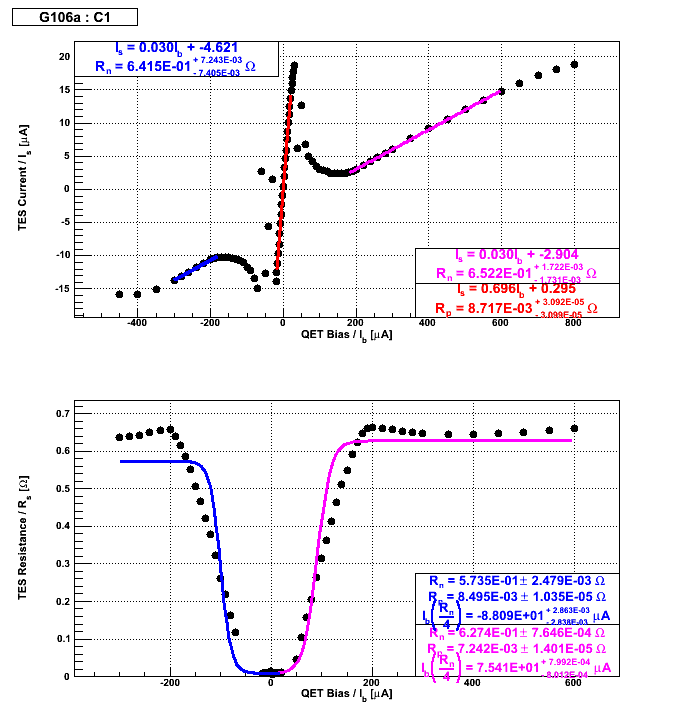
IbIs data was taken for all phonon channels. Channel C2 again has a very large parasitic resistance, which is similar behavior to what we saw when testing G103a. Figure 10 shows a comparison of C2's IbIs curve to C1's curve, C1 being a well-behaving channel. The SQUET card (ZC-28) is suspect, so we are going to do another run with a new SQUET card so that all channels will be fully functional for phonon studies.
| Figure 10: C2 IbIs curve in comparison to C1 |
 |  |
Remaining figures of the IbIs curves are located here.
Table 5 shows the values of the normal and superconducting resistances for the phonon channels. The question marks are estimations due to a not ideal fitting algorithm. The deviation in the biases use to take data from the calculated QET bias is due to the observation of the pulses under the calculated QET bias. In effort to improve the pulse shapes, some of the QET biases were slightly modified. Dib 3 is much noiser than Dibs 1/2, and almost all of its QET biases were modified.
| Table 5: Table of Parameters Derived from IbIs Measurements. |
| Side 1 |
| Channel | Rn [mΩ] | Rp [mΩ] | QET bias (where Rs = Rn/4) [μA] | QET bias used to take data [uA] |
| A1 | 811 | 631 | 4.9 | -75.6 (?) | -77 |
| C1 | 642 | 872 | 6.5 | -88.1 | -88.1 |
| C2 | 1545 | 2001 | 978 | - | - |
| C3 | 923 | 700 | 6.7 | -46.9 (?) | -47 |
| B1 | 481 | 627 | 7.0 | -97.4 | -97.4 |
| D2 | 598 | 534 | 3.8 | -75.9 | -75.9 |
| Side 2 |
| Channel | Rn [mΩ] | Rp [mΩ] | QET bias (where Rs = Rn/4) [μA] | QET bias used to take data [uA] |
| D1 | 590 | 658 | 10.8 | -68.1 | -68.1 |
| D3 | 623 | 695 | 9.3 | -76.8 | -80 |
| A3 | 682 | 756 | 5.7 | -42.1 (?) | -51 |
| A2 | 485 | 877 | 3.5 | -66.1 | -71 |
| B3 | 688 | 629 | 11.2 | -63.4 | -61 |
| B2 | 696 | 670 | 7.9 | -89.0 | -89 |
Updated phonon settings as of 2013/02/16
| Table 6: DIB 1, DCRC 33 |
| Phonon Channel | SQUID Bias (micro A) | Lockpoint (mV) | Modulation Depth (mV) | QET Bias to take data (uA) | QET Bias where Rn/4 (uA) | Inverting or Not? | Trigger [ADC bins] |
| A | 89.8 | 4.70 | 5.4 | -79.7 | -75.6 | I | 18 |
| B | 93.8 | 4.77 | 5.4 | -97.4 | -97.4 | I | 17 |
| C | 91.8 | 5 | 5.3 | -88 | -88 | I | 17 |
| D | 87.9 | 3.2 | 4.9 | -68 | -68 | I | 20 |
| Table 7: DIB 2, DCRC 32 |
| Phonon Channel | SQUID Bias (micro A) | Lockpoint (mV) | Modulation Depth (mV) | QET Bias to take data (uA) | QET Bias where Rn/4 (uA) | Inverting or Not? | Trigger [ADC bins] |
| A | 56.6 | 4 | 4 | -71 | -66.1 | NI | 21 |
| B | 88 | 4 | 4.5 | -89 | -89 | NI | - |
| C | 90 | 5.3 | 5.5 | 0 | - | I | - |
| D | 88 | 5 | 5 | -76 | -75.9 | NI | - |
| Table 8: DIB 3, DCRC 31 |
| Phonon Channel | SQUID Bias (micro A) | Lockpoint (mV) | Modulation Depth (mV) | QET Bias to take data (uA) | QET Bias where Rn/4 (uA) | Inverting or Not? | Trigger [ADC bins] |
| A | 80.1 | 4 | 4.9 | -60 | -42(?) | NI | 20 |
| B | 68.4 | 3.2 | 4 | -63 | -63.4 | I | 20 |
| C | 78.1 | 4.2 | 4.5 | -65 | -46.9 | NI | - |
| D | 80.1 | 3 | 4.6 | -90 | -76.8 | I | - |
Tc Measurements
All Tc's were measured using 10 mVpp triangle wave at 100 Hz except for Ch. C2, which used 100 mVpp triangle wave at 1000 Hz. The temperature of the mixing chamber was slowly raised using the mixing chamber heater in order to record when transition occurred and observe when the signal went normal. Then the mixing chamber was allowed to cool and Tc measurements were again taken.
Ch. C2 was was slightly more difficult to record because it required a different triangle wave to be used, and we were only able to record the Tc as the temperature of the mixing chamber increased. Ch. B3 was also somewhat difficult to get the Tc's for when initially taking measurements on Dib3. It's signal was smaller and noisier and we couldn't increase the output gain to enlarge the signal. Increasing the output gain would cause the baseline to go out of range and the driver offset adjustment was not sufficient to bring it back within range. Furthermore, when trying to adjust the gain and offset on Dib 2, the LabView program would freeze again.
| Table 9: Dib 1 Tc Measurements |
| | | | Peak-to-Peak Amplitude [mV] | Tc (T increasing) [mK ± 0.2 mK] | Tc (T decreasing) [mK ± 0.2 mK] |
| Channel | Side | Output Gain | Before Transition | After Transition | Start | Stop | Start | Stop |
| A1 | 1 | 3 | 290 | 19 | 81.2 | 82.1 | 81.7 | 80.9 |
| B1 | 1 | 7 | 830 | 51 | 81.9 | 82.3 | 81.8 | 81.7 |
| C1 | 1 | 7 | 700 | 41 | 79.3 | 81.4 | 81.2 | 78.9 |
| D1 | 2 | 7 | 670 | 41 | 75.6 | 77.4 | 77.0 | 75.1 |
| Table 10: Dib 2 Tc Measurements |
| | | | Peak-to-Peak Amplitude [mV] | Tc (T increasing) [mK ± 0.2 mK] | Tc (T decreasing) [mK ± 0.2 mK] |
| Channel | Side | Output Gain | Before Transition | After Transition | Start | Stop | Start | Stop |
| A2 | 2 | 1 | 100 | 7.7 | 76.5 | 78.0 | 77.2 | 76.4 |
| B2 | 1 | 1 | 92 | 5.4 | 77.9 | 78.5 | 78.3 | 77.3 |
| C2 | 2 | 5 | 169 | 110 | 83 ± 0.5 | - | - | - |
| D2 | 1 | 1 | 120 | 7.9 | 72.7 | 73.2 | 72.8 | 72.0 |
| Table 11: Dib 3 Tc Measurements |
| | | | Peak-to-Peak Amplitude [mV] | Tc (T increasing) [mK ± 0.2 mK] | Tc (T decreasing) [mK ± 0.2 mK] |
| Channel | Side | Output Gain | Before Transition | After Transition | Start | Stop | Start | Stop |
| A3 | 2 | 5 | 470 | 31 | 69.1 | 70.8 | 70.2 | 68.4 |
| B3 | 2 | 1 | 65 | 4.5 | 74.6 | 75.9 | 75.7 | 73.7 |
| C3 | 1 | 7 | 650 | 36 | 74.1 | 74.5 | 74.4 | 73.9 |
| D3 | 2 | 7 | 680 | 40 | 83.4 | 84.9 | 84.2 | 82.4 |