Table of Contents
Quick looks at photoneutron (Y-Be) data
Plots from the first sets of photoneutron (Y-Be) data
| Side note: using non-linear phonon energy calibration |
|---|
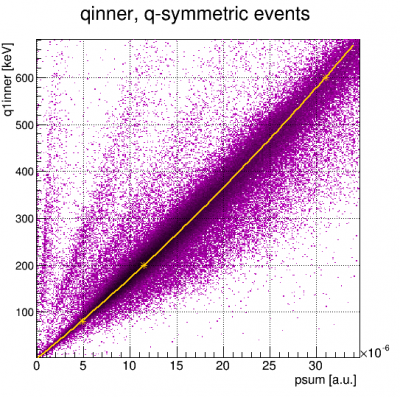 |
| NR yield band from Cf data, Run 54 |
|---|
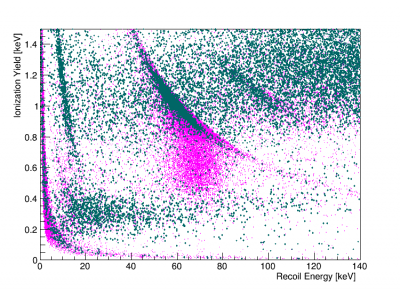 |
| Looking for NR band in photoneutron data. | ||
|---|---|---|
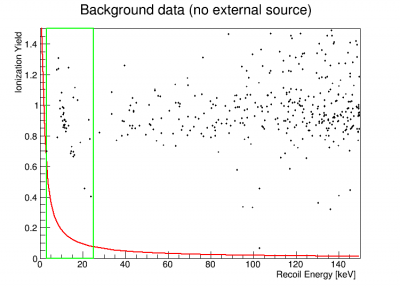 | 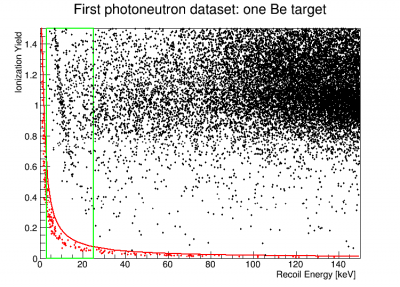 | 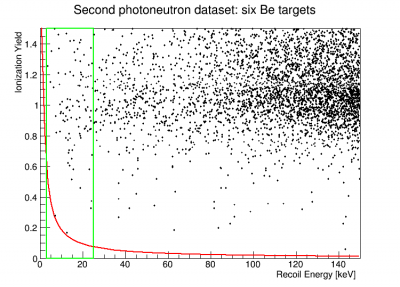 |
| Looking for hints of NR band in low energy range photoneutron data |
|---|
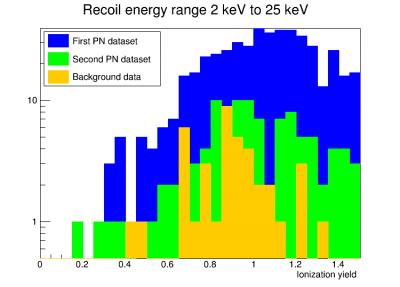 |
Differences in pulse timing between LabVIEW and MIDAS data
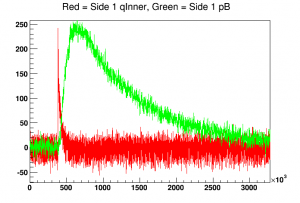
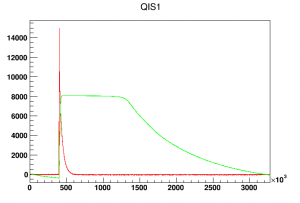
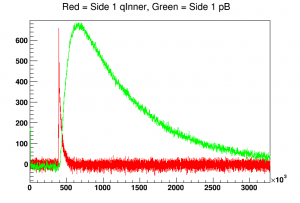
If we compare older data taken with LabVIEW to newer data taken with MIDAS (both with the same detector and DCRC setup and biases) it looks like MIDAS may not be lining up the timing correctly between charge and phonon traces:
| LabVIEW pulses, series 07151103_1703 | ||
|---|---|---|
 |  |  |
| MIDAS pulses, series 07151209_1516 | |||
|---|---|---|---|
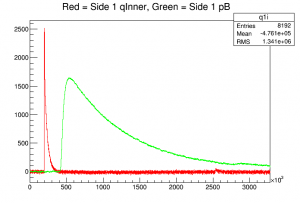 | 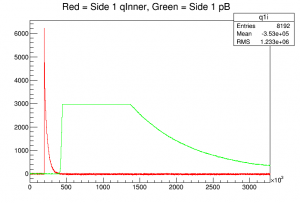 | 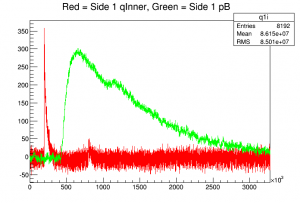 | 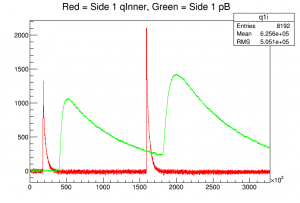 |
It should be noted that in the pulseviewer I'm using, the time scale of the charge pulse is incorrect: it assumes 0.8 us per sample rather than the correct 0.4 us per sample. In the above MIDAS plots I corrected the time axis accordingly. If the time scale is taken at face value, the charge and phonon pulse onsets line up more closely. But this seems to be a coincidence, because the measured decay times of the charge pulses are the same in LabVIEW and MIDAS cases after correcting the time axis (in both cases it comes to about 30 us).
Solution : it was noticed that the ODB prepulse settings had been set incorrectly. Our standard is to start the trace 400 us before the pulse onset. Since phonons sample at 0.8 us/sample and charge at 0.4 us/sample, this should mean that in sample units the phonon/charge prepulses should be set to 500/1000 samples. Instead we had set them to 500/250 samples. One would think this would have made the charge pulses start at 100 us, but as can be seen in the plots they actually start around 200 us. This seems to be another example of the factor-of-two thing that happens with charge pulse samples: MIDAS or the DCRC, not sure which (Anthony can clarify), sometimes considers two charge samples as one single sample (something of a trick to make it simpler to line up timing). So the correct phonon/charge prepulse settings are apparently 500/500 samples. We first tested this on 2016 Feb 4.
Update : after changing the phonon/charge prepulse settings to 500/500 samples, the MIDAS-produced charge and phonon pulses now seem to line up properly:
| MIDAS pulses, series 07160204_1249 | ||
|---|---|---|
 |  |  |
Reduced low threshold and applying high threshold
Since the first photoneutron data we reduced the threshold on the phonon channel we are triggering on (Side1 pB) from 30 ADC bins to 20 ADC bins. This lower threshold seems to come closer to the noise wall. Additionally there is now a high-energy rejection applied. This works by setting a relatively high threshold on Side1 qI and qO, then applying a pileup rejection cut with a time window large enough to cover the trigger time difference between charge and phonon pulses. The pileup rejection will not read out an event if there is more than one trigger in the window. In this way the charge thresholds act as a high energy veto.
| Two equal-length Ba series |
|---|
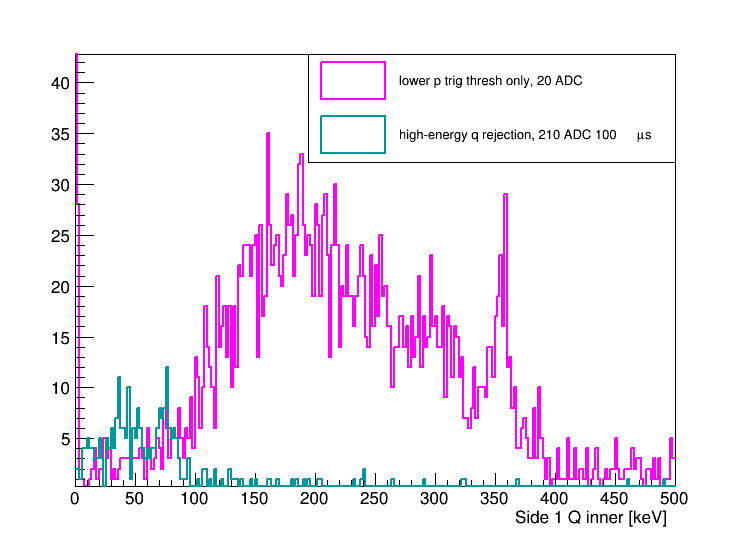 |
| quality cuts, charge-threshold cuts, charge-symmetry cut applied |
| Both series have the same event rate, ~26 Hz. The real event rate is much larger. |
The plot above shows the effect of the low-high trigger. The intent is to get more low energy events for this study. The event read rate is apparently limited by the DAQ capability so that presumably a large fraction of pulses are lost. By rejecting high energy events for readout it is hoped to get more low energy events, which are what we want for photoneutron studies (i.e. neutrons below 20 keV). For the charge-symmetric events shown in the plot it is clear that high energy events are being properly rejected and there is a higher rate of low energy events. It should be noted that the integrals of the two spectra are clearly not the same, although the total number of events in the two series are nearly the same. This indicates that in the series with the low-high trigger applied many events are being removed by the cuts applied. Possibly it is simply a matter of the quality cuts being less efficient at low energies.
| Nine 30-min series of Y-Be photoneutron data |
|---|
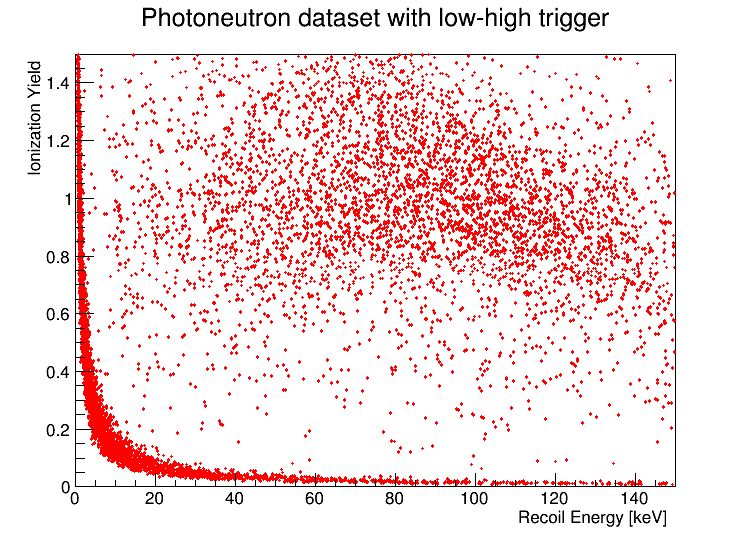 |
The plot above shows yield-versus-energy for some photoneutron data after applying the new trigger. In comparison with previous plots it does appear that there are now more events in the lower left where previously there was a dearth in that corner - i.e. the lower trigger threshold seems to have successfully reduced the energy threshold. There is however still no clear neutron band at low energies.
Processing problem and correction
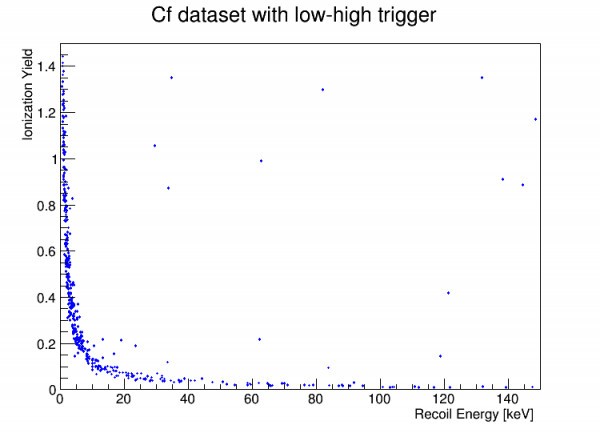
Below is a plot of Cf data with the low-high trigger conditions applied. I was disappointed to not see a neutron band, or even very many NRs - but it turns out that this was due to a processing error. After we corrected the DAQ charge prepulse setting, it turned out that the charge processing was failing because almost all charge pulses were falling outside of the allowed time window. Previous data processed OK because an error in processing canceled the error in the DAQ setting (essentially a kludge was added to the MIDAS processing to make it work). The result for the data as shown below was that most events wound up with ~0 charge energy due to the failed charge fits.
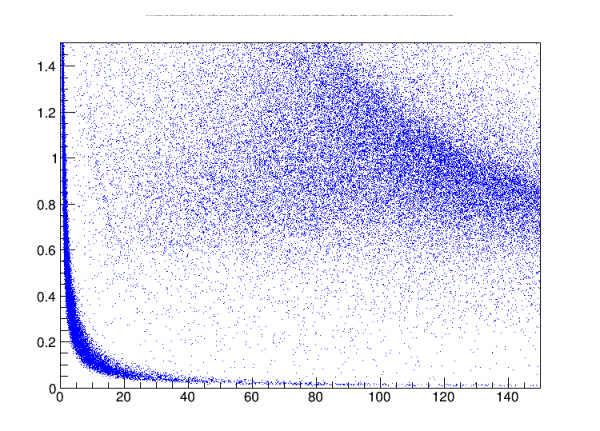
As of Feb 11 the processing has been fixed and data since the DAQ prepulse setting was updated is being reprocessed. Below are some plots from after the fix: this is (left) Cf data with a low-only trigger with the reduced trigger threshold (30 to 20) and (right) Cf data with the low-high trigger. In comparison with the older Cf data shown above you can see that the NR band continues to lower energies:
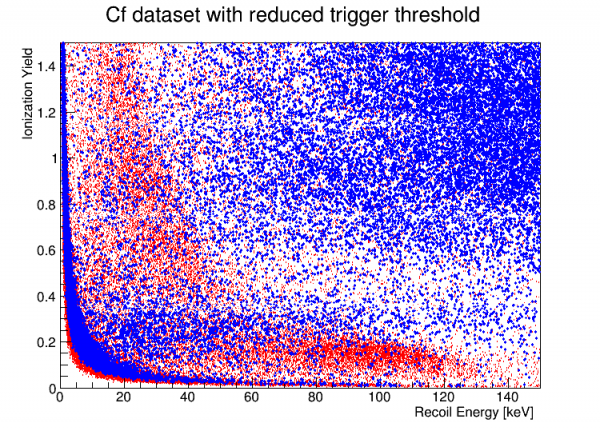 | 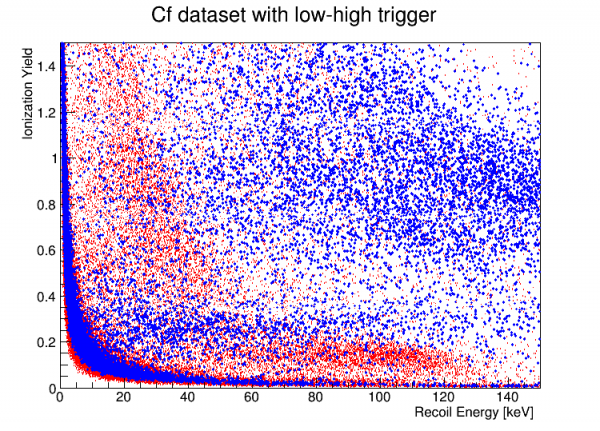 |
| Blue: charge symmetric events; Red: surface events | Blue: charge symmetric events; Red: surface events |
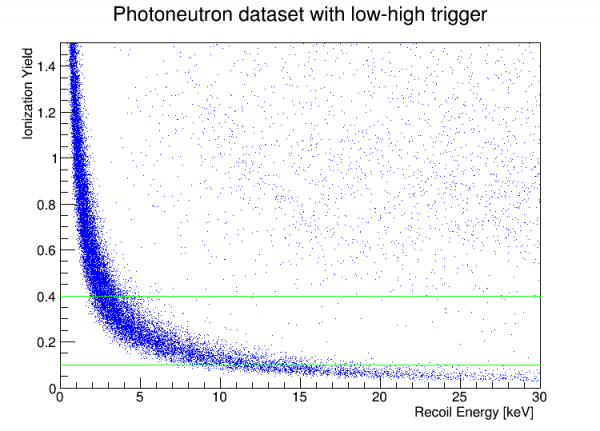
The plots below are from 35 series of Y-Be data over three nights, 2016 Feb 15-18. The green band is an approximate NR region based on a visual estimate from the Cf plots. There may be a hint of a neutron population below 10 keV but it is not very convincing.
 |  |
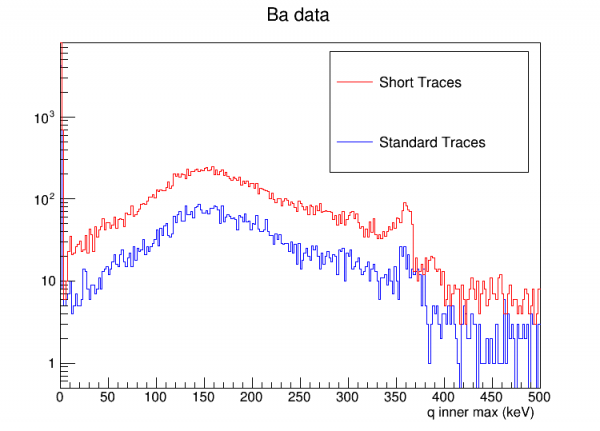
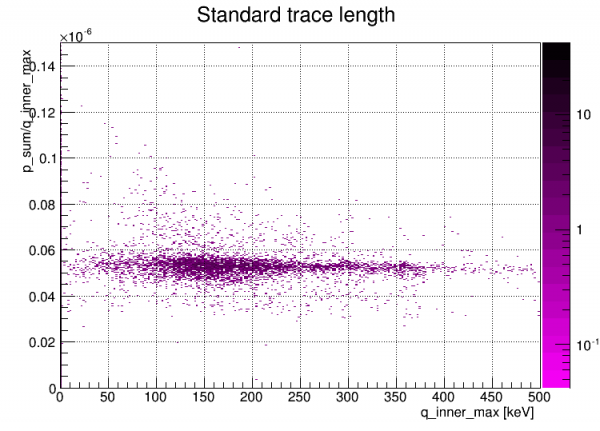
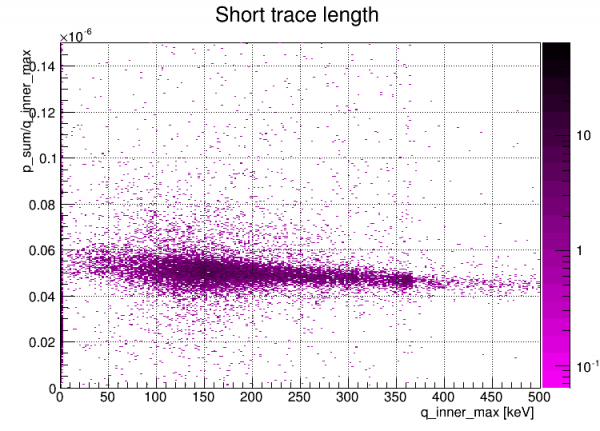
Short trace tests