Run 31
Summary
Setup
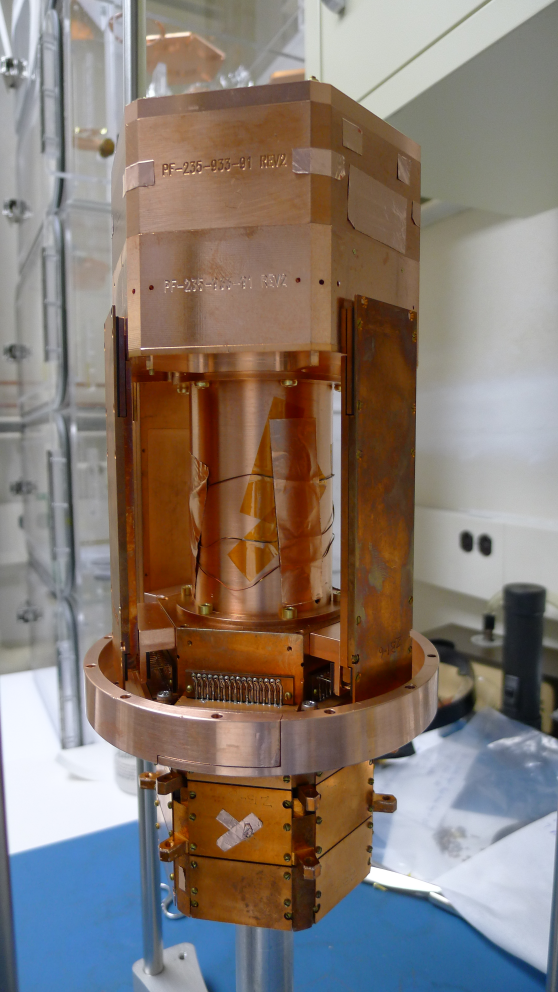
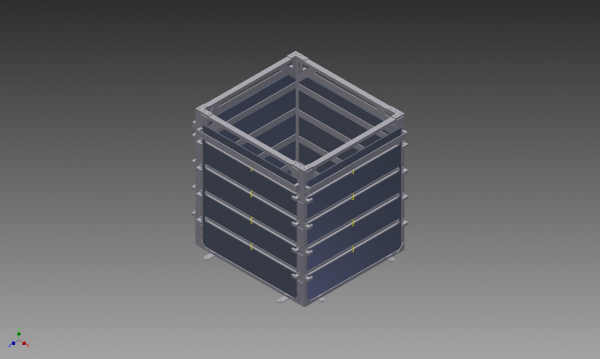
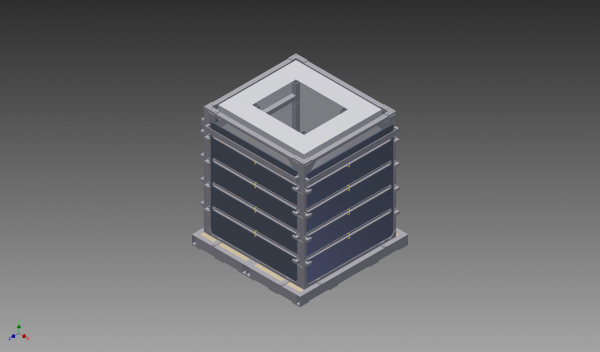
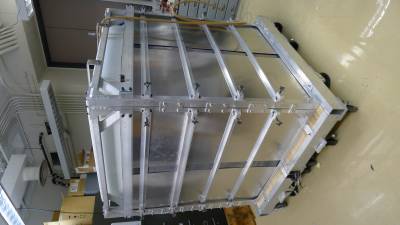
G103a
| Figure 1: G103a Packaged at SLAC. |
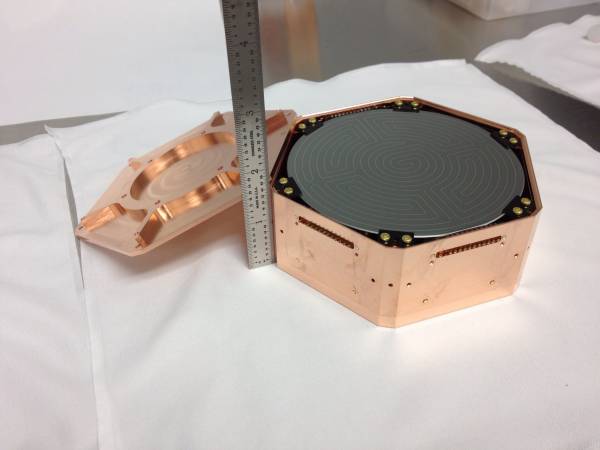 | 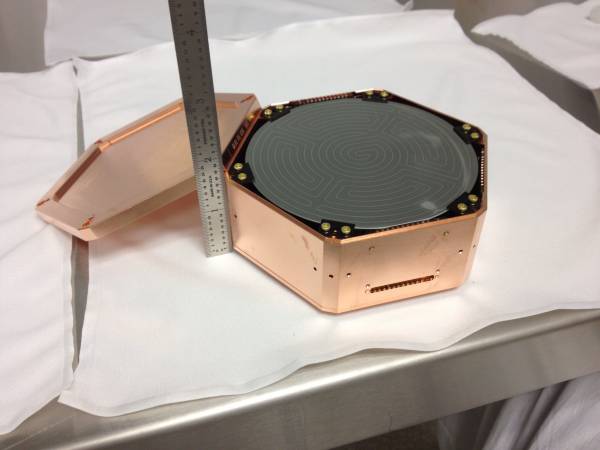 |
| Figure 2: G103a DIB Layout. |
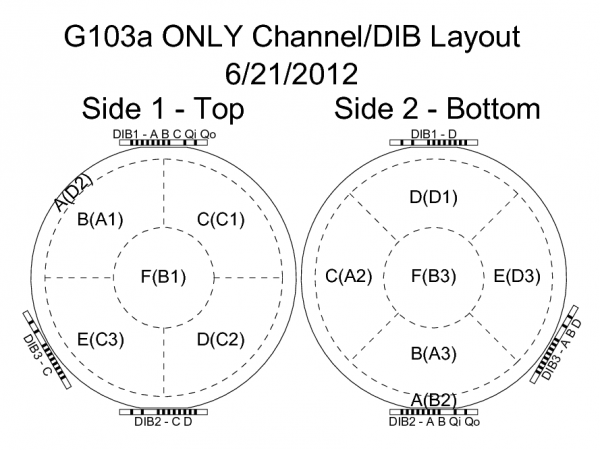 |
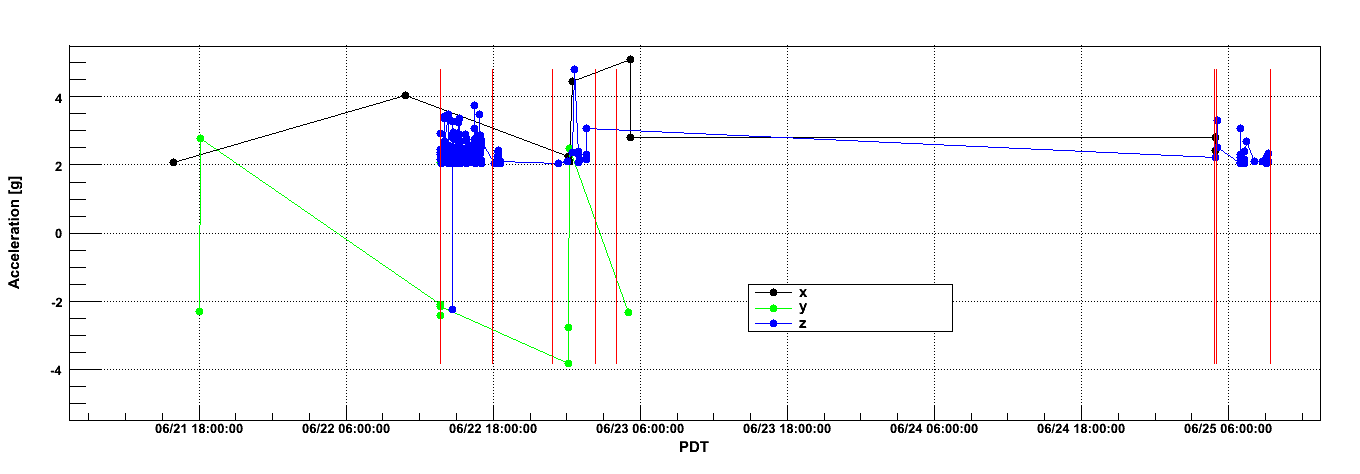
Accelerometer Data
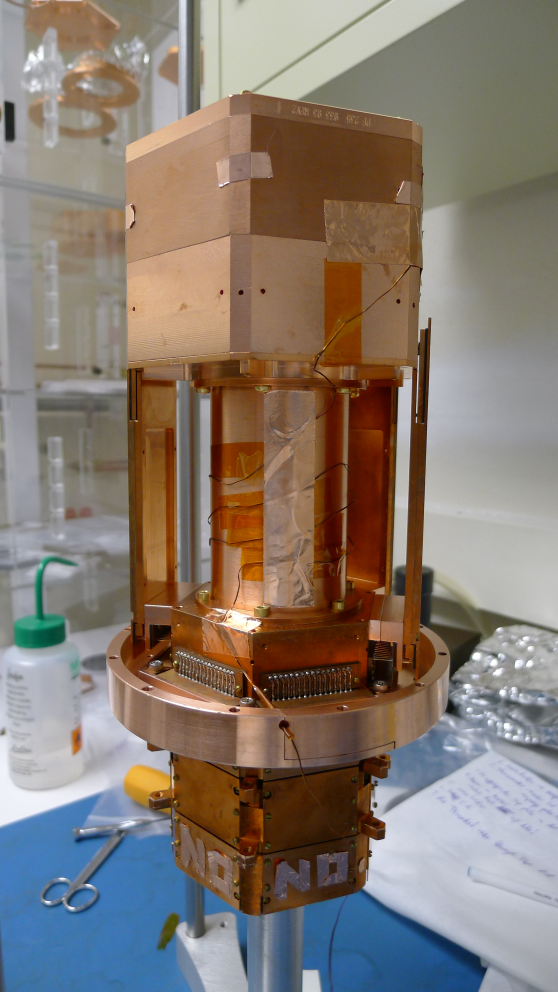
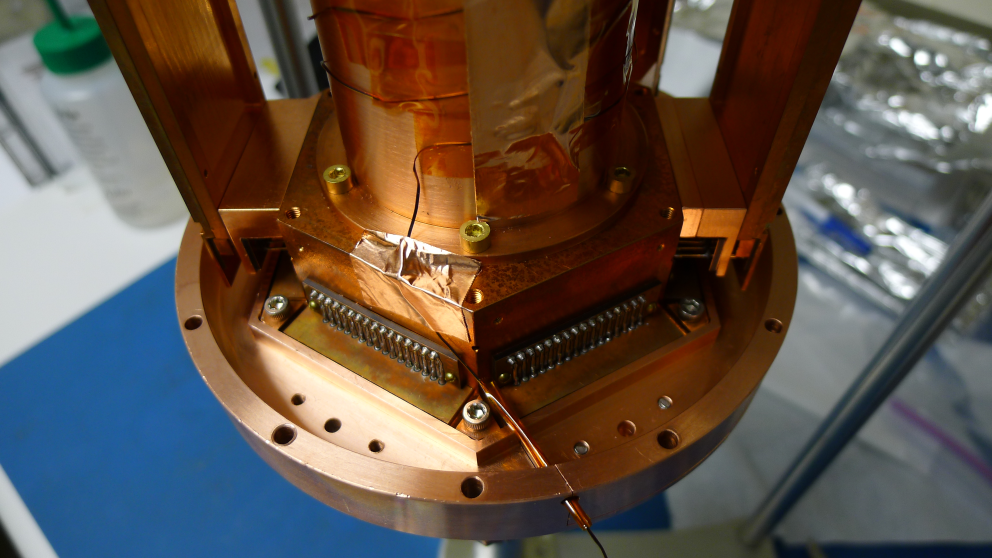
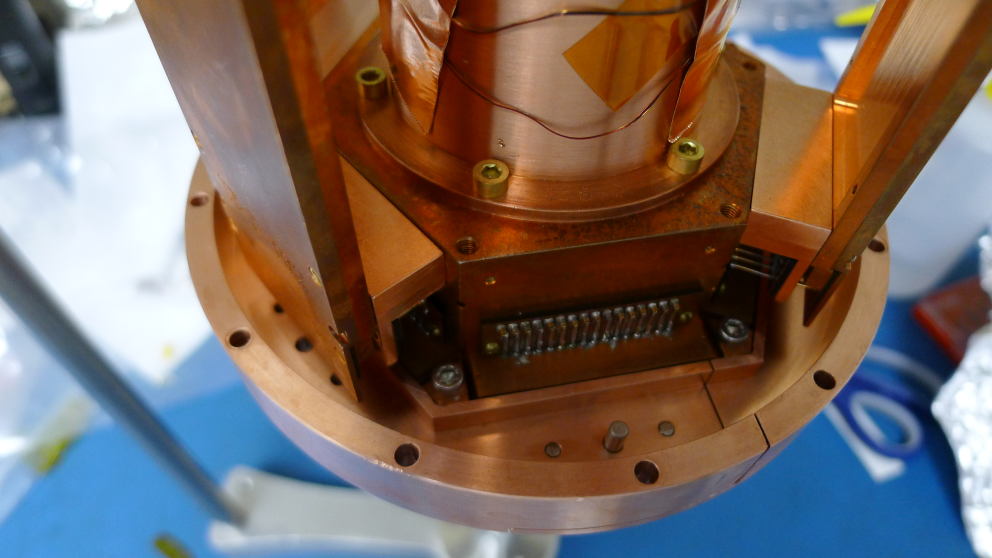
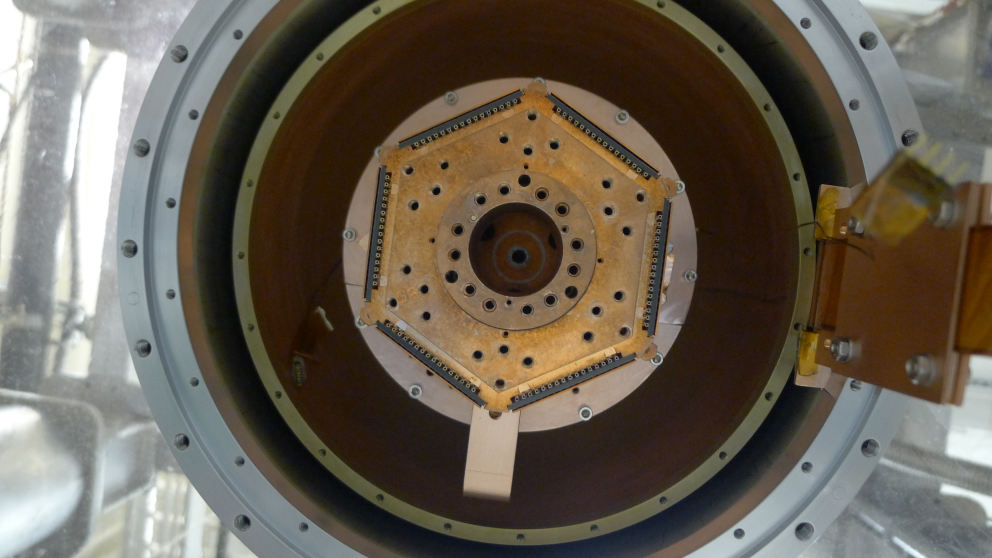
Tower Assembly & Electrical Setup
Electrical Problems
Short to ground on SCUHBA extender plug PCB
After assembling the tower and conducting a tower level continuity check, a short to ground was found. Through a process of elimination, the short was found on the new SCUHBA extender plug PCB. More specifically, pins 7 & 8 were shorted to ground. Running the soldering iron across the masks broke the connection to ground. The results of the tower level continuity checks can be found here (run diary page: 2012/06/29).
Shorts to ground when conducting electrical checks after tower installation
Found a number of shorts to ground after tower installation (QET bias, QET return and Qi & Qo bias). The shorts appeared to capacitive in nature, ie. the resistance increased in time when measuring with the multimeter. When conducting these checks, one appears to be charging a very large capacitor. Additionally, there is a potential drop across the shorted channels.
Stripline 20 and SQUET card ZC-28 have additional shorts between SQUID bias B, C & D to ground, and Feedback B & C to ground. This is probably not surprising, as SQUET card ZC-28 failed SQUID isolation tests as documented in SQUET elog entry 967.
While attempting to determine the source of these shorts, some pins on the ebox feedthroughs were found to have resistances of ∼100 MΩ to ground. Flooding the sockets with methanol, wiping with a paint brush and blow drying with nitrogen gas was found to be an effective way to increase the isolation of these pins from ground. Unfortunately, this did not appear to have an effect on the short.
The details of electrical checks at various temperatures during cool down are detailed here (run diary page: 2012/07/05). The resistances of the shorts are probably sufficiently high enough at liquid helium temperatures not to cause any problems during data acquisition.
Cryogenic Problems
Fixed mixing chamber thermometer, broke tower thermometer
During the upgrade and maintenance work, no fault was seen when conducting room temperature checks on the mixing chamber thermometer. However, as it is known that there is a fault at low temperatures, the connector was resoldered. This thermometer now works at base temperature.
During reassembly of the fridge, the insulation of wire leading to the tower thermometer was severed. As there is no replacement cable, a repair was attempted. Unfortunately, the repair appears to have been unsuccessful, and the tower thermometer is not readible. It is possible that during tower installation, the tower thermometer was not connected sufficiently well. However, it is more than likely that the problem lies further up and will require a new cable.
Therefore, our base temperature during this run is quoted from the mixing chamber thermometer. The tower thermometer is likely to be higher than this by a few mK. The actual difference in temperature is difficult to ascertain, as there has been no run when both of these thermometers were working.
Initial Leak
During the initial cooldown, two cryoleaks were found. A small leak of the order of 1E-6 mbar l/s was found in one of the indium seals towards the top of the IVC. This was slightly surprising as these flanges had been tested for leaks at liquid nitrogen temperatures specifically during Run 30. From past experience, it is possible to run for a short time with this level of a leak.
However, a larger leak of the order of 1E-2 mbar l/s was detected towards the end of nitrogen blow out. This indicated that the bottom IVC flange had a gross leak. This was also a little surprising as it was thought the reasons for the leak lay in the orientation of the flange. After removing the flange, it was found that too much vacuum grease had been used.
After tightening the flanges at the top of the IVC and replacing the indium seal at the bottom, the second cooldown was successful.
Poor Initial Base Temperature
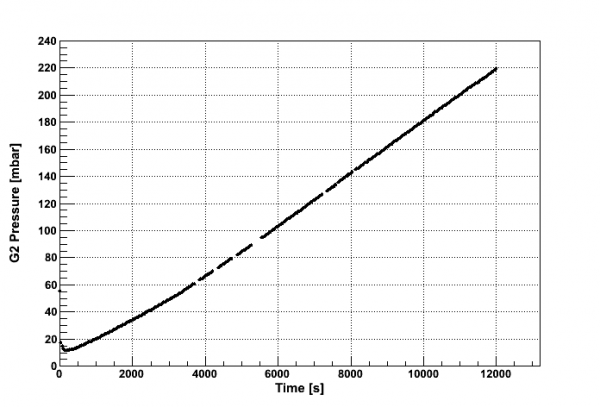
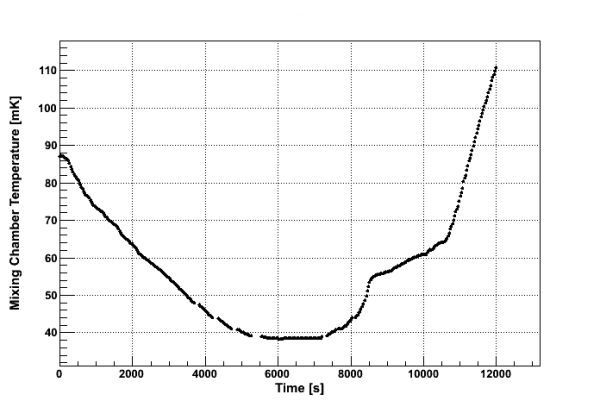
Unfortunately, a pretty high base temperature of 89 mK was reached. Cool down itself was rather slow. As stated above, this is from the mixing chamber thermometer, and the tower temperature is likely to be higher. Locking the DIB 1 SQUIDs and attempting to find the Tcs by increasing power to the mixing chamber heater indicated that the base temperature was above the critical temperature of the phonon channels.
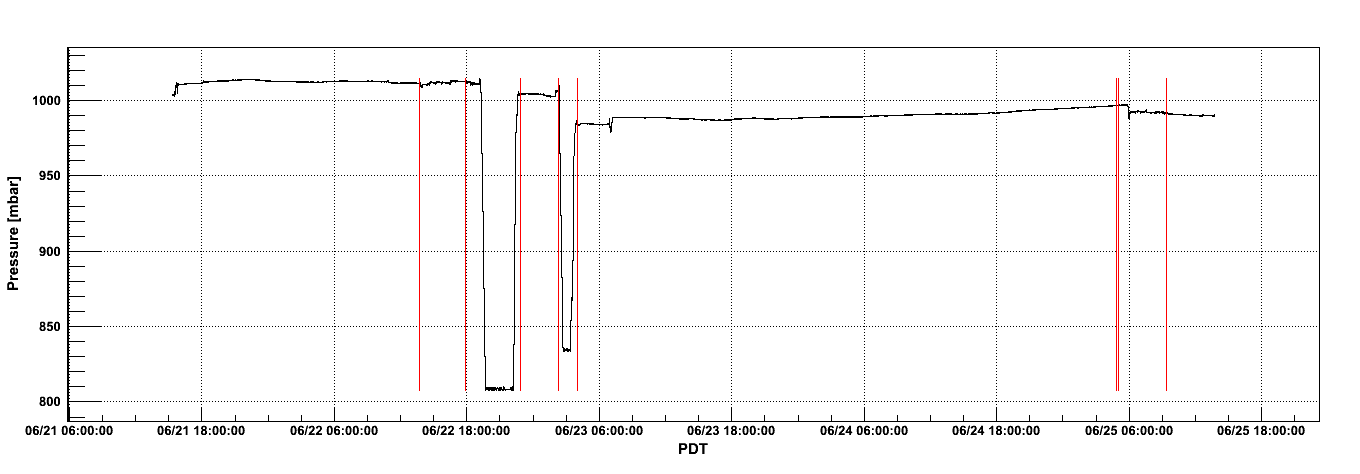
A single shot test was conducted to verify this, and to determine the cooling power of the fridge. The results are shown in Fig. 9. Tcs were found to be lie at around 80 mK, as detailed in 'Tc Measurements' section below.
| Figure 9: Dump Pressure (G2) and Mixing Chamber Temperature as a function of Time during Single-Shot. |
 |  |
As expected, the cooling power was pathetic. The mixture was extracted from the fridge in preparation for cleaning the cold traps. Puzzlingly, 592 mbar of mixture was recovered, yet 605 mbar was thrown into the fridge. No leak from the mixing chamber lines to the IVC was found during the throughput test at 77 K. Pressing on, the cold traps were cleaned and the mixture was recondensed. A lower base temperature of 63 mK was achieved.
Whether this had anything to do with cleaning the cold traps is unknown. The traps were dirty, but during this cycle some of the mixture has been left in the dump. The total proportion of mixture left in the dump is unknown, but can be determined during warm up. It is possible that this is the reason for the lower base temperature.
Initial Look at the Phonon Channels
Tc Measurements
Critical temperature measurements of the TESs are shown in Table 3. Measurements for DIB 1 channels were taken when cooling down during single shot test detailed above. This value is quoted as the fridge cooled at a slower rate, thus providing a more accurate reading (please see Fig. 9 for details). The Tcs for phonon channels on DIBs 2 & 3 were measured after a new, lower base temperature had been established. These measurements were performed by supplying power to the mixing chamber heater to gradually increase the temperature.
It should be noted that the Tcs in Table 3 were measured with the mixing chamber thermometer rather than the tower thermometer. As mentioned above, the tower thermometer was unavailable during this run. Therefore, the true Tcs may lie at higher temperatures than those determined.
| Table 3: Tc Measurements (using mixing chamber thermometer). |
| Side & Channel | DIB Channel | Tc [mK] ± 1 mK |
| Side 1 A | D2 | 76 |
| Side 1 B | A1 | 83 |
| Side 1 C | C1 | 84 |
| Side 1 D | C2 | no result* |
| Side 1 E | C3 | 85 |
| Side 1 F | B1 | 83 |
| Side 2 A | B2 | 86 |
| Side 2 B | A3 | 82 |
| Side 2 C | A2 | 78 |
| Side 2 D | D1 | 79 |
| Side 2 E | D3 | 81 |
| Side 2 F | B3 | 76 |
* Could not determine transition for Side 1 Channel D.
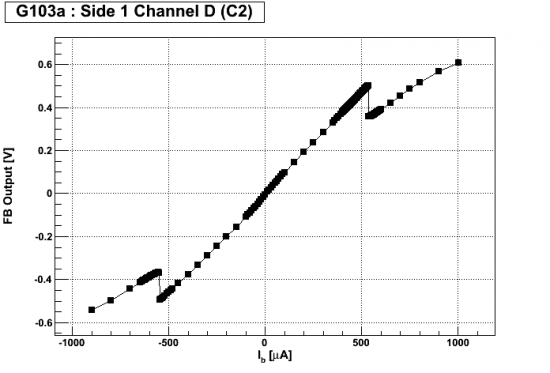
Problems with Side 1 Phonon Channel D (C2)
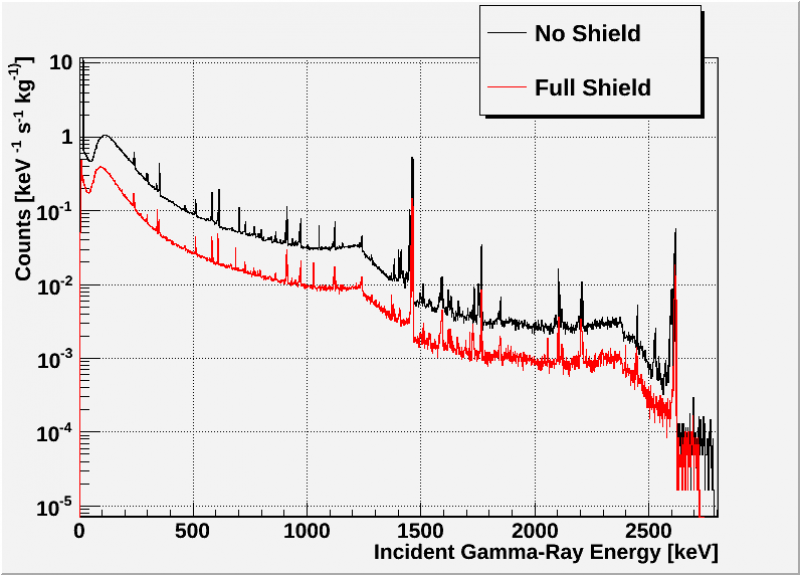
Gamma Shield
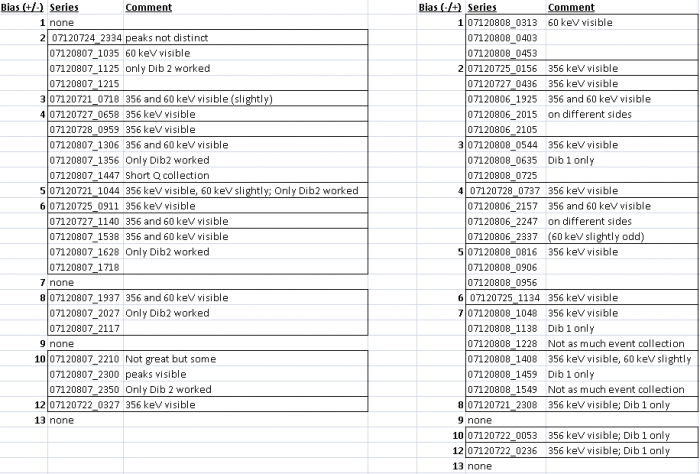
Charge Spectra Inventory
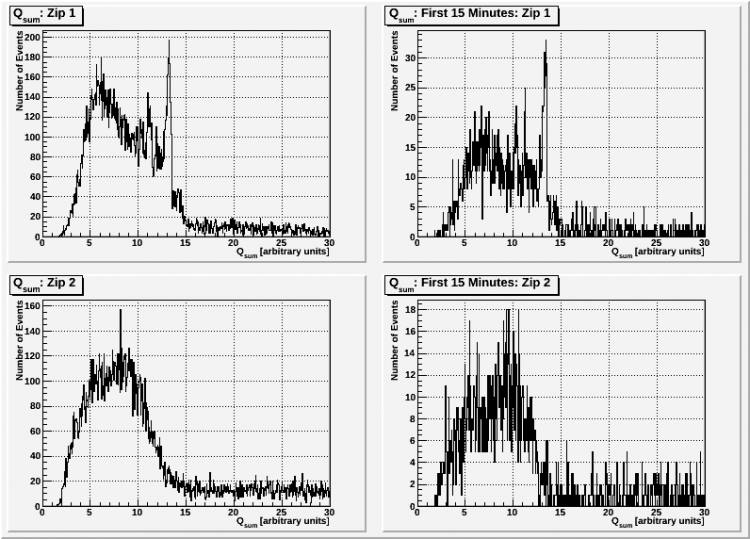
This is an inventory of all the charge spectra collected thus far that would be useful for analyses such as the seagull plot. This also informs us for which biases we are missing good quality data.
For series that are boxed together, those series are a half hour long. The series on 2012/07/21 and 2012/07/22 was also recorded over a half hour.
Charge Data Analysis
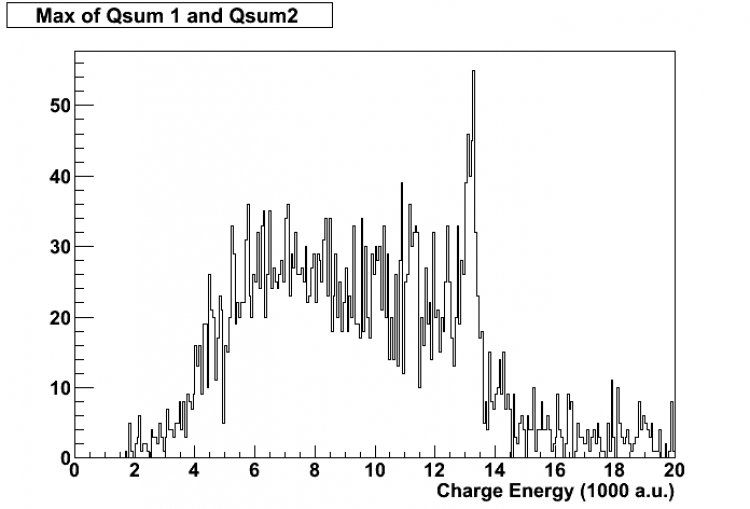
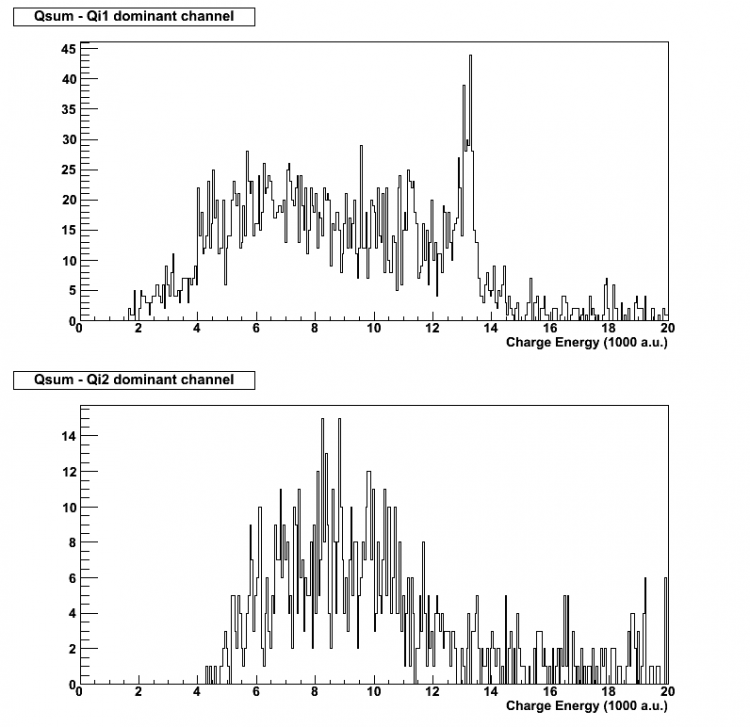
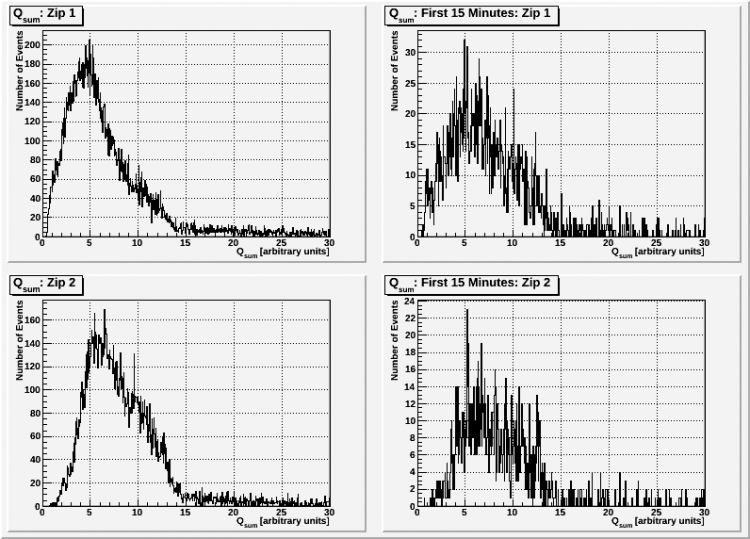
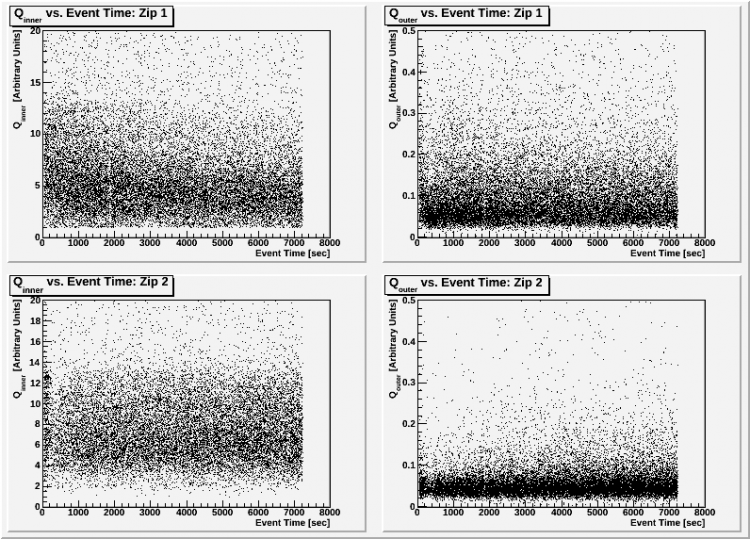
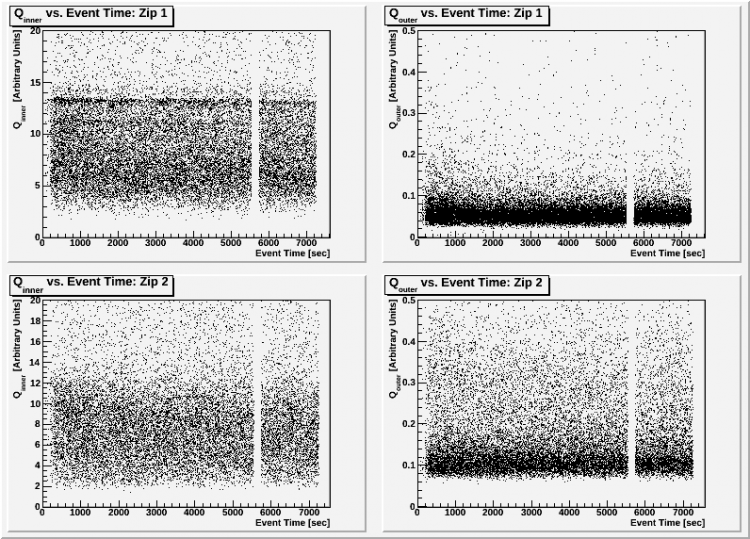
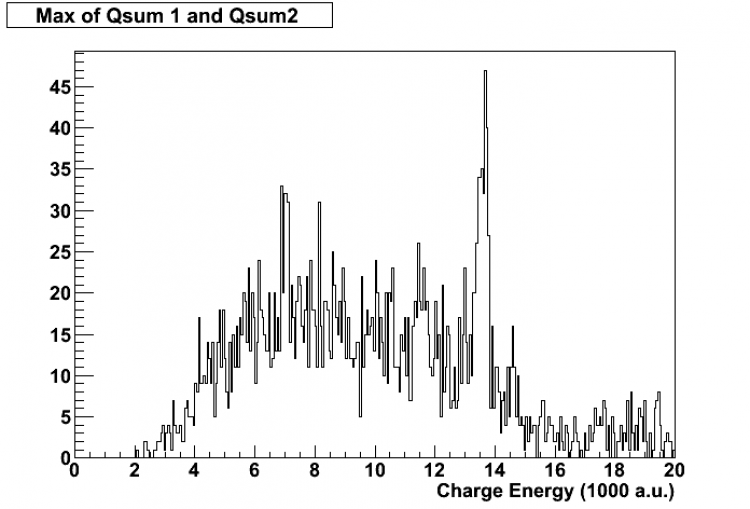
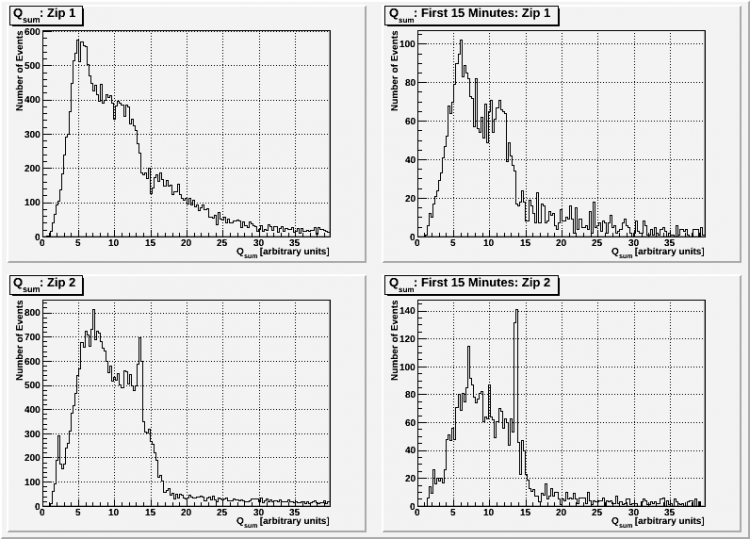
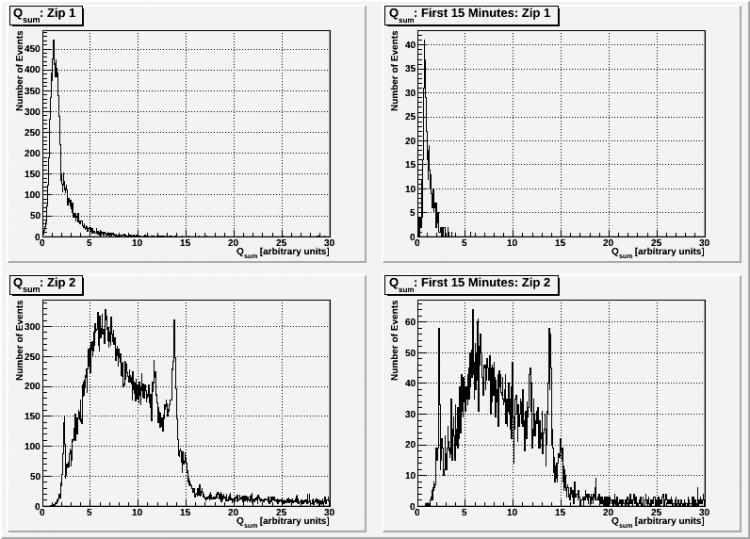
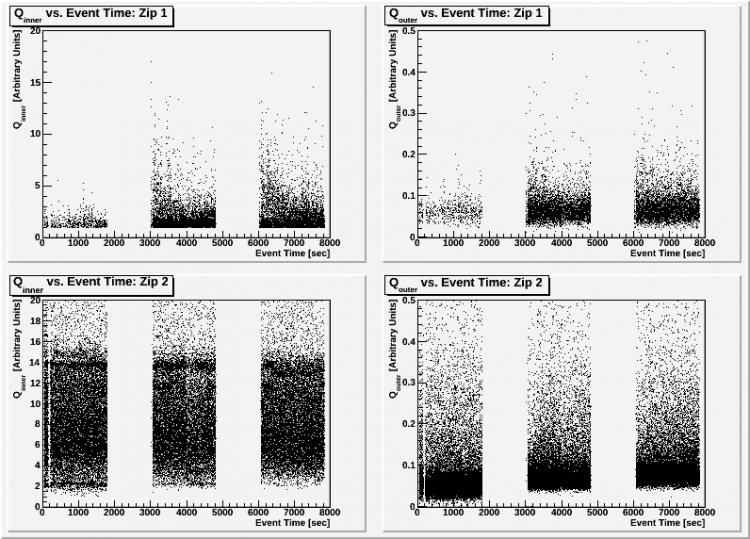
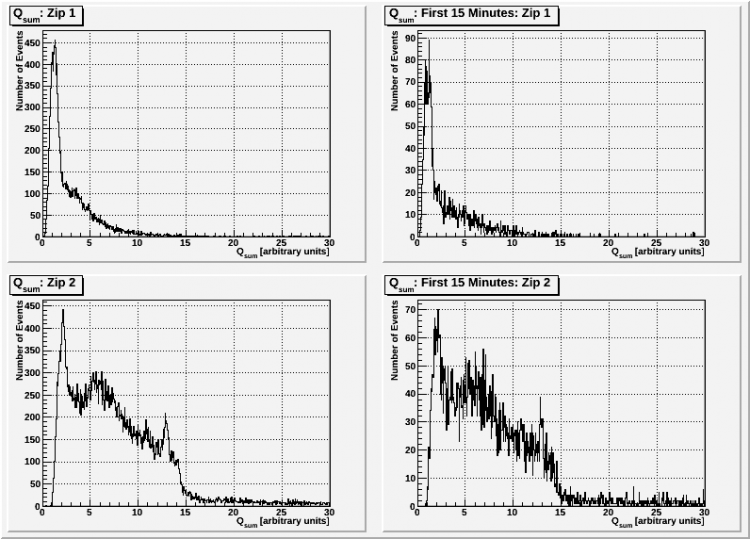
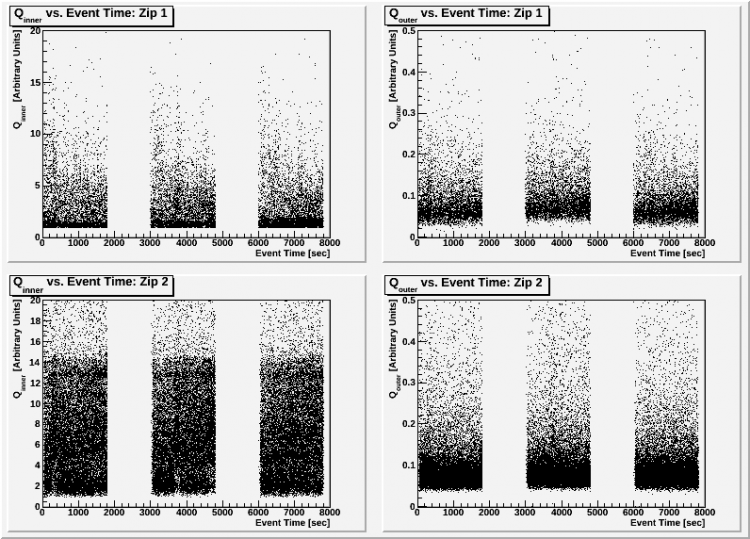
The data below is ordered by the bias the data series was taken at. If the bias is designated “ -/+ 2V ”, this means that Dib1 is negatively biased at 2V and Dib2 is positively biased at 2V. “ +/- 2V ” indicates that the Dibs have their polarity reversed. To know which board is associated with which Dib, the board configuration is written as well.
The biases shown below are (in order):
-/+ 2V
+/- 2V
-/+ 4V
+/- 4V
-/+ 6V
+/- 6V
+/- 8V
+/- 10V
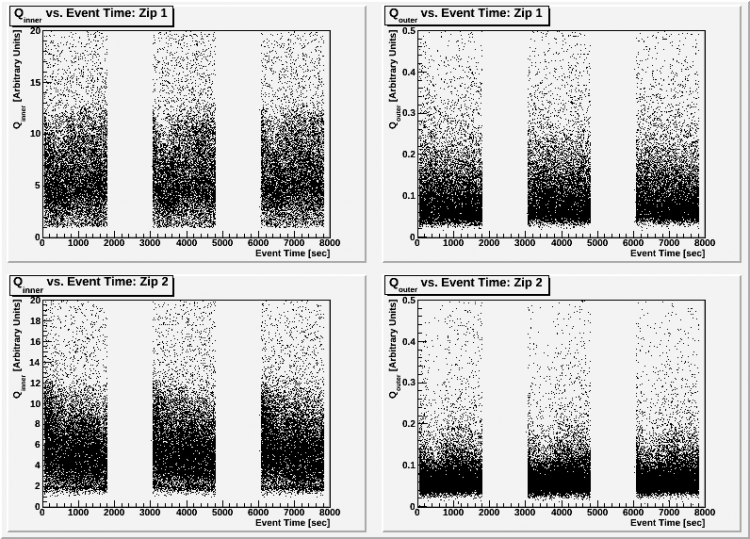
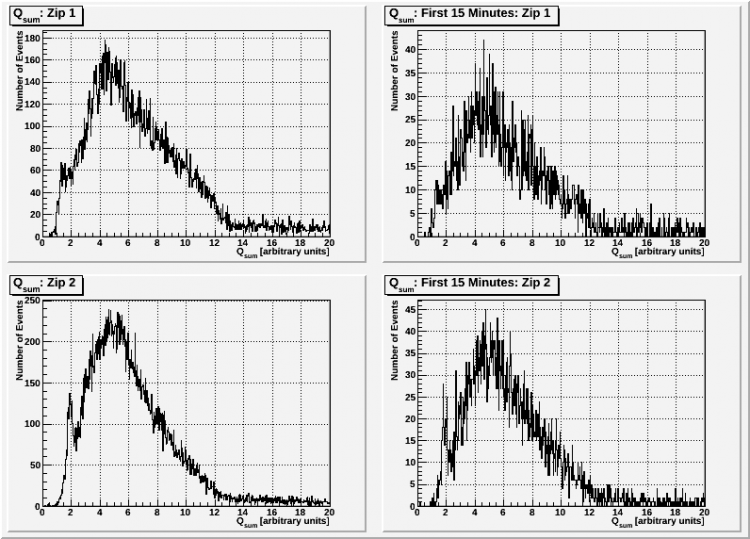
-/+ 1V
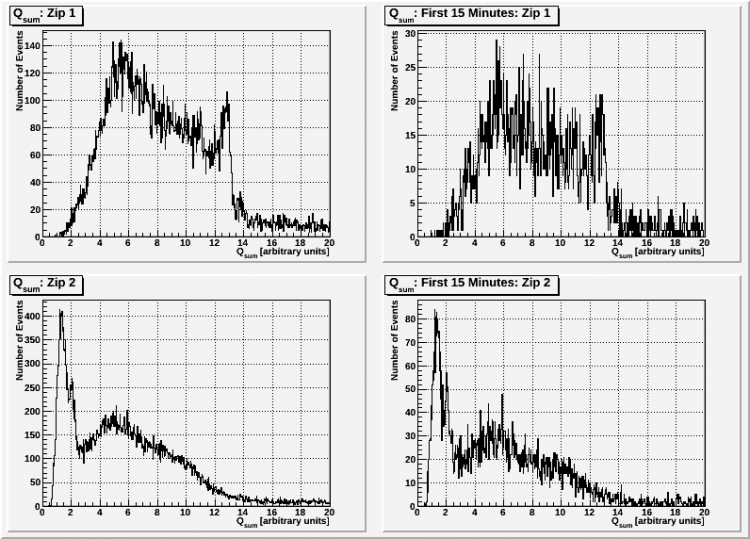
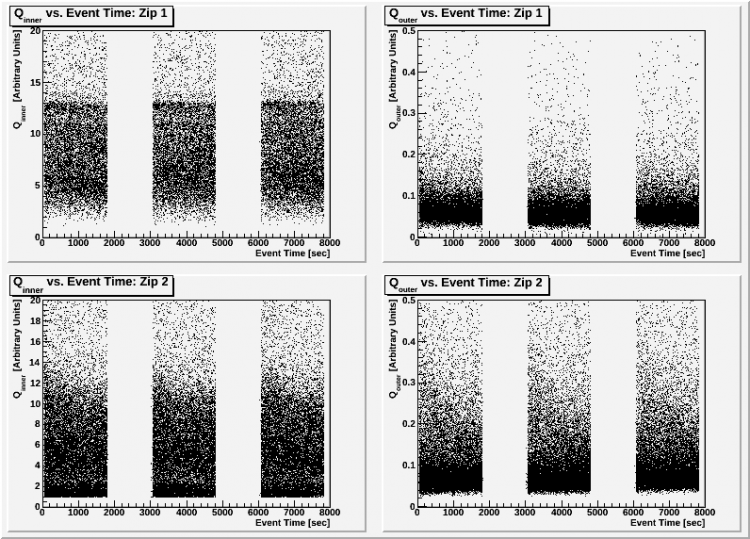
-/+ 3V
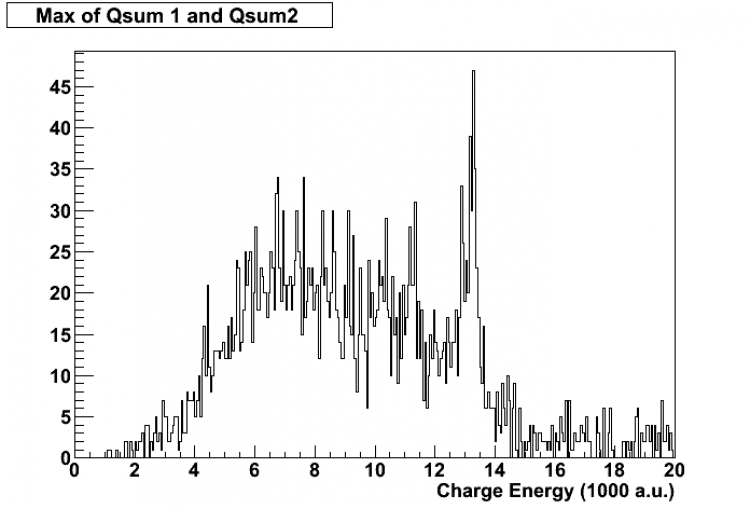
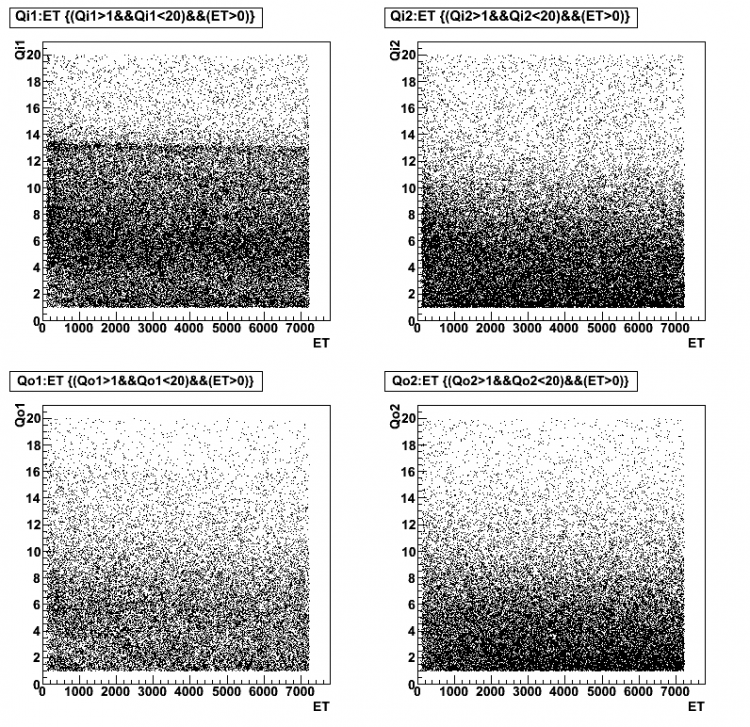
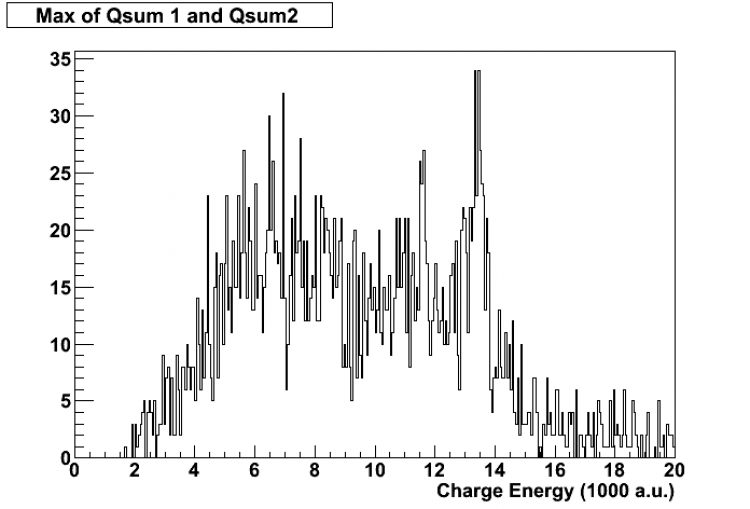
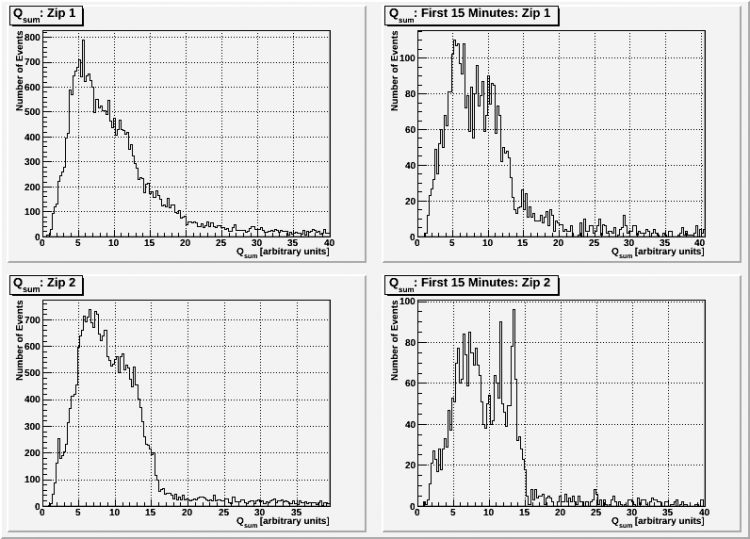
The spectra are not calibrated. We scaled up the charge energy by a factor of 1000. QIOFnoXvolts, etc represents the charge energy at the feedback capacitor.
| Bias | Series | Board Configuration | Trigger | Data Run Time Length |
| -/+ 2V | 07120727_0436 | Dib1=DCRC 33, Dib2= DCRC32, Dib3=DCRC31 | 12 phonon channels | 2 hours |
| Fig 1: First 15 Minutes | First 15 Minutes |
 |  |
| Bias | Series | Board Configuration | Trigger | Data Run Time Length |
| +/- 2V | 07120724_2334 | Dib1=DCRC 33, Dib2= DCRC32 | 12 phonon channels | 2 hours |
| Fig 2: Full Series/ First 15 Minutes | Charge vs. Time |
 |  |
| Bias | Series | Board Configuration | Trigger | Time Length |
| -/+ 4V | 07120728_0737 | Dib1=DCRC 33, Dib2= DCRC32, Dib3=DCRC31 | Phonon channels | 2 hours |
| Fig 3: First 15 minutes | Charge vs. Time |
 |  |
| Bias | Series | Board Configuration | Trigger | Time Length |
| +/- 4V | 07120727_0658 | Dib1=DCRC 33, Dib2= DCRC32, Dib3=DCRC31 | 12 phonon channels | 2 hours |
| Fig 4: First 15 Minutes | Full Series/ First 15 Minutes |
 |  |
| Bias | Series | Board Configuration | Trigger | Time Length |
| -/+ 6V | 07120725_1134 | Dib1=DCRC 33, Dib2= DCRC32 | Phonon channels | 2 hours |
| Fig 5: Full Series/ First 15 Minutes | Charge vs. Time |
 |  |
| Bias | Series | Board Configuration | Trigger | Time Length |
| +/- 6V | 07120727_1140 | Dib1=DCRC 33, Dib2= DCRC32, Dib3=DCRC31 | 12 phonon channels | 2 hours |
| Fig 6: First 15 Minutes | Full Series/ First 15 Minutes |
 |  |
Anything below is tentative
| Bias | Series | Board Configuration | Trigger | Time Length |
| +/- 8V | 07120807_1937
07120807_2027
07120807_2117 | Dib1=DCRC 33, Dib2= DCRC32 | Charge channels | 30 min/series |
| Fig 7: Full Series/ First 15 Minutes | Charge vs. Time |
 |  |
| Bias | Series | Board Configuration | Trigger | Time Length |
| +/- 10V | 07120807_2210
07120807_2300
07120807_2350 | Dib1=DCRC 33, Dib2= DCRC32 | Charge channels | 30 min/series |
| Fig 8: Full Series/ First 15 Minutes | Charge vs. Time |
 |  |
| Bias | Series | Board Configuration | Trigger | Time Length |
| -/+ 1V | 07120808_0313
07120808_0403
07120808_0453 | Dib1=DCRC 33, Dib2= DCRC32 | Charge channels | 30 min/series |
| Fig 9: Full Series/ First 15 Minutes | Charge vs. Time |
 |  |
| Bias | Series | Board Configuration | Trigger | Time Length |
| -/+ 3V | 07120808_0544
07120808_0635
07120808_0725 | Dib1=DCRC 33, Dib2= DCRC32 | Charge channels | 30 min/series |
| Fig 10: Full Series/ First 15 Minutes | Charge vs. Time |
 |  |
Phonon Pulses and Analysis
Tc Measurements as of 2012/08/08
| Tc of Phonon channels on DIB1/DCRC33 when MC T rising at 2mK/min |
| A | B | C | D |
| 81.46 | 81.84 | 82.3 | 74.3 |
| 82.1 | 83 | 82.9 | 75 |
| Temperature dropping at 2mK/min |
| 82.1 | 83.7 | 83 | 74.5 |
| 81.6 | 82 | 82.4 | |
| Tc of Phonon channels on DIB2/DCRC32 when MC T rising at 2mK/min |
| A | B | C | D |
| 77 | 86.2 | 79.5 | 73.6 |
| 78.3 | 87.1 | | 74.7 |
| Temperature dropping at 2mK/min |
| 78.7 | 87.2 | 80.1 | 74.5 |
| 76.9 | 86.4 | 79.9 | 73.5 |
| Tc of Phonon channels on DIB3/DCRC31 when MC T rising at 2mK/min |
| A | B | C | D |
| 79.7 | 75.6 | 84.5 | 79.7 |
| 81 | 76.5 | 85.2 | 81 |
| Temperature dropping at 2mK/min |
| 81 | 76.7 | 85.2 | 81.1 |
| 80.2 | 75.7 | 84.8 | 79.8 |
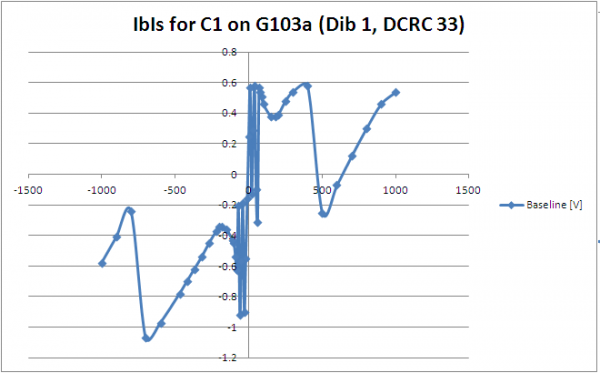
IbIs
Phonon Pulses from 12 Channels
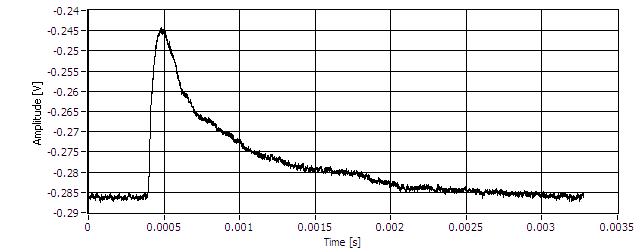
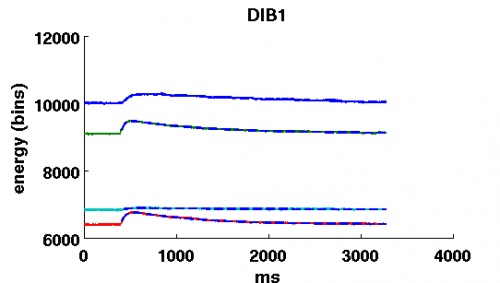
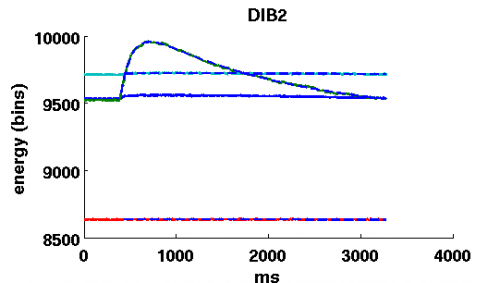
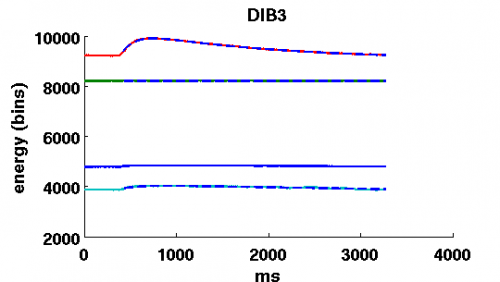
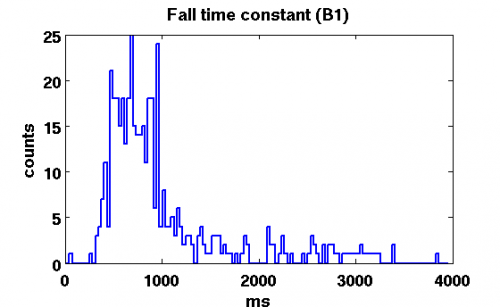
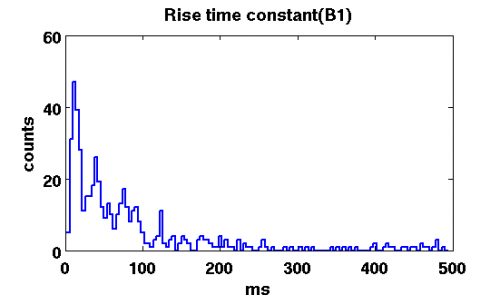
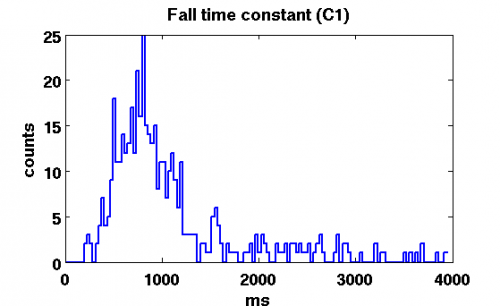
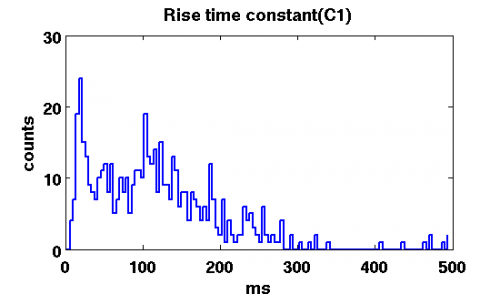
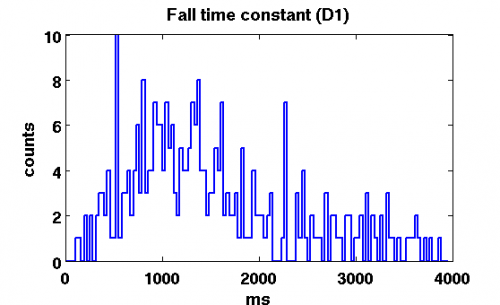
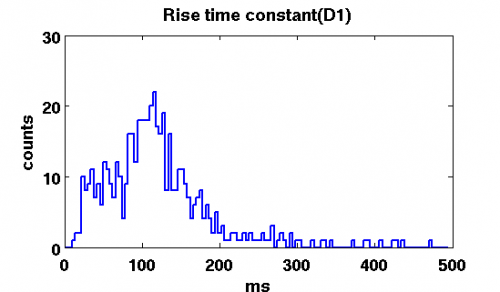
First thing to do is to plot raw pulses and fit a double exponential function to them. F=A * { Exp [ - ( t - t0 ) / t2 ] - Exp [ - ( t - t0 ) / t3 ] } + B.
Here A is the amplitude, t is time, t0 is the starting point of the pulse, t2 is the fall time constant, t3 is the rise time constant, B is the offset.
| Series:07120727_1140 |
   |
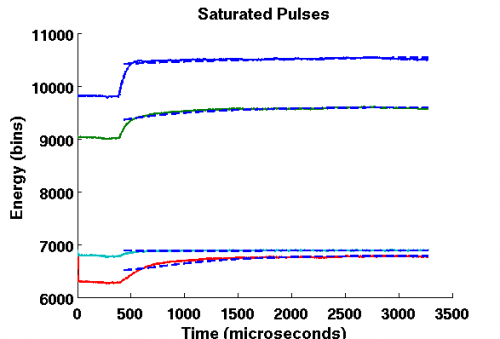 |
| Blue = channel A; Green = channel B; Red = channel C; Light Blue = channel D; ms=microseconds |
Chi^2 cuts
The next step is to select only good pulses. We look at Chi^2 distribution for all 12 channels. Below is an example of such distribution for one of the channels. (the only difference in the pictures is the scale)
| Different scale |
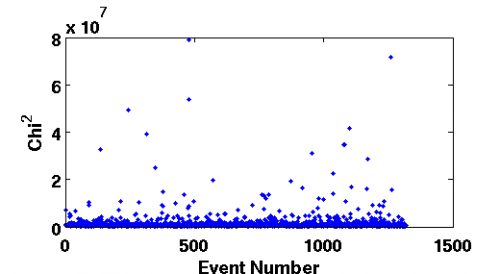 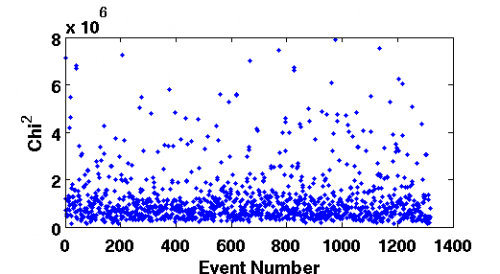 |
Histograms
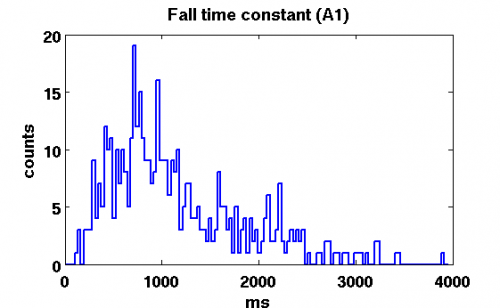 | 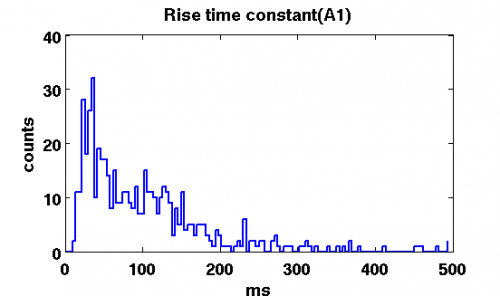 |
| ms=microseconds | ms=microseconds |
 |  |
| ms=microseconds | ms=microseconds |
 |  |
| ms=microseconds | ms=microseconds |
 |  |
| ms=microseconds | ms=microseconds |
|
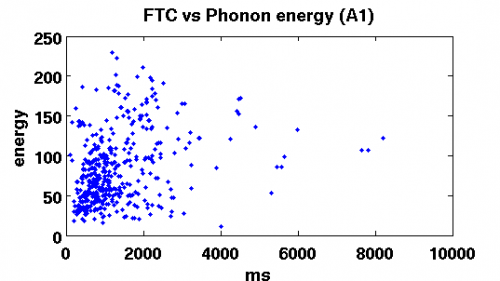
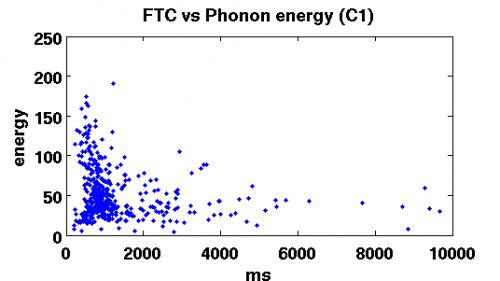
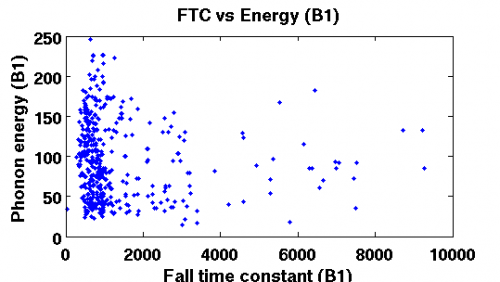
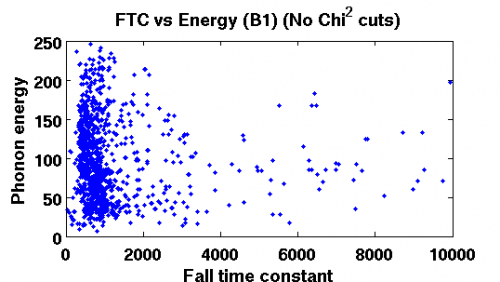
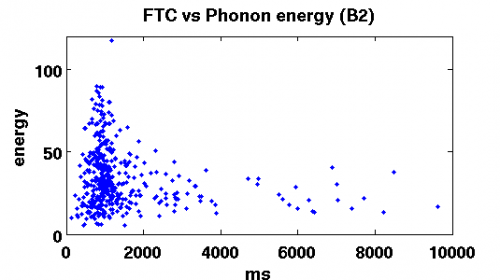
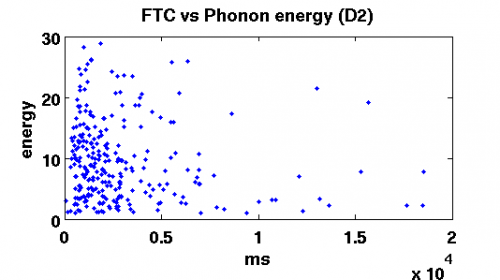
Fall Time Constant vs Phonon energy
Below are the plots of the Fall Time Constant vs Phonon energy deposited into the channel. There are two plots for channel B1(second picture clearly indicates independence of the FTC).
Not all channels are included. Others don't have enough statistics. The conclusion one can make is that FTC is independent of the energy.
| DIB1 |
  [image not archived: ftc_vs_energy_d1_.png] |
| ms=microseconds |
  |
| ms=microseconds |
| DIB2 |
  |
| ms=microseconds |
| DIB3 |
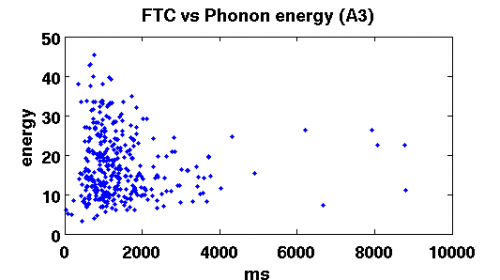 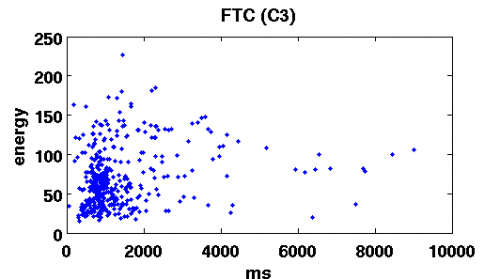 |
| ms=microseconds |
Rise Time Constant vs Phonon energy
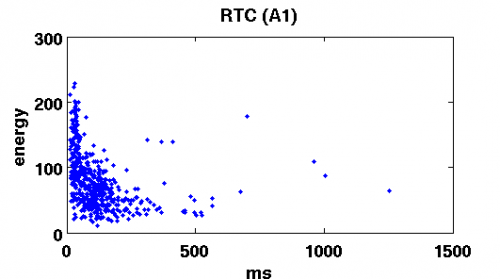
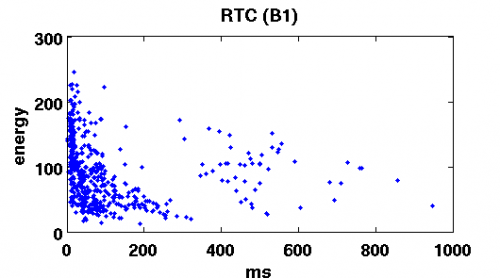
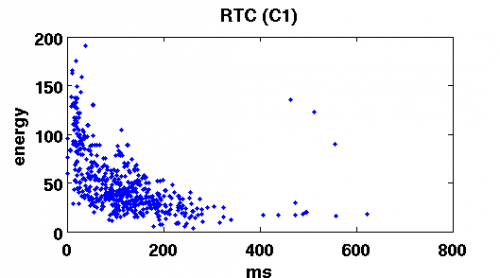
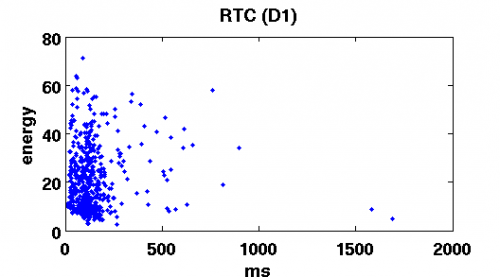
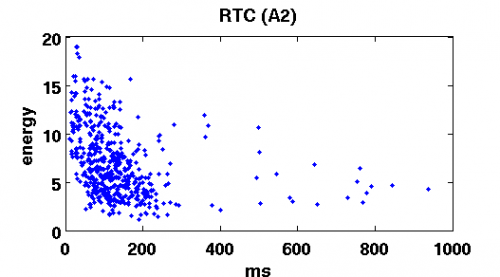
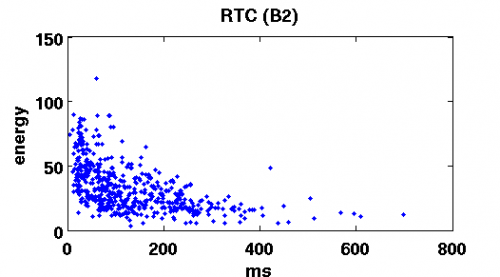
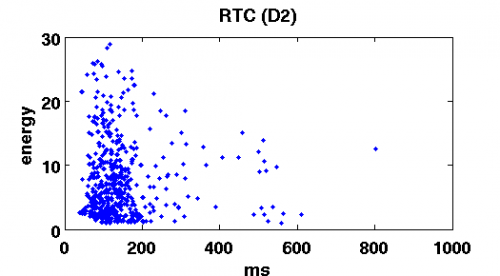
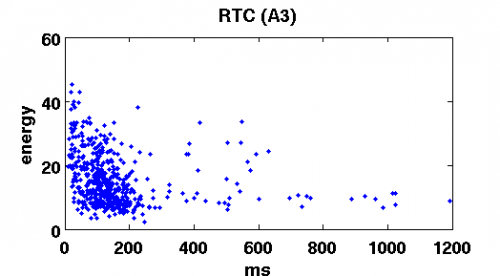
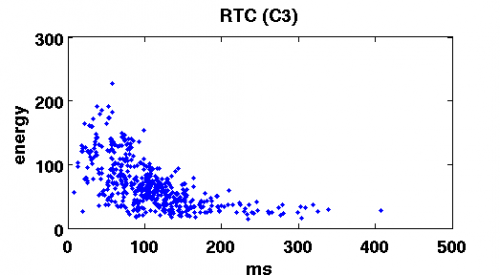
It's harder to make conclusions about the dependence of RTC on energy. Some of the plots show independence(D1,D2) while others show inverse relation. More investigation is needed.
As a comparison here is a similar G42 analysis