Table of Contents
K100 Run 1 - G8 (T1Z3)
A Summary by Vuk
1) we have recovered the old measurements of the normal resistances
2) performed Tc, Ic, IbIs measurements
3) Tc and Ic measurements significantly smaller than at Case
a) currently suspect that detectors are sitting at higher temperature than the mixing chamber
 - possibly because we don't have the 600mK stage on the tower
b) the other possibility (high-frequency currents heating the sensors) is most likely not true because:
 - we see no significant structure at high frequencies, either by vi (<600 kHz) or by the spectrum analyzer (<100 kHz) or by scope (<10 MHz).
 - the observed Vrms on the scope is roughly consistent with the vi spectrum.
4) Observed significant variation in Ic measurements depending on the method used.
5) Observed elevated high-frequency noise, >50 kHz, depending on the frontend gain.
6) Looked at the different grounding schemes, will probably continue working on this when we look at the charge channels in more detail.
7) Iterating with Jeter, Angie, and Lauren to fix the bugs in the DAQ code, would like to take data files that can be analyzed at Fermilab before we warm up. Then we can work on installing the data analysis package in our lab (after warmup) and test it on the same data file.
8) Remaining goals: look at charge channels noise, look at LED flashing/baking. If we can find a source quickly enough, maybe we'll try taking some data, but this is not likely.
9) Upgrades needed for next run:
- add thermometer on tower
- buy sources
- possibly add 600 mK Cu wires from the still, that we could use to sink the 600 mK stage of the tower
- install analysis package
Run Summary
1. Resistance checks of the SQUET card, tower, and detector are OK at room temperature and 77 K.
2. DCRC v1 is used. The oldest (2007/4/23) detector control vi and the latest detector readout vi are used. IbIs vi and analysis package are from Florida. The detector control vi were reported to have problems when zapping the SQUIDs by former users. But that's the one which works for me among the several versions I tested.
3. SQUID zapping and modulation: Phonon channels B and C have modulation depth ~ 500 mV; A and D have modulation depth ~ 250 mV. A and D seemed to have trapped magnetic flux in the SQUID judging from the modulation curve when increasing the SQUID bias from 0. We suspected that zapping didn't work well because a) zapping current didn't turn off at cooling, and b) DCRC has an offset of 35 uA on QET A biasing. Plan to zapping the SQUIDs with a battery directly from the breakout box.
4. Saw pulses on all phonon and charge channels.
5. Did IbIs measurement. The normal resistances agree with old measurement. Details see UMN IbIs.
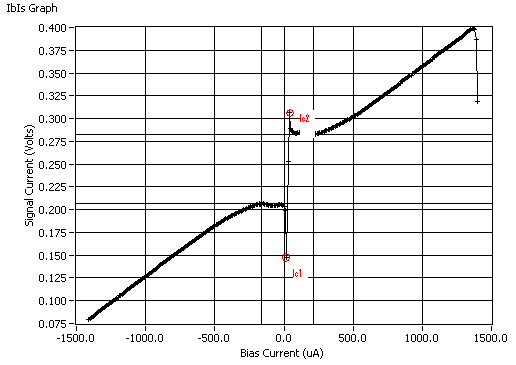
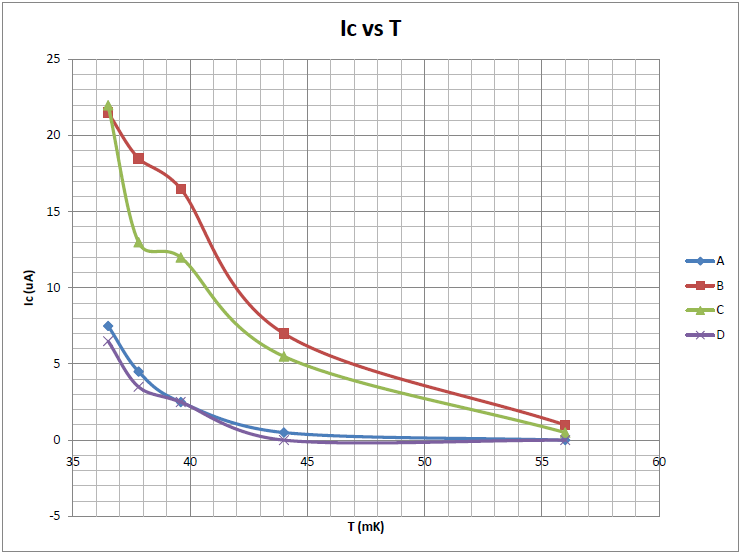
6. Measured critical current Ic as a function of temperature. Ic is defined as (|Ic1| + |Ic2|)/2, where Ic1 and Ic2 are two end points of the superconducting region on the IbIs curve. When the QET bias current is close to the phase transition point, there is possibility the transition is triggered by the pulse current or noise current superposed on the DC bias current. The measured DC critical current is likely to be smaller than the real value. While in AC measurement, there is time for the sensor to recover via electrothermal feedback; and the measured Ic are likely to be higher.
| Definition of the critical current: Ic = (|Ic1| + |Ic2|)/2 |
|---|
 |
| Ic vs. T by UMN |
|---|
 |
| Ic vs. T by CWRU |
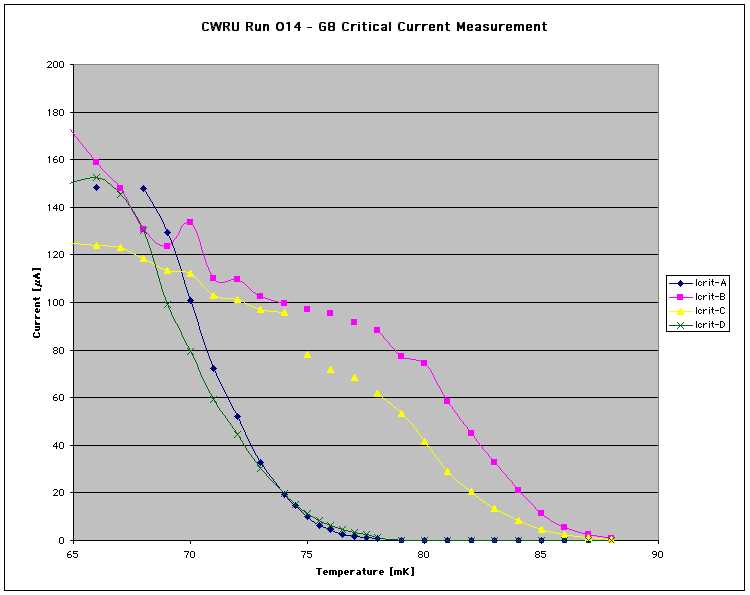 |
Note that the two Ic's ploted above should have different definitions. In the CWRU results , if you compare the Ic's from Ic vs T plot and the IbIs plot at a given temperature, you can see two different values. There is a need to standardize and precisely document the measurements. [image not archived: fixme.svg]
The Ic of sqB at 80 mK from the IbIs curve of CWRU is larger than that of UMN at base temperature. If that were true, sensors A and D should be normal at T > 80 mK based on the Ic vs T curve from CWRU. But we believe A and D are superconducting at base temperature. [image not archived: fixme.svg]
The Tc difference between AD and BC is roughly 10 mK at UMN and CWRU. The UMN detector is likely be warmer than the mixing chamber. But that can not explain all the discrepancies. A thermometer on the tower and a better heat sink to the 600 mK floor are hopefully to clear some of the clouds.
We also tried measuring Ic by sending a triangle wave down the QET bias line. First the DCRC QET bias output is zeroed with a HP337A multimeter. Then a triangle wave was sent down the QET bias line through a 1 kΩ resister soldered on the DCRC DB50 pins. The critical current in this case is defined as the maximum current without a permanent output triangle wave distortion. The result is shown in 20091130. Channel B is increased by a factor of 2; A and C are roughly the same; D became smaller, it was not superconducting even at a 1 mVpp excitation.
7. Tried different fridge grounding scheme. The environmental noise peaks at 55.5 kHz and 68.75 kHz can penetrate the shielding and show up in the phonon output. Noise source is not identified yet. Details are in 20091202.
8. Tested the effect of the frontend gain on the phonon noise. Details are in 20091201.
9. DAQ data format problem is sloved with the help of Angie, Jeter, and Lauren.
Setup
| Detector | G8 (former T1Z3) |
|---|---|
| Tower | T1 from Soudan |
| Face | #2 |
| Side coax | ? (the shortest one) |
| SQUET | ZC15 |
| Stripline | #20 |
| Readout | DCRC v1 |
| Software | SCDMS_DetectorControl.vi, 20070423 version SCDMS_DetectorReadout.vi, 20091202 version DCRCModular.vi (→DAQ→Ib-Is), DCRC_RevA_Modular |
| Cryostat | Oxford Instruments Kelvinox 100 dilution fridge with μ-metal shield. |
The tower and detector are mounted in the same way as UCB does. There is a calibrated RuOx thermometer on the mixing chamber but no thermometers on the tower.
Resistance check
SQUET resistance check
| Purpose: The purpose of this test is to verify completed SQUET revC assembly connections. | ||||||
| Procedure: | ||||||
| 1. Measure resistance between P1 and P4 connectors. Record value where required, and mark “checked” column if within acceptable range. | ||||||
| 2. Perform diode checks using the diode test setting of the DMM. Use lead polarity specified. | ||||||
| 3. Check resistances to chassis GND (P1 pin 51). | ||||||
| 4. If all “OK?” boxes are not checked assembly requires troubleshooting and/or repair | ||||||
| P1 Pinout: | 1————13 | Date: 10/20/2009 | ||||
| 14———25 | Name: V.M. and J.Z. | |||||
| 26———–38 | Comment: Fluke 177 DMM is used. R max range 50MOhm | |||||
| 39———50 | ||||||
| P4 Pinout: | 1————-16 | |||||
| SIGNAL | P1 | P4 | acceptable range, ohms | value | OK? | |
|---|---|---|---|---|---|---|
| Feedback B | 14 to 1 | 15K to 25K | 18.7 | Y | ||
| QET bias A | 15 to 2,10,11,12,13 | 15 to 25 | 21 | Y | ||
| SQUID bias A | 16 to 3 | 2.5K to 4.5K | 5 | Y | ||
| Feedback D | 17 to 5 | 15K to 25K | 17.5 | Y | ||
| QET bias C | 18 to 4,7,8,9 | 15 to 25 | 20 | Y | ||
| SQUID bias C | 19 to 6 | 2.5K to 4.5K | 4.2 | Y | ||
| QET bias B | 26 to 47,48,49,50 | 15 to 25 | 20 | Y | ||
| SQUID bias B | 27 to 39 | 2.5K to 4.5K | 4.6 | Y | ||
| Feedback A | 28 to 41 | 15K to 25K | 21 | Y | ||
| QET bias D | 29 to 40,43,45,46 | 15 to 25 | 18 | Y | ||
| SQUID bias D | 30 to 42 | 2.5K to 4.5K | 4.1 | Y | ||
| Feedback C | 31 to 44 | 15K to 25K | 17.8 | Y | ||
| QET A | 1 to 2 | 10K to 25K | 14.8 | Y | ||
| QET B | 3 to 4 | 10K to 25K | 13.7 | Y | ||
| QET C | 5 to 6 | 10K to 25K | 12.9 | Y | ||
| QET D | 7 to 8 | 10K to 25K | 12.9 | Y | ||
| LED 1 | 32 | 9 | <0.5 | 0.4 | Y | |
| LED 2 | 20 | 10 | <0.5 | 0.3 | Y | |
| Qo bias | 21 | 11 | <0.5 | 0.4 | Y | |
| Qo feedback | 23 | 13 | <0.5 | 0.4 | Y | |
| Qi bias | 24 | 14 | <0.5 | 0.4 | Y | |
| FET Heater+/- | 34 to 35 | 980 to 1020 | 1 | Y | ||
| Qi feedback | 38 | 16 | <0.5 | 0.4 | Y | |
| FET Temp+ | 37(+) to 35(-) | 4M to 5M | 0.9/0.6V | ? | ||
| Qo drain | 22 (-) | 12 (+) | 5M to 7M | 1.1/0.7V | Y | |
| Qo source | 33(-) | 12(+) | 5M to 7M | 1.1/0.7V | Y | |
| Qi source | 36(-) | 15(+) | 5M to 7M | 1.1/0.7V | Y | |
| Qi drain | 25(-) | 15(+) | 5M to 7M | 1.1/0.7V | Y | |
| SQUID Isolation Checks: | ||||||
| A FB-QETbias | 28 to 16 | 100M to infinity | Open | Y | ||
| A FB-SQUIDbias | 28 to 15 | 100M to infinity | Open | Y | ||
| A Qetbias-SQUIDbias | 15 to 16 | 100M to infinity | Open | Y | ||
| B FB-QETbias | 14 to 27 | 100M to infinity | Open | Y | ||
| B FB-SQUIDbias | 14 to 26 | 100M to infinity | Open | Y | ||
| B Qetbias-SQUIDbias | 26 to 27 | 100M to infinity | Open | Y | ||
| C FB-QETbias | 31 to 18 | 100M to infinity | Open | Y | ||
| C FB-SQUIDbias | 31 to 19 | 100M to infinity | Open | Y | ||
| C Qetbias-SQUIDbias | 18 to 19 | 100M to infinity | Open | Y | ||
| D FB-QETbias | 17 to 29 | 100M to infinity | Open | Y | ||
| D FB-SQUIDbias | 17 to 30 | 100M to infinity | Open | Y | ||
| D Qetbias-SQUIDbias | 29 to 30 | 100M to infinity | Open | Y | ||
Tower resistance check
| Detector | G8 | |||
|---|---|---|---|---|
| side coax | date/who: | 10/20/09 | VM&JZ | |
| face | 2 | |||
| +lead | - lead | signal | typical | measured |
| 1 | 2 | QET A | 100 to 200 | 107 |
| 2 | 4 | QETA-B | 100 to 200 | 116 |
| 3 | 4 | QET B | 100 to 200 | 108 |
| 4 | 6 | QETB-C | 100 to 200 | 116 |
| 5 | 6 | QET C | 100 to 200 | 111 |
| 6 | 8 | QETC-D | 100 to 200 | 111 |
| 7 | 8 | QET D | 100 to 200 | 101 |
| 2 | 8 | QETA-D | 100 to 200 | 119 |
| chassis | 9 | LED1 Rforward | 8M to 9M | 1.3 |
| chassis | 10 | LED2 Rforward | 8M to 9M | 1.4 |
| chassis | 9 | LED1 Vforward | 1.0V to 1.1V | 1.1 |
| chassis | 10 | LED2 Vforward | 1.0V to 1.1V | 1.1 |
| 9 | chassis | LED1 Rreverse | <1nS | OK |
| 10 | chassis | LED2 Rreverse | <1nS | OK |
| 1 | 11 | Qo Rbias | 24nS to 26nS | 38MOhm |
| 12 | 11 | Qo C coupling | <1nS | OK |
| 12 | 13 | Qo Rfeedback | 24nS to 26nS | 38MOhm |
| 1 | 14 | Qi Rbias | 24nS to 26nS | 38MOhm |
| 15 | 14 | Qi C coupling | <1nS | OK |
| 15 | 16 | Qi Rfeedback | 24nS to 26nS | 38MOhm |
Cooldown resistance check
| Cooldown checkout sheet (rev C SQUET) | ||||||||
|---|---|---|---|---|---|---|---|---|
| Detector: | G8 | BH: | ||||||
| SC: | RT | LN | ||||||
| Face: | Date | 2009-10-20 | Date | 2009-11-01 | ||||
| SQUET: | Who | VM&JZ | Who | JZ | ||||
| Signal | Pos. lead | Gnd lead | Nominal | Actual | Chassis | Nominal | Actual | Chassis |
| (Gnd lead) | (Gnd lead) | |||||||
| Nominal: | Nominal: | |||||||
| < 0.1 nS | < 0.1 nS | |||||||
| Phonon | ||||||||
| SQUID bias A/Ret | 4 | 20 | 3 - 5 k | 5 | 1 - 2 k | 2 | Y | |
| SQUID bias B/Ret | 19 | 34 | 4.6 | 1.7 | Y | |||
| SQUID bias C/Ret | 8 | 24 | 4.2 | 1.5 | Y | |||
| SQUID bias D/Ret | 23 | 39 | 4.1 | 1.5 | Y | |||
| Feedback A/Ret | 37 | 21 | 15 - 25 k | 21.1 | 9 - 13 k | 8.4 | Y | |
| Feedback B/Ret | 2 | 18 | 18.8 | 7.4 | Y | |||
| Feedback C/Ret | 41 | 25 | 17.7 | 7 | Y | |||
| Feedback D/Ret | 22 | 6 | 17.5 | 6.8 | Y | |||
| QET A/Ret | 3 | 1, 13, 14, 17, 32 | 60 - 80 | 70 | 30 - 40 | 36, 36, 35, 35 | Y | |
| QET B/Ret | 35 | 29, 33, 47, 48 | `` | 70 | `` | 35, 35, 35, 35 | Y | |
| QET C/Ret | 7 | 5, 9, 10, 28 | `` | 68 | `` | 34, 34, 27, 34 | Y | |
| QET D/Ret | 38 | 36, 40, 43, 44 | `` | 68 | `` | 35 | Y | |
| Charge | ||||||||
| FET heater +/- | 45 | 46 | 1.0 - 1.1 k | 1.1 | 1.0 - 1.1 k | 1.1 | Y | |
| Qi bias/QET Ret | 15 | 24 - 26 nS | 38MOhm | < 1 nS | Open | Y | ||
| Qo bias/QET Ret | 11 | `` | 38MOhm | `` | Open | Y | ||
| Qi feedback/Drain/Source | 50 | 16, 31 | 15 - 17 nS | 43, 43 MOhm | 6 - 8 nS | 49, 49 MOhm | Y | |
| Qo feedback/Drain/Source | 30 | 12, 27 | `` | 43, 43 MOhm | `` | 49, 49 MOhm | Y | |
| Qi drain | 16 | chassis | < 0.1 nS | Open | < 0.1 nS | Open | Y | |
| Qo drain | 12 | chassis | `` | Open | `` | Open | Y | |
| Qi source | 31 | chassis | `` | Open | `` | Open | Y | |
| Qo source | 27 | chassis | `` | Open | `` | Open | Y | |
| FET Tsense +/FET heater- | 49 | 46 | 0.6 - 0.7 V | 0.71 | 0.9 - 1.0 V | 1.1 | Y | |
| LED 1 | chassis | 42 | 1.0 - 1.1 V | 1.13 | – | 1.2 - 1.5 V | 1.9 | – |
| LED 2 | chassis | 26 | 1.13 | – | 2 | – | ||
Fridge resistance check
Fridge performance
Before installation of the 10 mK can and the tower, the fridge has a base temperature of 21.5 mK at the following settings. Note these settings are not optimized.
- H35 resistor (on mixing chamber) base temperature: 21.5 mK
- Cold plate: believed to be around 100 mK, missing the number
- Still heater: 0 W
- P1: 0.060 mBar
- 1 K pot: 1.50 K
- P2: 4.0 mBar
After installation of the 10 mK can and tower, before powering up the detector, the fridge is running at:
- H35 base temperature: 38 mK
- Cold plate: 10.5 kOhm, around 250 mK
- Still heater: 0 W
- P1: 0.10 mBar
- 1K pot: 1.64 K
- P2: 13 mBar
These settings are not optimized either. Both the mixing chamber and the cold plate are warmer after the tower was installed. I believe there is fairly amount of heat conducted through the graphite tube in the tower. We may need to heat sink the 600 mK floor to the still. But the still also seemed warmer from P1. There might be some effect from the 1 K pot temperature difference. When the detector is powered up, H35 is at around 41 mK. Tower and detector temperature could be higher.
First pulse
With the help of Jeter, we managed to see pulses with the detector settings that we think are reasonable. The following are some screenshots of the experiment:
| Mixing chamber temperature |
|---|
 |
| IGH |
|---|
 |
| Phonon A settings |
|---|
 |
| Phonon B settings |
|---|
 |
| Phonon C settings |
|---|
 |
| Phonon D settings |
|---|
 |
| Pulses |
|---|
 |
| Noise PhA |
|---|
 |
| Noise PhB |
|---|
 |
| Noise PhC |
|---|
 |
| Noise PhD |
|---|
 |
| Noise Qi |
|---|
 |
| Noise Qo |
|---|
 |
IbIs measurement at 36.5mK
Resistance summary
| Sensor | Rsc [mΩ] (CRWU) | Rsc [mΩ] (UCB Run 267) | Rsc [mΩ] (UMN Run 1) | Rn [Ω] (driven at base) | Rn [Ω] from IbIs | Rn [Ω] (UCB Run 267) | Rn [Ω] (UMN Run 1) |
|---|---|---|---|---|---|---|---|
| A | 5.5 | 15.5 | 0.62 | 1.7 | 1.78 | 1.8 | 1.77 |
| B | 16 | 18.5 | 1.14 | 3.1 | ? | 2.2 | 2.52 |
| C | 12 | 22.0 | 0.55 | 3.0 | ? | 2.3 | 2.64 |
| D | 27 | 12.0 | 0.47 | 2.8 | ? | 2.1 | 2.20 |
IbIs plots
 |  |
 |  |


SQUID
Zapping
Principle
Zapping removes trapped flux in SQUIDs by driving it normal and letting it cool to superconducting temperature. The DCRC circuit charges a 0.1 F capacitor to 5 V. When zapping starts, the capacitors is connected to the SQUID through a 100 Ohm (what I measured is 1.5 kOhm) load and discharges for a given amount of time to drive the SQUID normal; and then the capacitor is disconnected from the SQUID and let the SQUID cool to superconducting temperature.
Procedure
Phonon channels B and C have modulation depth ~ 500 mV; A and D have modulation depth ~ 250 mV. A and D seemed to have trapped magnetic flux in the SQUID judging from the modulation curve when increasing the SQUID bias from 0. We suspected that zapping didn't work well because
- a) zapping current didn't turn off at cooling as noted by Dennis http://cdms.berkeley.edu/cdms_restricted/elog/DCRC+Development/28,
- b) DCRC has an offset of 35 uA on QET A biasing, and
- c) DCRC has a large turn on transient which drove the SQUID normal.
The oldest zapping vi was used in this run. Problem a) did exist. At the end of the run, I tried to zap the SQUID with a battery to avoid Problem a), but I didn't see any improvement. This might be because Problem c). After zeroing the DCRC, there is no essential difference in zapping result. Problem b) was corrected and had little effect on zapping. I didn't measure the transient when DCRC was turned on and can not say much about it.