Table of Contents
Run 69 Summary
Heatsinking
For this run we decided to install without the 4K shield or heatsinking.
Normally we install the 4K stage with the tower, which serves as a heat sink of the tower to the IVC and a shield to lower temperature stages. But we realized that with a detector with no FETs this may not be necessary and may be counterproductive. It's been seen that a major contributor to phonon channel noise for this detector is the temperature of the pins plugging the SQUET into the 4K stage of the tower. If this temperature could be reduced it would probably improve our threshold.
Discussion of heatsinking options and thermal estimates
It's possible however that even without the FETs on, the 4K heatsinking may help pull away incoming heat from the stripline traces. Then removing the heatsinking could make the SQUET warmer (and may even compromise the fridge, putting a greater heat load on the still and/or coldplate). The question is whether the heatsinking is pulling heat away from the tower to the bath or pushing heat into the tower from the bath.
Calibration
Data from 3 series taken on 4/4 with bias drifts of 300V→400V were used to perform an energy calibration. The initial processing used calculated templates and had no channel balancing in PT so PsumOF was constructed from a crude channel weighting. However, PA was inoperable for this data, so it does not contribute to signal or noise.There is also a ~10% adjustment of overall calibration between each series. This PsumOF is plotted versus PF partition below. The 241Am lines are seen at high PFpart, possibly down to even the 3keV line. The 10 keV and a hint of the 1 keV Ge activation lines are also visible at a range of radii. The position of 2 Pinner cut lines are also shown.
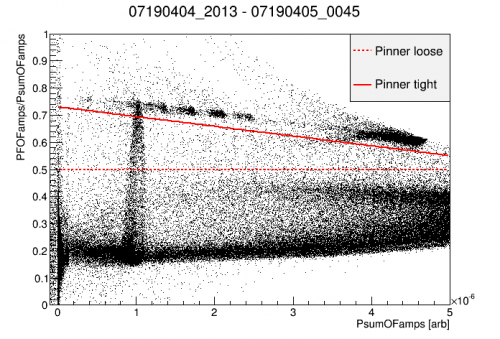 |
| PFpart vs PsumOF for 300V→400V drift data |
|---|
The spectra resulting from the above cut lines are shown below. Using the tighter cut reduces the 10keV activation peak (but doesn't appear to shift its position) and totally removes the 1keV peak.
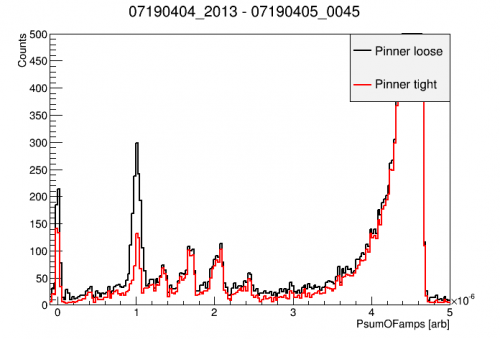 |
| Uncalibrated Psum spectrum with Pinner cut from 300V→400V drift data |
|---|
Using the loose Pinner cut from above, the clear Am and Ge peak positions were fitted. The resulting calibration curve was fit with a quadratic function as shown in the figure below. The blue curve fit all points while the red curve did not include the 60keV line which is somewhat saturated. It is encouraging that this calibration is quite linear below 30 keV.
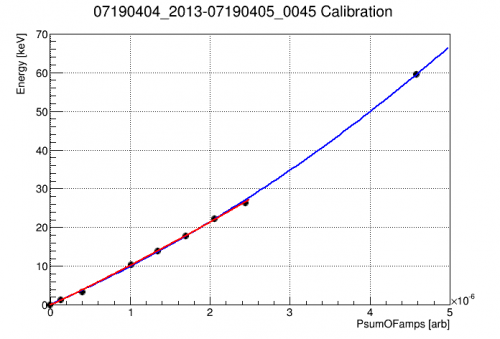 | 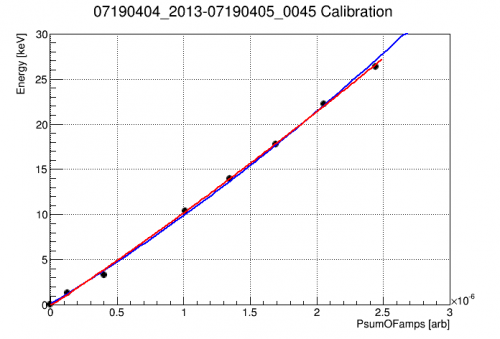 |
| Calibration curves | Zoom of calibration curves |
|---|
With this calibration, the noise width of randoms is 48 eVee, consistent with the lowest values obtained in the noise vs. HV scan in the section below. The above analysis used data without PA, so the noise could be as high as 6/5 * 48eVee = 58 eVee.
Noise vs HV
With constant HV bias, accumulating surface charge at the vacuum interface causes the effective crystal bias to decrease linearly with time, likewise reducing the NTL gain. Data was taken in this mode on 20190404 with both threshold and random triggers to measure both signal and noise. This can be seen in the figures below. The left figure shows the Psum signal vs time for a constant applied HV of -300 V. The right figure shows the same quantities for HV = +300 V. The 60 keV and 10keV lines can be seen in both plots. For some reason the calibration signals are lower in the negative bias data while the pulses saturate at lower amplitudes in the positive bias. Both the 60keV peak, which originates near the electrode side of the crystal, and the 10keV peak, which is uniformly distributed in the crystal, scale together. This indicates the effect is not a difference of drifting holes vs electrons. If this had been the case, we would expect the 10keV line to be unaffected as its signal should be comprised of an equal mix of holes and electrons on average. Note also the different time scales of the two datasets. In the positive bias, the 60keV signal lasts for at least twice as long as in the negative bias.
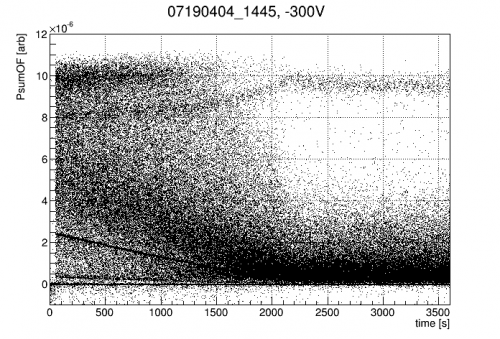 | 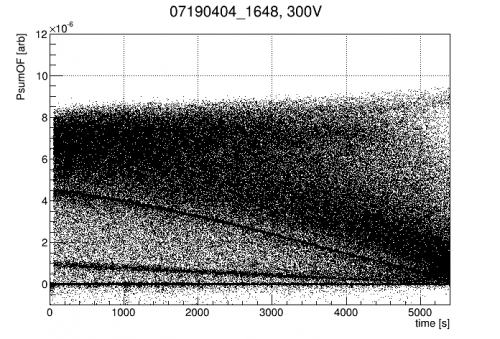 |
| Phonon signal with time for constant HV = -300 V | Phonon signal with time for constant HV = 300 V |
|---|
Assuming that trapping and impact ionization are negligible, the crystal bias can be obtained by via the NTL gain, G=1+Vcry/3.0. Using the difference in gain from 0V, the crystal bias can be inferred as a function of time. Note that in the 0V data, the 60keV line is used for calibration, while the 10keV line is used at all other biases. Thus if the 0V signal is not linear up to 60keV, the following results may be biased. The magnitude of this inferred bias is shown below. The similar slopes indicate the rate of counterbias accumulation is the same in either polarity. There shouldn't be any polarity dependence in the applied HV, but it seems as though the magnitude of HV applied to the electrode is different.
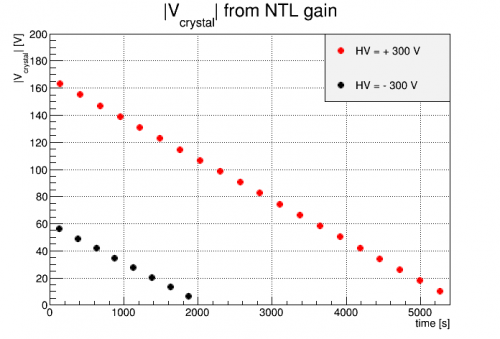 |
| Inferred crystal bias vs time |
|---|
If we assume this crystal bias is correct, we can estimate the vacuum gap at the detector. If we assume counter-bias accumulates at the same rate from the time bias first starts to be applied, approximately 8 min before data taking at, we find the accumulated counter-bias at t=0 is ~14.3 V for either polarity. At t=0, the measured leakage voltage was 6.25 mV (-6.69 mV) for positive (negative) HV. Using the expression:

with  =16.2 and h=33.3 mm, we find the inferred gap, d, to be 1.32 mm (6.2 mm) for positive (negative) HV. Given our best measurement of the gap at room temperature was 0.55 mm, these values appear too high to account for all of the observed bias loss.
Whatever the source of the bias drop, we trust the NTL gain of 10keV and 60keV events to track the crystal bias well. Then, this is effectively a sweep in Vcrystal and can be used to evaluate the leakage noise at each bias voltage.Note that PA was inoperable for this data, so the noise will all channels may be higher by as much as a factor of 6/5. We can see this total noise as a function of crystal bias in the figure on the left below. Except for a single point in the positive bias (which occurred early in that dataset), the total noise is relatively flat and similar in the two biases and consistent with the noise measured at 0V in the data from 4/05. This in encouraging as it indicates little extra noise with HV bias in either polarity.
However, this noise level (sigma_PT=1.8 keVee) is surprisingly higher than the sigma_PT = 280 eVee obtained in R66. It is difficult to believe that this increase by a factor of ~6.6 is a result of higher fridge temperatures alone. One likely source is the degradation of PC during the run. When this data was taken, the SQUID response of PC was awful and the channel's signal amplitude was 1/10 that of some others. This resulted in a relatively calibrated noise width of PC which was 4.7x higher than the other channels. This is enough to account for an increase in total noise width of a factor of ~2.3. Not enough to explain the entire increase from previous runs, but it makes a substantial impact.
The effective noise, calibrated to the the 10keV line, is also shown on the right. It indicates a noise minimum of 44 eVee.
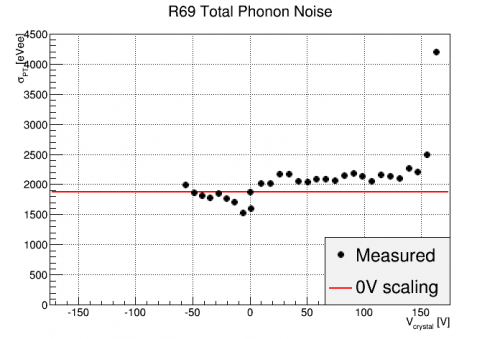 | 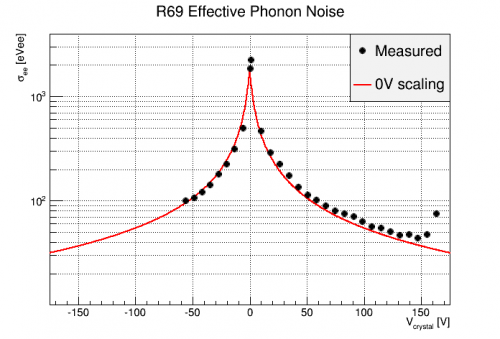 |
| Total phonon noise vs crystal bias | Effective phonon noise vs crystal bias |
|---|