Table of Contents
Run 67 Summary
This is the second run of USD1. It is a repeat of Run 58
- Link to external run documentation: https://josephss.github.io/run67/
- Link to edit external run documentation: https://github.com/Josephss/run67 (ask Joseph Mammo Joseph.Mammo@coyotes.usd.edu to be made a Contributor to the git repo on github)
Detector
USD1
Charge Calibration
4K Data
In the second attempt to cool down we had a leak from the main bath to the IVC which prevented us from cooling much below 4K. Nevertheless at 4K we were able to see pulses, so we took some test data.
The resistance through the detector (side1 to side2) was monitored during cooling and warming. This measurement is through a 40 MΩ bias resistor, so that was subtracted from the multimeter reading.
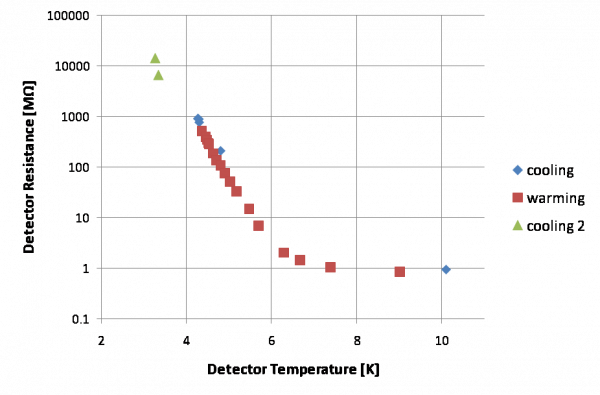
Below around 5 K the crystal becomes resistive enough to hold a bias and take data.
Noise however seems to be quite bad at 4K. It's probably due to the higher Johnson noise and also the non-zero current (~10 nA) through the detector. Below is a comparison of noise in this run at 4K to other runs at base: Run 65, which was the 5Q 150mm Si detector, and Run 58, which was the previous run of this detector. In all cases the detector bias was +11 or +10 V.
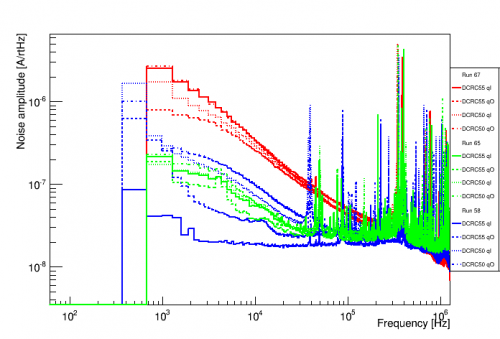 | 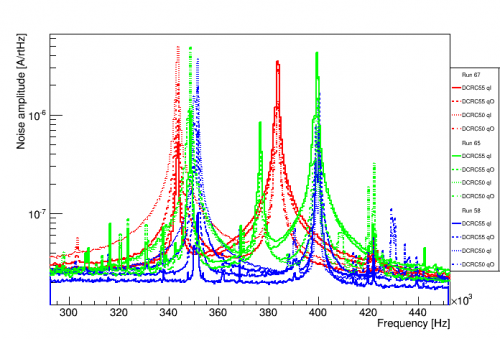 |
| Run 67 noise at 4K compared to other runs at base | Zoom on the peaks that are caused by DCRC noise |
Presumably because of the elevated noise I was not able to see the 60 keV peak in any of the channels in this data - the thresholds were too high. I did see a muon hump, and the channel partitioning for muons looked reasonable. Calibrating to the muon energy I was able to determine that the energy threshold was right around 60 keV for the best channel, worse for the others.
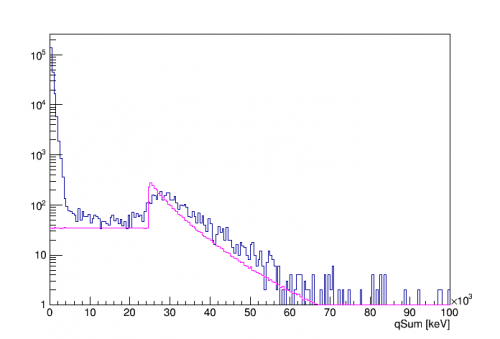 | 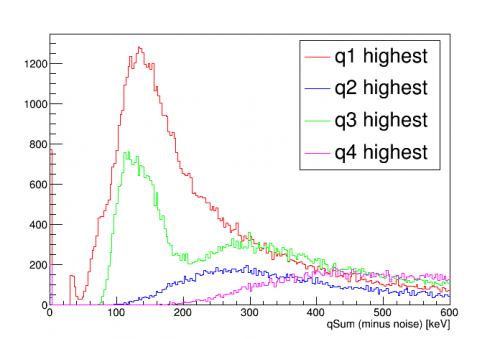 |
| qSum spectrum calibrated to muons (12V bias) | Low-energy spectra based on muon calibration |
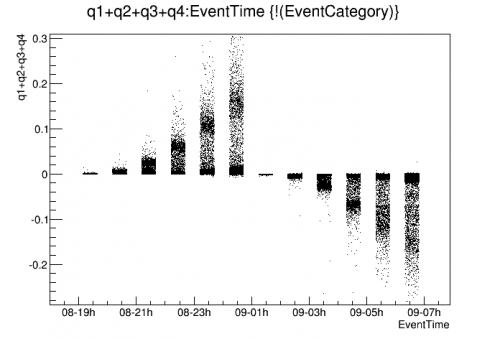
Also at 4K we took bias sweep data, +1 to +11 V then -1 to -11 V. Below shows that a seagull plot could be constructed from the muon bulge, at least for qSum (more difficult for individual channels, the muon bulge is not as prominent).
First look at peaks in base temperature data
Study of time dependence (neutralization hold time)
References
Crystal growth and detector performance of large size High-purity Ge crystals, Wang, 2015]
Crystal Data
Impact ionization of impurities in germanium, Sclar, 1956
Theory of Low-Temperature Impact Ionization in High-Purity Germanium, ZYLBERSZTEJN, 1962
Resistivity and hall coefficient of antimony-doped germanium at low temperatures, Fritzsche, 1958