Direct Charge Calibration
4 K
A test was made to use a signal generator to calibrate the charge channels. Using a Dsub switchboard, a signal generator was connected to the bias electrode line and used to put a ~mVpp square wave signal on the bias electrode. This drives a square wave voltage at the channel electrodes, which, given the constant detector capacitance, pulls a fixed amount of charge to the electrode. This is just like a real event. This process basically injects artificial pulses on the electrodes. By varying the amplitude of the input signal and swapping around DCRCs, we can map out the differences in Channel/FET/DCRC gains. Note that the below data was all taken at 4K
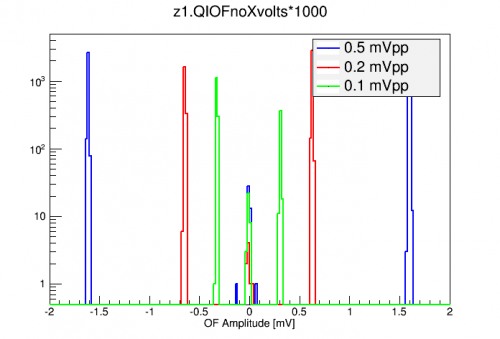
The figure below shows the distribution of measured pulse heights for several input signal amplitudes. They are generally very nice gaussian distributions.
 |
A simple thing we can do is to calculate the capacitance between each channel and the bias electrode. This should be given by
<m>C=C_{FB} V_{Out}/V_{In}</m>
This assumines the full output signal generator signal is applied to the bias electrode with no losses. Using <m>C_{FB}</m> = 1.2 pF (R65 fall time measurements) we get the values plotted below. Error bars are from the standard deviation of values calculated using different dcrcs and signal polarities. Here, q1 is the outermost channel and q4 is the central channel.
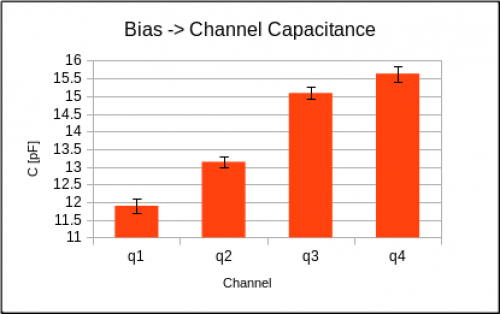 |
The capacitance of a ring-disk parallel plate capacitor is not simple to calculate. Treating the inner channel as an infinite parallel plate capacitor gives <m>C_{4,inf}</m>=8.8 pF, but treating it as a disk capacitor with both sides the same size as channel 4 gives (using Nishiyama (1993) ) <m>C_{4,disk}</m>=24 pF. So these are not too far off. It is unclear whether the observed trend with channel radius,thickness is expected.
The main point of this test was to try to understand variations in charge gains. To do so, each channel's output distribution was fitted with a gaussian. The mean of these were plotted as a function of input signal amplitude (0.1mVpp, 0.2mVpp, and 0.5mVpp) and fitted with a straight line. These fits are extrapolated down to 0 input and shown in the figures below. There are two figures for the two different DCRC setups used.
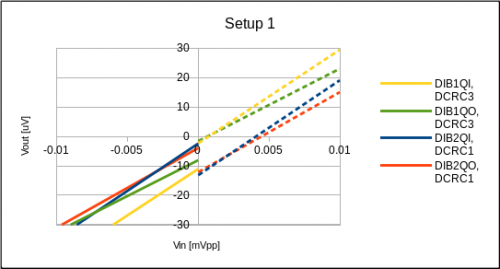 | 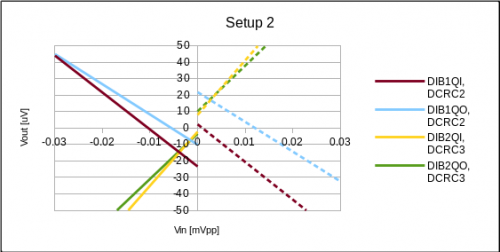 |
Because different detector channels will couple differently (see capacitances above) the slopes of these graphs cannot all be compared. However, the interesting feature is that some of these have non-negligible offsets (non-zero intercept) and these are different depending on the input polarity. This may mean that such a channel will show no signal until it reaches a certain threshold, or seems to show some signal even with no input. Unfortunately, the offsets do not seem to be correlated with either DCRC or FET/detector channel. It should be noted that these amplitudes are currently below our charge noise level and have been extrapolated down by an order of magnitude, so they are difficult to confirm. However, they could have significant consequences for events even a reasonable way above trigger threshold.
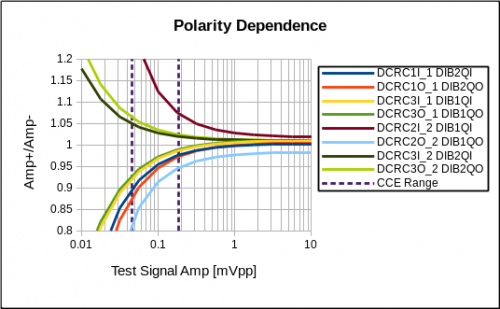
The figure below takes the fitted forms of the gain responses and plots the ratio of responses to positive and negative inputs of the same magnitude. I.e. this shows how a given DCRC/FET/Channel combination will respond differently to upright and inverted pulses. Also shown is the approximate region in which our 60keV charge signal generally falls. Here we see that differences of 5-10% (in a single channel) can result from these offsets and the size and slope of the discrepancy depends sensitively on the relative size and sign of the offsets. As an example, DCRC2QI shows a ratio greater than 1, while DCRC2QO gives a ratio smaller than 1.
 |
These results indicate that we need to be careful comparing different charge measurements. However, it would be interesting to repeat this analysis at ~40mK as opposed to 4K.
40 mK
The above tests were repeated later at base temperature on 2018/04/02. In order to reach lower amplitudes, a set of such data was also taken while triggering externally on the function generator output signal. Additionally, the charge amplitude output was calibrated to keV using an absolute calibration which is in rough agreement with the observed 241Am line in other data.
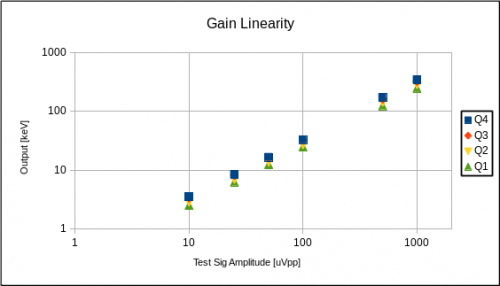 |
| The gain was very linear in both polarities. Only positive amplitude pulses are shown here. |
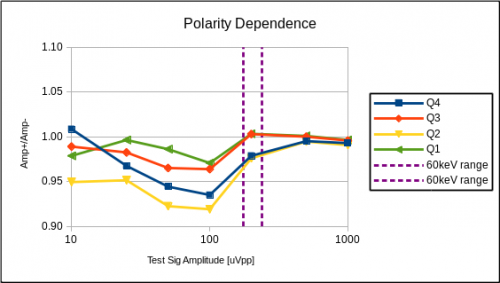 |  |
| The ratio of measured peak positions in positive and negative polarity Left: Raw ratios and Right: after a correction to the average behavior. | |
As can be seen above, the Amplitude ratio does not deviate as far from unity as predicted based on the 4K data. Down to 100uVpp, the ratios do begin to deviate by as much as 8%, but they all return to 1 at lower amplitudes. Futhermore, there seems to be a common shape to all channels, indicating that there may be polarity dependence in the generated input signal which changes as a function of amplitude. The figure on the right shows the remaining effects after correcting by the average at each test signal amplitude. Channels Q4 and Q2 are both on DCRC1/DIB2 while channels Q1/Q3 are on DCRC3/DIB1. This is confusing because, in data, we have observed the positive polarity pulses being systematically larger than the negative. These results show no such systematic trend.