−Table of Contents
PMT spectra Comparison by Time
Weighted by Time
All data files have been previously analyzed here (background), here (Barium-133), and here (Americium-241). PMT 14 was run with a bias voltage of -1100 V with scintillator 1-66-? and varying sources with a copper collimator attached to plastic in the darkroom. The connection to the DAQ board was modified with varying attenuators. Each event was self-triggered with a varying trigger threshold for a total of 100k events.
| Table 1: Data files used | ||||
|---|---|---|---|---|
| Run | Source | Scintillator | Total time (s) | Data file |
| 1 | None | None | 10813 | 130920_pmt14_background_1100v_x10_no-scint.dat |
| 2 | None | Yes | 5868 | 130911_pmt14_background_8280_1100v_x10.dat |
| 3 | Am-241 | None | 34456 | 130921_pmt14_am241_8280_1100v_x10_no-scint.dat |
| 4 | Am-241 | Yes | 5144 | 130909_pmt14_am241_8280_1100v_x10.dat |
| 5 | Ba-133 | Yes | 4643 | 130906_pmt14_ba133_8280_1100v_x10.dat |
Americium-241
| Figure 1: Comparison between backgrounds and source for Americium-241 |
|---|
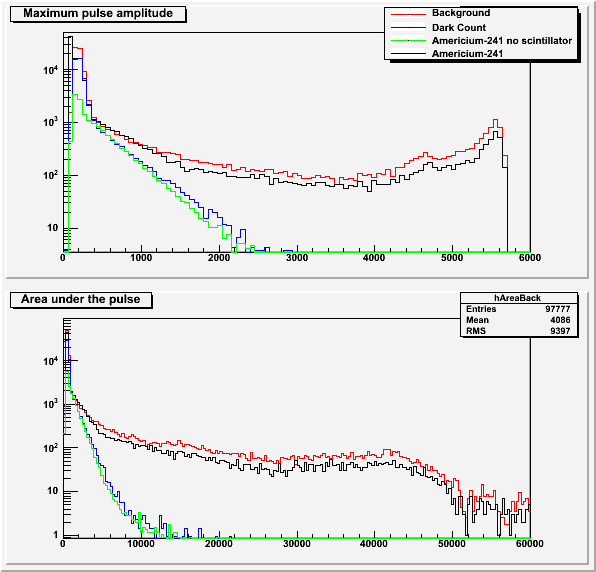 |
Each histogram in Figure 1 is weighted by frequency (100k events / total time) such that the Americium-241 run with scintillator has a weight of 1. The cuts for saturation and baseline standard deviation have also been removed.
Barium-133
| Figure 2: Comparison between backgrounds and source for Americium-241 |
|---|
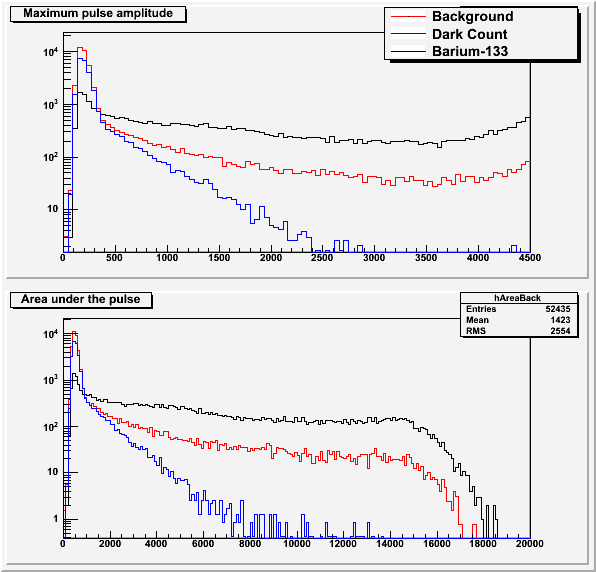 |
Each histogram in Figure 2 is weighted by frequency (100k events / total time) such that the Barium-133 run with scintillator has a weight of 1.
Cut by Time
All data files have been previously analyzed here (background), here (Barium-133), here (Americium-241), and here (Cesium-137). PMT 14 was run with a bias voltage of -1100 V with scintillator 1-66-? and varying sources with a copper collimator attached to plastic in the darkroom. The connection to the DAQ board was modified with varying attenuators. Each event was self-triggered with a varying trigger threshold for a total of 100k events.
| Table 1: Data files used | |||||
|---|---|---|---|---|---|
| Run | Source | Scintillator | Attenuation | Total time (s) | Data file |
| 1 | None | None | None | 10813 | 130920_pmt14_background_1100v_x10_no-scint.dat |
| 2 | None | Yes | None | 5868 | 130911_pmt14_background_8280_1100v_x10.dat |
| 3 | None | Yes | x10 | 12120 | 130917_pmt14_background_8230_1100v_x10_x10atten_1.dat |
| 4 | Am-241 | None | None | 34456 | 130921_pmt14_am241_8280_1100v_x10_no-scint.dat |
| 5 | Am-241 | Yes | None | 5144 | 130909_pmt14_am241_8280_1100v_x10.dat |
| 6 | Am-241 | Yes | x10 | 10323 | 130910_pmt14_am241_8230_1100v_x10_x10atten.dat |
| 7 | Ba-133 | Yes | None | 4643 | 130906_pmt14_ba133_8280_1100v_x10.dat |
| 8 | Ce-137 | Yes | x10 | 4434 | 130910_pmt_cs137_8230_1100v)_x10_x10atten.dat |
Americium-241
| Figure 3: Americium-241 Comparison cut by Time only |
|---|
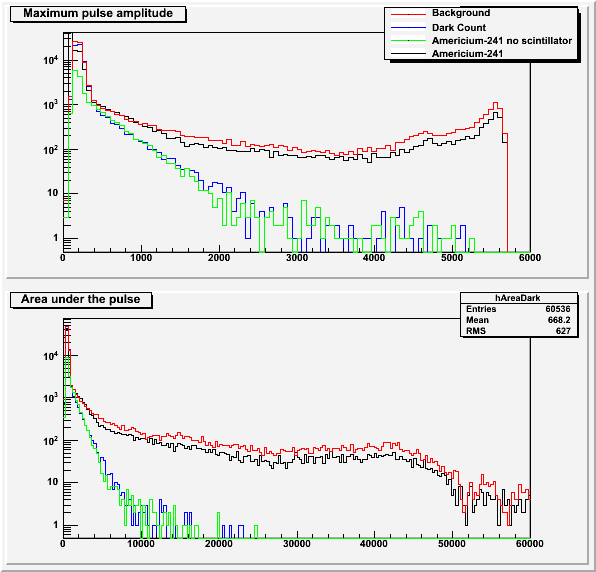 |
Each histogram in Figure 3 is cut by time such that the histogram has the number of events that were taken in the amount of time it took to get 100k Americium-241 events. The cuts for saturation and baseline standard deviation have also been removed.
| Figure 4: Americium-241 Comparison cut by Time, and Saturation |
|---|
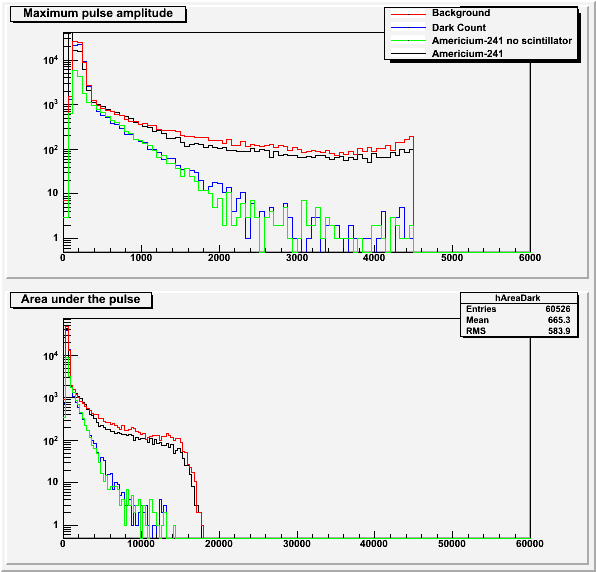 |
Each histogram in Figure 4 is cut by time such that the histogram has the number of events that were taken in the amount of time it took to get 100k Americium-241 events. Each histogram is also cut at the saturation limit of an amplitude of 4500 bins. The cuts for baseline standard deviation have also been removed.
| Figure 5: Americium-241 Comparison cut by Time, Baseline standard deviation, and Saturation |
|---|
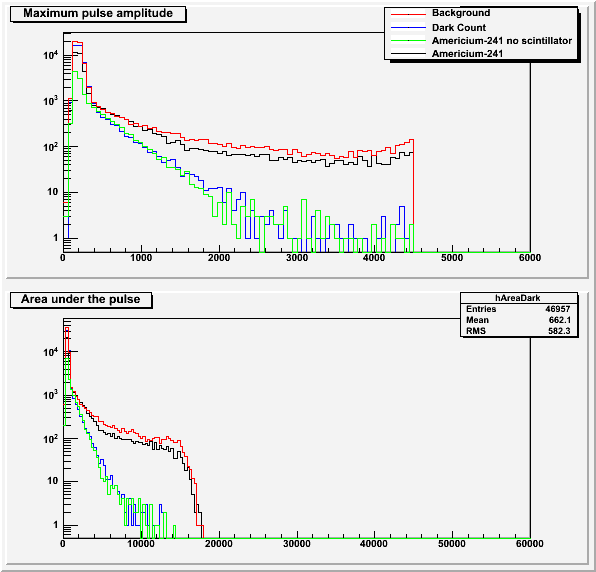 |
Each histogram in Figure 5 is cut by time such that the histogram has the number of events that were taken in the amount of time it took to get 100k Americium-241 events. Each histogram is also cut at the saturation limit of an amplitude of 4500 bins. All events with a baseline standard deviation greater than 7 have also been cut.
Barium-133
| Figure 6: Barium-133 Comparison cut by Time, Baseline standard deviation, and Saturation |
|---|
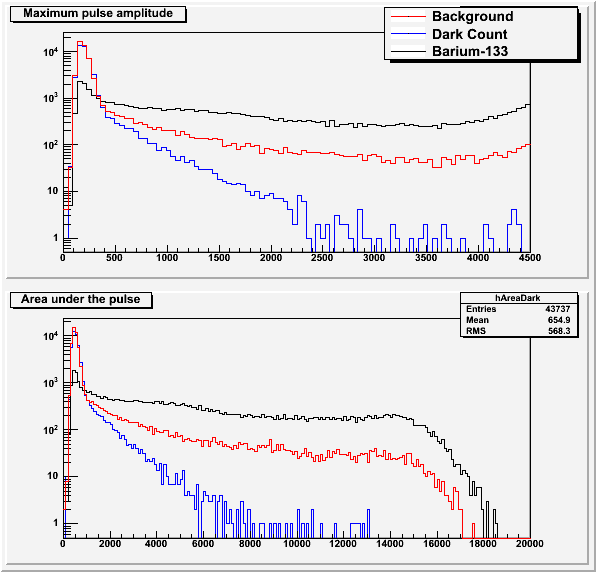 |
Each histogram in Figure 6 is cut by time such that the histogram has the number of events that were taken in the amount of time it took to get 100k Barium-133 events. Each histogram is also cut at the saturation limit of an amplitude of 4500 bins. All events with a baseline standard deviation greater than 7 have also been cut.
Cesium-137
| Figure 7: Cesium-137 Comparison cut by Time, Baseline standard deviation, and Saturation |
|---|
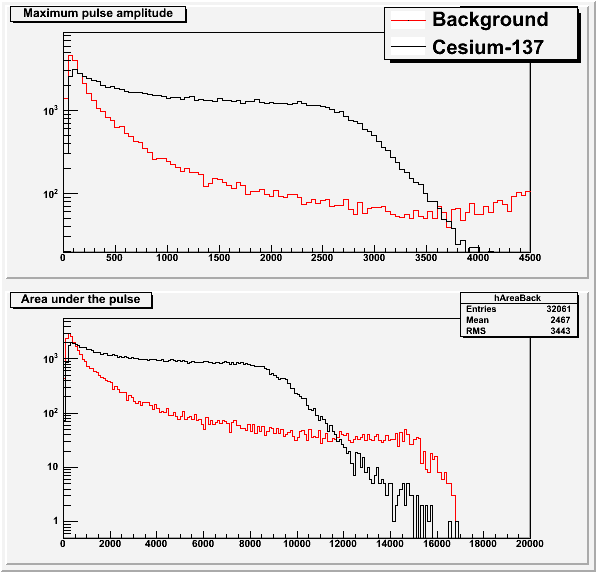 |
Each histogram in Figure 7 is cut by time such that the histogram has the number of events that were taken in the amount of time it took to get 100k Cesium-137 events. Each histogram is also cut at the saturation limit of an amplitude of 4500 bins. All events with a baseline standard deviation greater than 7 have also been cut.