−Table of Contents
PMT Spectra of Ba-133
PMT 14 was run with a bias voltage of -1100 V with scintillator 1-66-? and Ba-133 with a copper collimator attached to plastic in the darkroom. The connection to the DAQ board was modified with varying attenuators. Each event was self-triggered with a varying trigger threshold for a total of 100k events.
| Table 1: Data files use | ||||
|---|---|---|---|---|
| Run | Noisy | Attenuation | Trigger Threshold | Data file |
| 1 | high noise | none | 8280 | 130905_pmt14_ba133_8280_1100v_x10.dat |
| 2 | less noise | none | 8280 | 130906_pmt14_ba133_8280_1100v_x10.dat |
| 3 | less noise | 5x | 8230 | 130906_pmt14_cs137_8230_1100v_x10_x5atten.dat |
Note: Run 3 is labelled as cs137. This a typo in the file name. This run was actually conducted with Ba-133.
Noisy, un-attenuated Ba-133 run
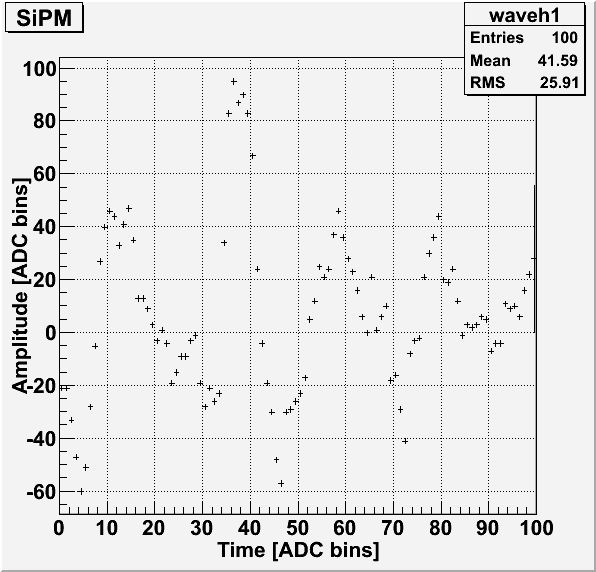
For some unknown reason, the first un-attenuated run with collimated Ba-133 was mostly pulses of noise only. An example pulse is shown below. The noisy pulses are also seen in the baseline standard deviation plot as pulses with unusually high standard deviations.
| Figure 1: Example noisy pulse. |
|---|
 |
| Figure 2: Baseline standard deviation. |
|---|
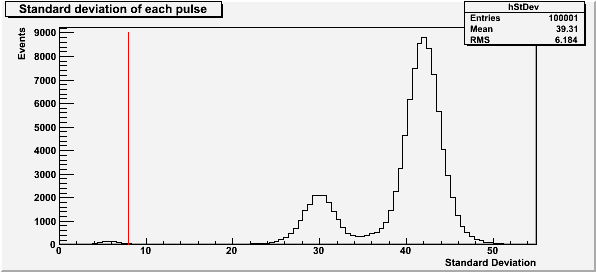 |
The red line at a standard deviation of 8 in Figure 2 represents the cut used for baseline standard deviation.
| Figure 3: Saturated pulses. |
|---|
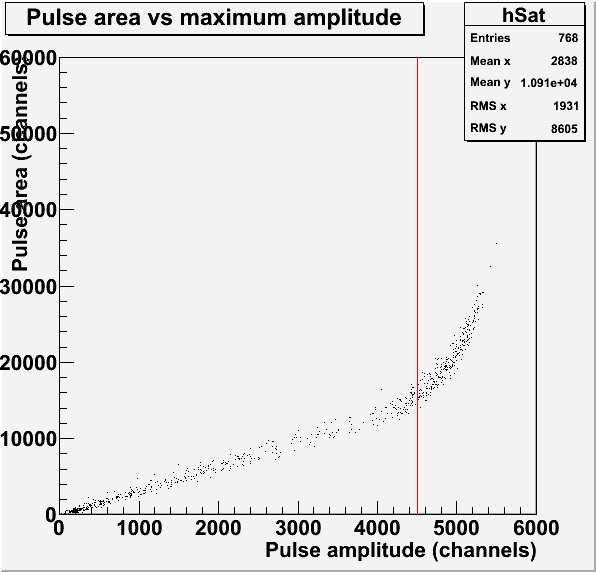 |
The red line in Figure 3 represents the saturation limit of 4500 channels for the pulse amplitude. This pulses used to make this histogram have a baseline standard deviation less than 8.
| Figure 4: Pulse maximum amplitude and area. |
|---|
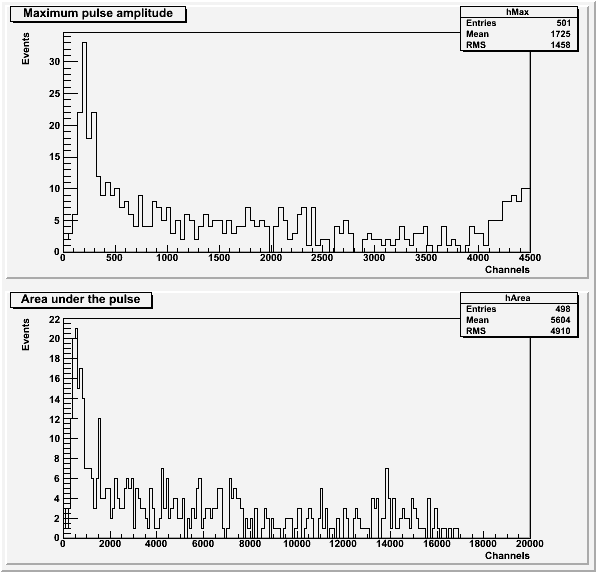 |
Both histograms in Figure 4 exclude pulses with an amplitude greater than 4500 channels or a baseline standard deviation greater than 8. the histogram of area under the pulse also excludes pulses with a secondary pulse before the main pulse.
Less noisy, un-attenuated Ba-133 run
| Figure 5: Baseline standard deviation. |
|---|
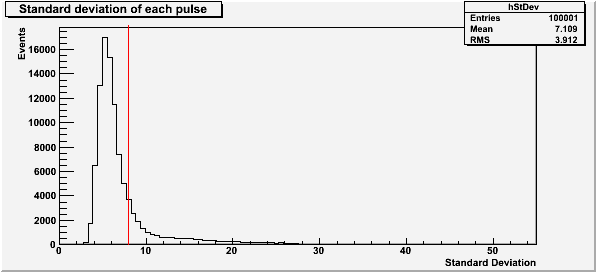 |
The red line at a standard deviation of 8 in Figure 5 represents the cut used for baseline standard deviation. The lack of standard deviation peaks above the initial peak shows that this run was much less noisy than the first.
| Figure 6: Saturated pulses. |
|---|
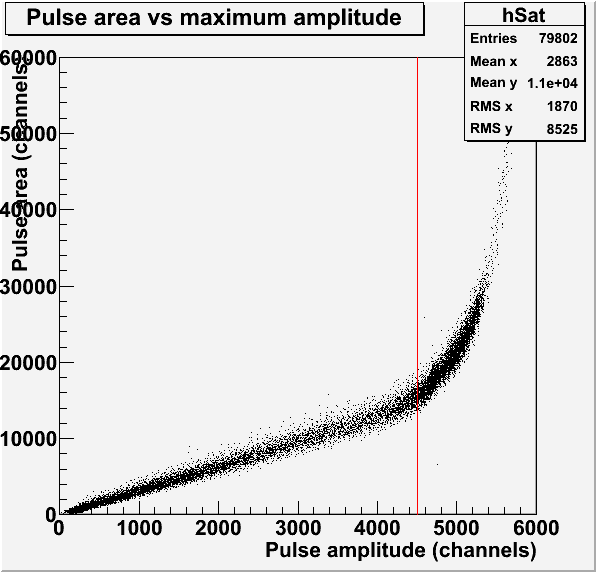 |
The red line in Figure 6 represents the saturation limit of 4500 channels for the pulse amplitude. This pulses used to make this histogram have a baseline standard deviation less than 8. The dense region just above the saturation limit suggests that a second peak may be present in the spectrum.
| Figure 7: Pulse maximum amplitude and area. |
|---|
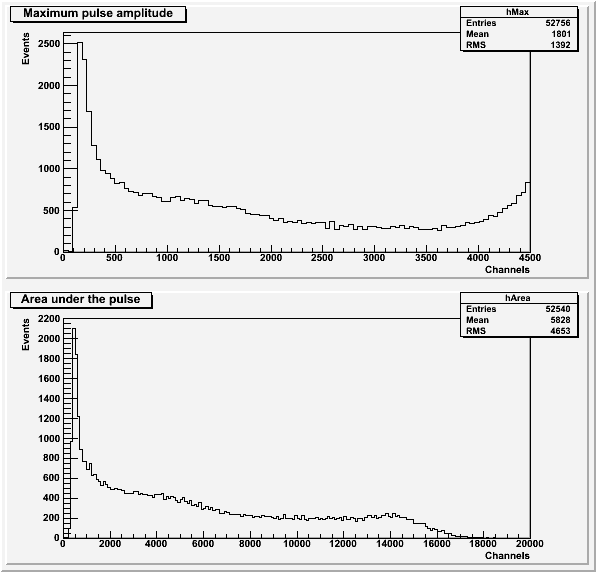 |
Both histograms in Figure 7 exclude pulses with an amplitude greater than 4500 channels or a baseline standard deviation greater than 8. the histogram of area under the pulse also excludes pulses with a secondary pulse before the main pulse.
| Figure 8: Comparison to background for pulse area and maximum amplitude. |
|---|
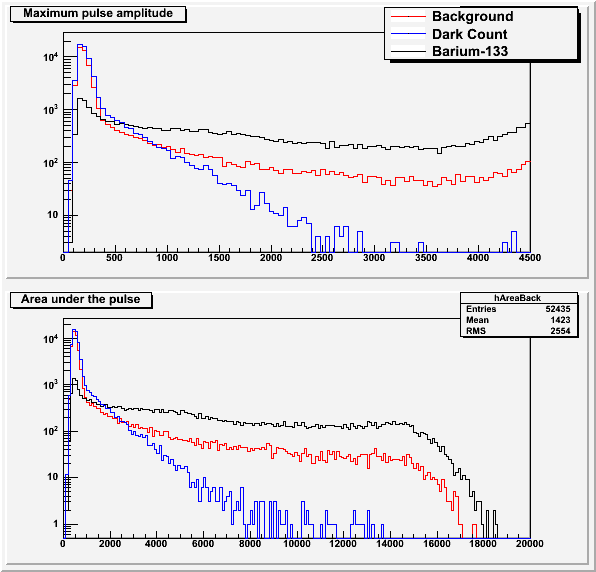 |
The background data and dark count data (background run without scintillator) is explained in this post.
5x-attenuated Ba-133 run
| Figure 9: Baseline standard deviation. |
|---|
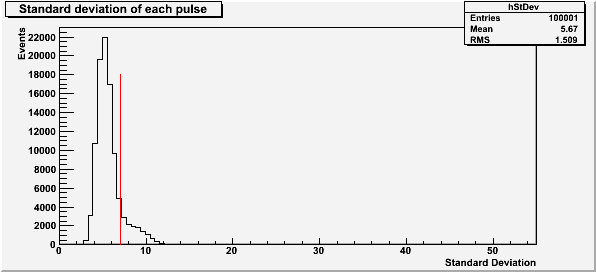 |
The red line at a standard deviation of 7 in Figure 9 represents the cut used for baseline standard deviation. The lack of standard deviation peaks above the initial peak shows that this run was much less noisy than the first.
| Figure 10: Saturated pulses. |
|---|
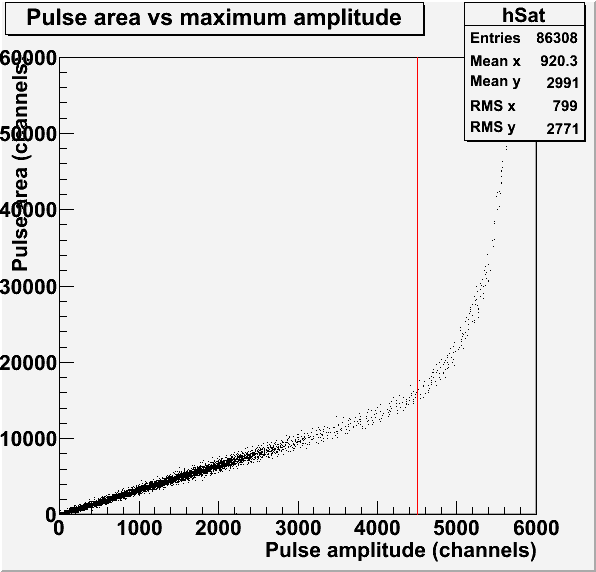 |
The red line in Figure 10 represents the saturation limit of 4500 channels for the pulse amplitude. This pulses used to make this histogram have a baseline standard deviation less than 7.
| Figure 11: Pulse maximum amplitude and area. |
|---|
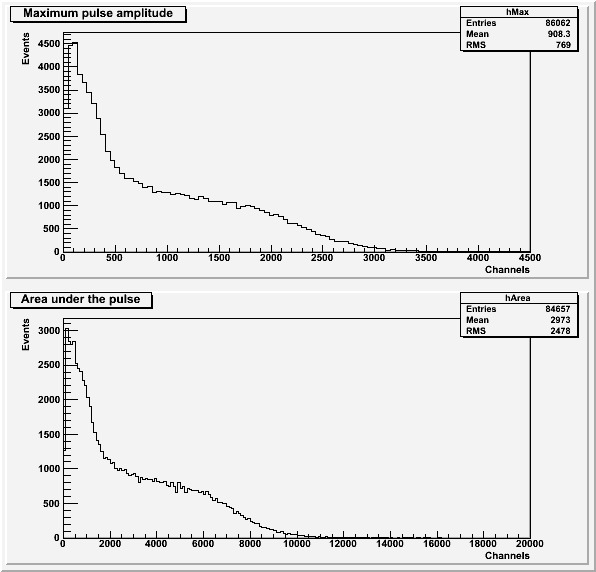 |
Both histograms in Figure 11 exclude pulses with an amplitude greater than 4500 channels or a baseline standard deviation greater than 7. the histogram of area under the pulse also excludes pulses with a secondary pulse before the main pulse. The second peak expected from Figure 6 is not visible in either spectra.