−Table of Contents
PMT spectra of Am-241
PMT 14 was run with a bias voltage of -1100 V with scintillator 1-66-? and Am-241 with a copper collimator attached to plastic in the darkroom. The connection to the DAQ board was modified with varying attenuators. Each event was self-triggered with a varying trigger threshold for a total of 100k events.
| Table 1: Data files used | |||
|---|---|---|---|
| Run | Attenuation | Trigger Threshold | Data file |
| 1 | none | 8280 | 130909_pmt14_am241_8280_1100v_x10.dat |
| 2 | 5x | 8230 | 130909_pmt14_am241_8230_1100v_x10_x5atten.dat |
| 3 | 10x | 8230 | 130910_pmt14_am241_8230_1100v_x10_x10atten.dat |
Unattenuated Am-241 Run
| Figure 1: Standard deviation of the baseline |
|---|
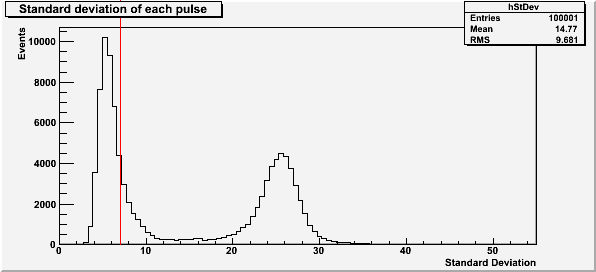 |
The red line at a standard deviation of 7 in Figure 1 is the highest baseline standard deviation allowed in the subsequent plots for the unattenuated Am-241 run. The first peak is due to noise in the DAQ board, and the second peak is noise in the baseline due to a bad pulse.
| Figure 2: Pulse saturation |
|---|
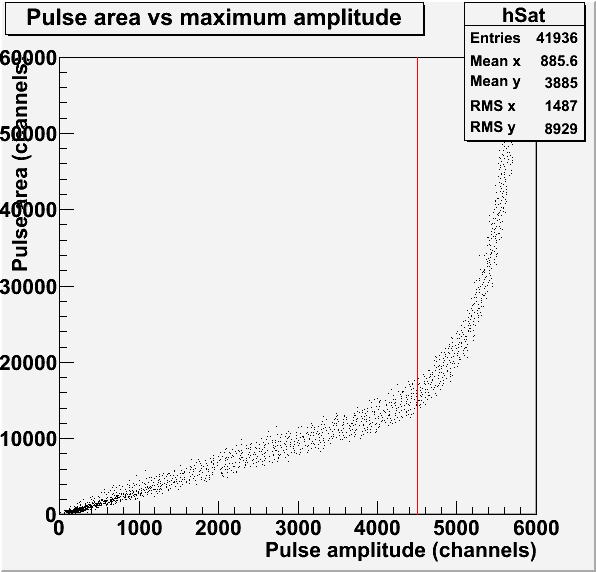 |
The red line in Figure 2 represents the saturation limit of 4500 channels for the pulse amplitude. This pulses used to make this histogram have a baseline standard deviation less than 7.
| Figure 3: Pulse maximum amplitude and area |
|---|
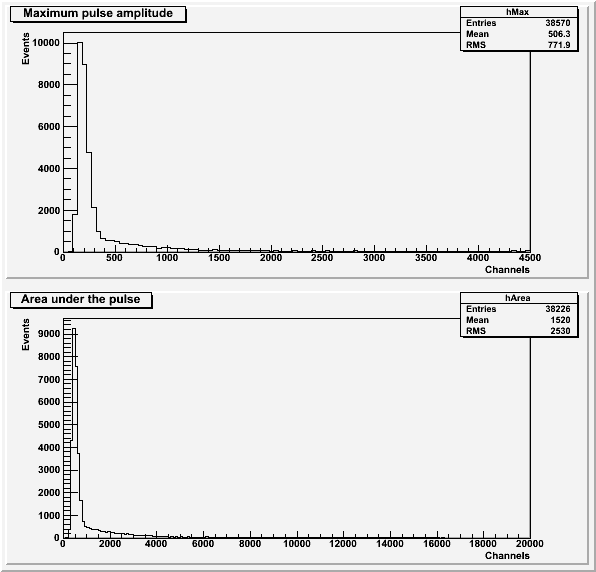 |
Both histograms in Figure 3 exclude pulses with an amplitude greater than 4500 channels or a baseline standard deviation greater than 7. the histogram of area under the pulse also excludes pulses with a secondary pulse before the main pulse.
| Figure 4: Comparison to background. |
|---|
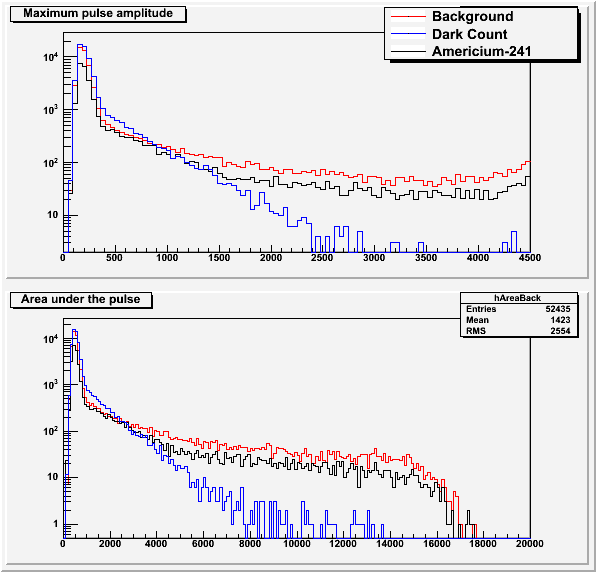 |
The background data and dark count data (background with no scintillator) is explained in this post. Figure 4 seems to suggest that we are not seeing the Americium source with the PMT.
5x Attenuated Am-241 Run
| Figure 5: Standard deviation of the baseline |
|---|
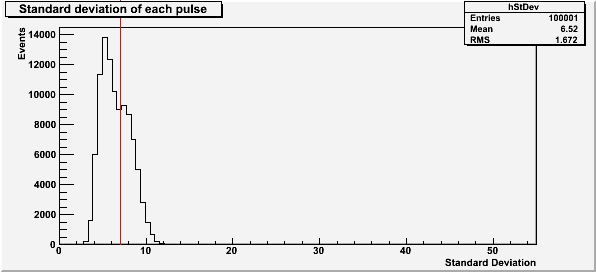 |
The red line at a standard deviation of 7 in Figure 5 is the highest baseline standard deviation allowed in the subsequent plots for the 5x attenuated Am-241 run. The second peak, which represents noisy pulses, has moved much closer to the lower DAQ-noise peak due to the attenuation. This makes it much harder to separate out the bad pulses.
| Figure 6: Pulse saturation |
|---|
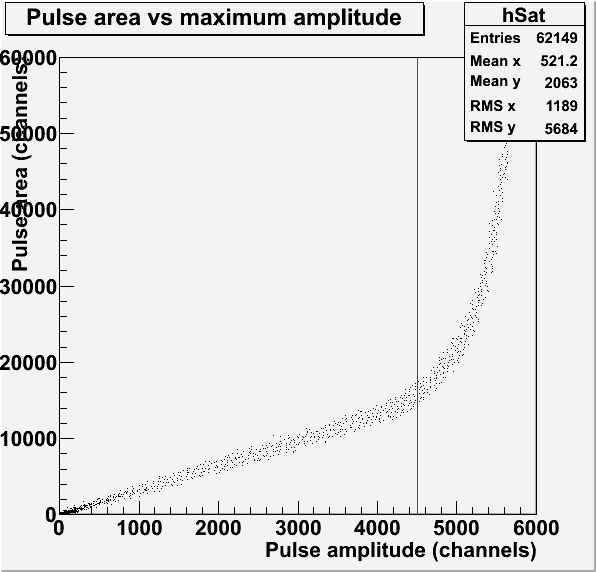 |
The red line in Figure 6 represents the saturation limit of 4500 channels for the pulse amplitude. This pulses used to make this histogram have a baseline standard deviation less than 7.
| Figure 7: Pulse maximum amplitude and area |
|---|
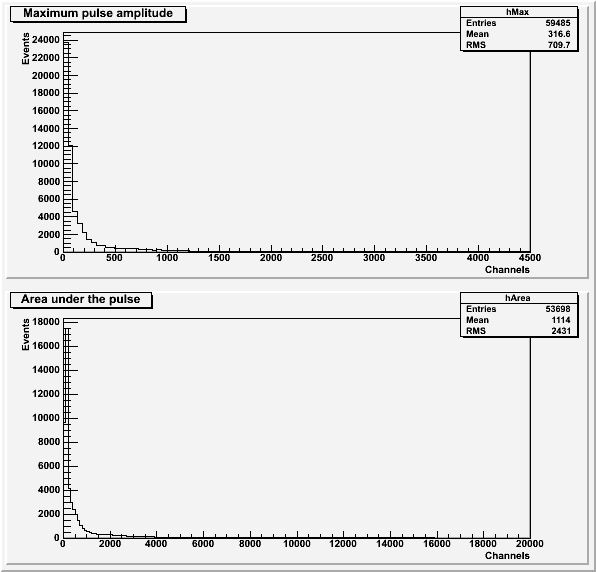 |
Both histograms in Figure 7 exclude pulses with an amplitude greater than 4500 channels or a baseline standard deviation greater than 7. the histogram of area under the pulse also excludes pulses with a secondary pulse before the main pulse.
10x Attenuated Am-241 Run
| Figure 8: Standard deviation of the baseline |
|---|
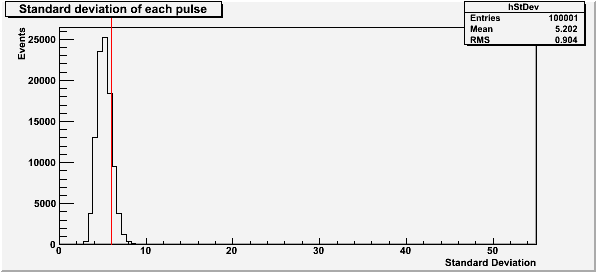 |
The red line at a standard deviation of 6 in Figure 8 is the highest baseline standard deviation allowed in the subsequent plots for the 10x attenuated Am-241 run.
| Figure 9: Pulse saturation |
|---|
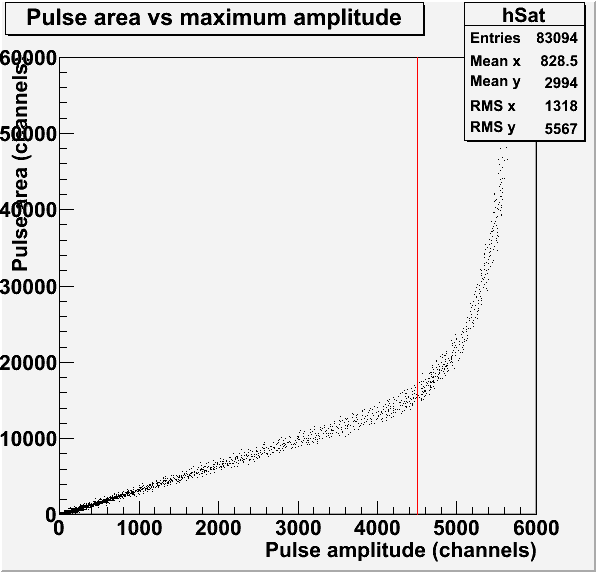 |
The red line in Figure 9 represents the saturation limit of 4500 channels for the pulse amplitude. This pulses used to make this histogram have a baseline standard deviation less than 6. The second peak representing the noisy pulses has been completely swallowed by the noise from the board.
| Figure 10: Pulse maximum amplitude and area |
|---|
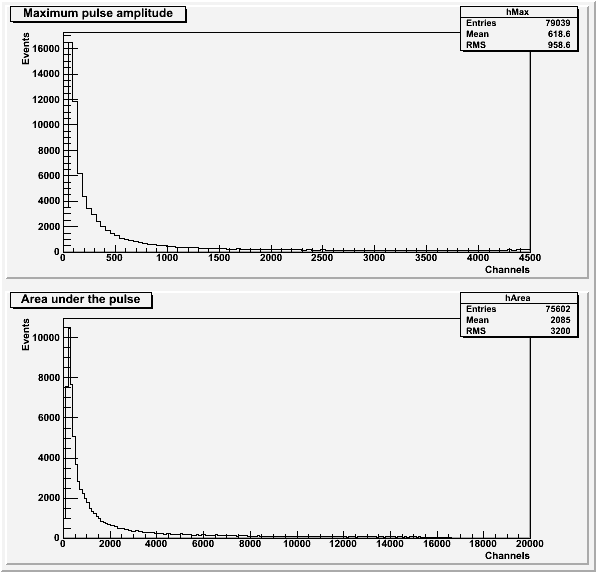 |
Both histograms in Figure 10 exclude pulses with an amplitude greater than 4500 channels or a baseline standard deviation greater than 6. the histogram of area under the pulse also excludes pulses with a secondary pulse before the main pulse.
| Figure 11: Comparison to background. |
|---|
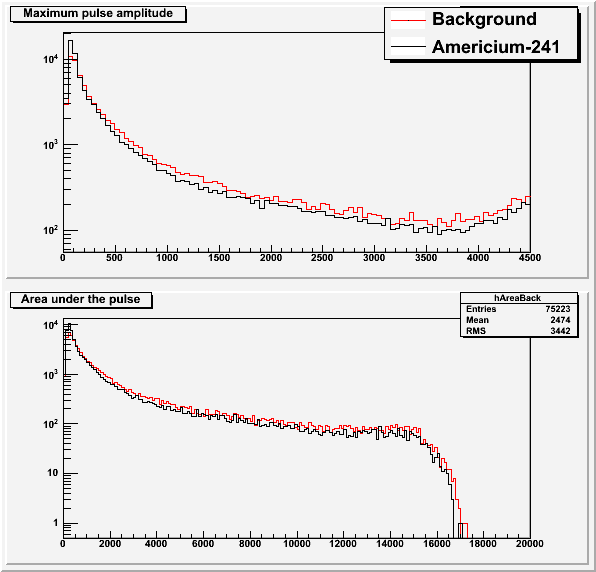 |
The background data is explained in this post. Figure 11, just like Figure 4, seems to suggest that we are not seeing the Americium source with the PMT.