PMT 14 was run with a bias voltage of -1100 V with scintillator 1-66-? and Ce-137 with a copper collimator attached to plastic in the darkroom. The connection to the DAQ board was modified with varying attenuators. Each event was self-triggered with a varying trigger threshold for a total of 100k events.
| Table 1: Data files used |
| Run | Attenuation | Trigger Threshold | Data file |
| 1 | x10 | 8280 | 130910_pmt14_cs137_8230_1100v_x10_x10atten.dat |
| Figure 1: Standard Deviation of the baseline. |
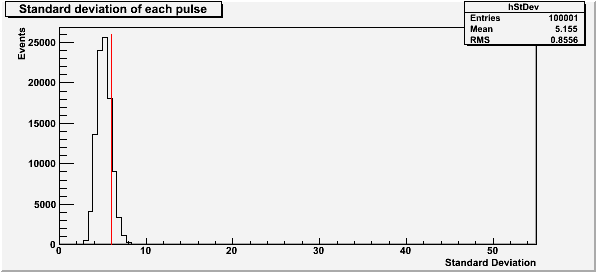 |
The red line at a standard deviation of 6 in Figure 1 is the highest baseline standard deviation allowed in the subsequent plots for the 10x attenuated Ce-137 run.
| Figure 2: Pulse saturation |
| [image not archived: 130999ce13710xattensaturation.gif] |
The red line in Figure 2 represents the saturation limit of 4500 channels for the pulse amplitude. This pulses used to make this histogram have a baseline standard deviation less than 6.
| Figure 3: Pulse maximum amplitude and area |
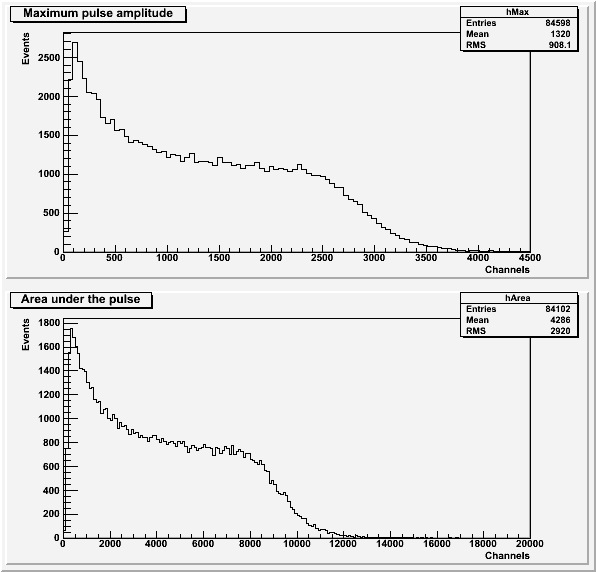 |
Both histograms in Figure 3 exclude pulses with an amplitude greater than 4500 channels or a baseline standard deviation greater than 6. the histogram of area under the pulse also excludes pulses with a secondary pulse before the main pulse.
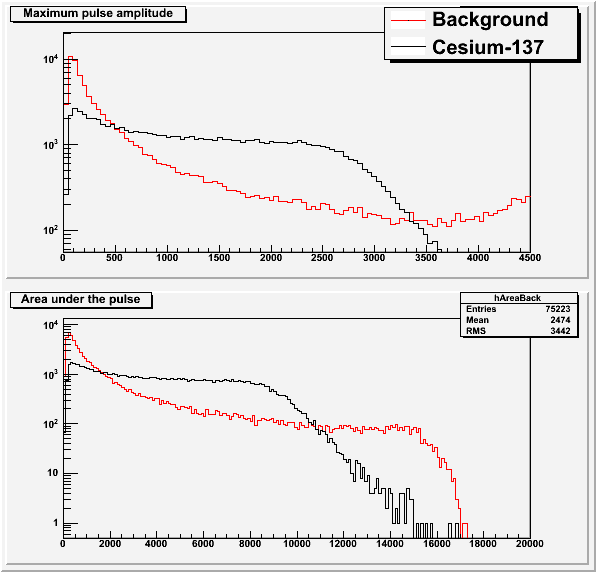
| Figure 4: Comparison to background. |
 |
| Figure 5: Comparison to background (zoomed in). |
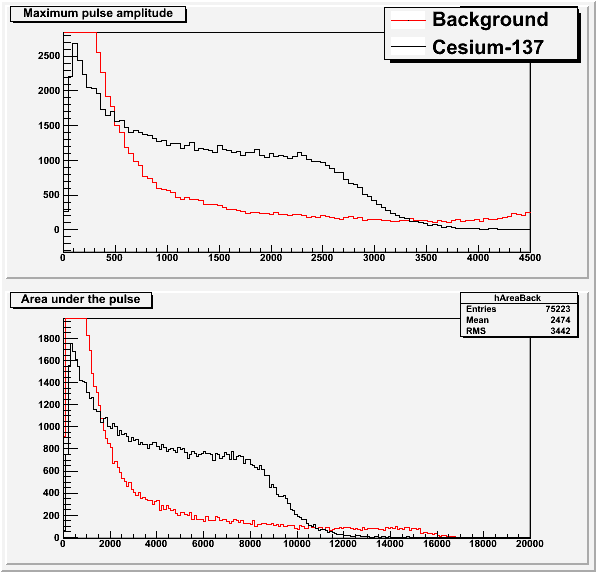 |
The background data is explained in this post.