−Table of Contents
2" Muon Telescope at Varying Biases
Three muon telescope runs were conducted at varying sample PMT biases. The sample scintillator used is the 50 mm long, non-Gadolinium loaded sample named 1-66. The top PMT (1“ PMT 18) was biased at ?? V. The bottom PMT (2” PMT 8575B) was biased at ?? V. The bias of the middle PMT (2“ PMT R1332) was varied from 1800V to 2200V in order to get a rouch energy calibration for the earlier Am-241 runs.
| Table 1: Details about Muon Telescope Runs | ||||||||
|---|---|---|---|---|---|---|---|---|
| Date | Middle Bias | Middle PMT | Channel 2 | Channel 3 | Events | Time | Rate | File |
| 2014/08/01 | 1800 V | R1332 | 8575B | PMT 18 | 8656 | 330908 s | 0.0262 Hz | 20140801_muontelescope.dat |
| 2014/08/05 | 2000 V | R1332 | 8575B | PMT 18 | 12935 | 490098 s | 0.0264 Hz | 20140805_muontelescope_2000V.dat |
| 2014/08/11 | 2200 V | R1332 | 8575B | PMT 18 | 7283 | 277162 s | 0.0263 Hz | 20140811_muontelescope_200V.dat |
Muon Telescope Runs
| Figure 1: Energy Calibration of Middle PMT Area at 1800V |
|---|
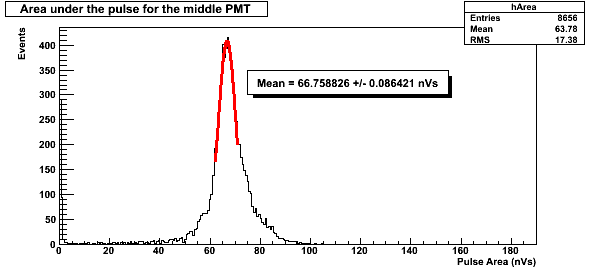 |
The location of the energy peak at 1800V bias was determined to be 66.759±0.086 nVs from a Gaussian fit with a chi-squared of 0.604.
| Figure 2: Energy Calibration of Middle PMT Area at 2000V |
|---|
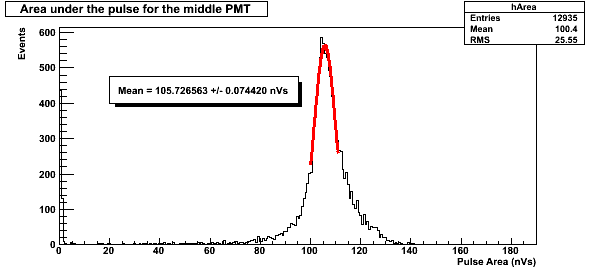 |
The location of the energy peak at 2000V bias was determined to be 105.726±0.74 nVs from a Gaussian fit with a chi-squared of 1.618. A previous 2000V muon telescope run shows an energy peak around 120 nVs.
| Figure 3: Energy Calibration of Middle PMT Area at 2200V |
|---|
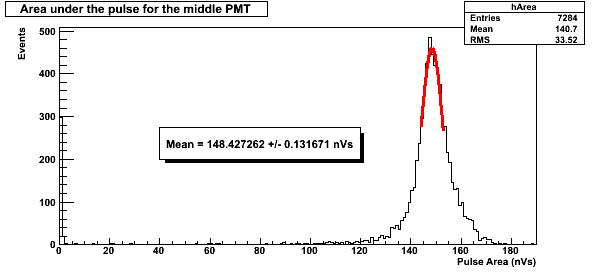 |
The location of the energy peak at 2200V bias was determined to be 148.427±0.132 nVs from a Gaussian fit with a chi-squared of 0.992. All of the errors quoted in this section are from the error of the fit and not the width of the Gaussian.
PMT Response
| Figure 4: Linear Fit of the Energy Peak by Bias Voltage |
|---|
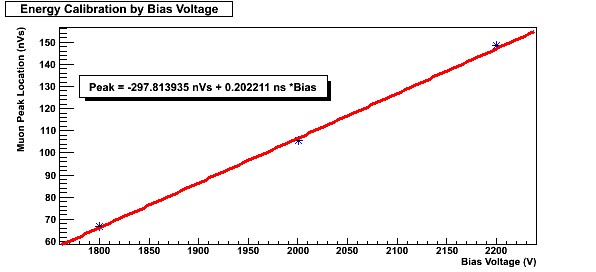 |
From the three muon telescope runs, the linear equation that predicts the location of the energy peak given the bias voltage of the middle PMT was determined to be: Peak = 0.202211 ns * Bias - 297.81394 nVs.
Conversion to Equivalent Muon Energy Scales
Earlier, the energy loss of a muon passing through our scintillator sample was determined to be 5.6 MeV. Assuming a linear response of the plastic scintillator, the pulse area spectra can be converted to an equivalent muon energy scale using the equation Energy (keVme) = Area (nVs) * 5600 keV / Peak Location (nVs).
An earlier entry describes the Am-241 runs takes with four different sized scintillator samples. Below are their converted energy spectra. Each run was taken at 2200 V, so the Peak Location used in the above equation is 148.427 nVs.
| Figure 5: Comparison of each sample length converted to equivalent muon energy |
|---|
 |
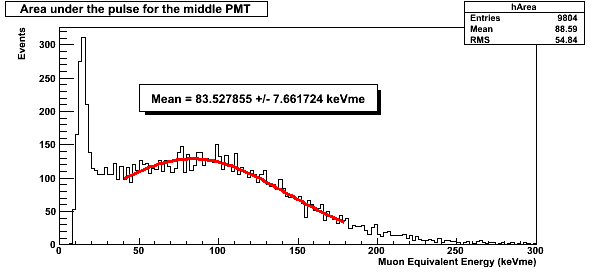
Figure 5 shows a comparison of the spectra from each length scintillator sample after the peak area has been converted to the equivalent muon energy. The spectra in Figure 5 have all been scaled by event rate (number of events / total time). The 13 mm sample has been taken as a representative americium peak to determine the mean muon equivalent energy of the peak, shown in Figure 6, below. The mean of the Americium peak has been determined to be at 83.5±7.7 keV (muon equivalent). The error given is the width of the Gaussian, taken from the simga variable of the Gaussian fit. This energy differs from the expected 60 keV Am-251 peak by 39.2±3.6%, which shows that the assumption of a linear response in the plastic scintillator is probably incorrect.
| Figure 6: Muon Equivalent Energy Peak |
|---|
 |