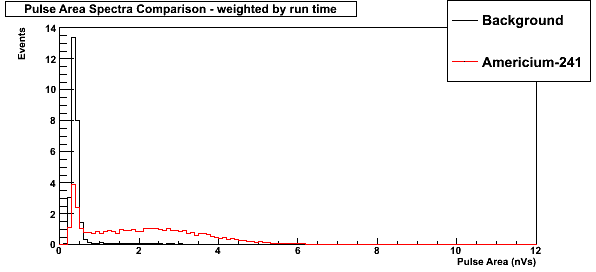
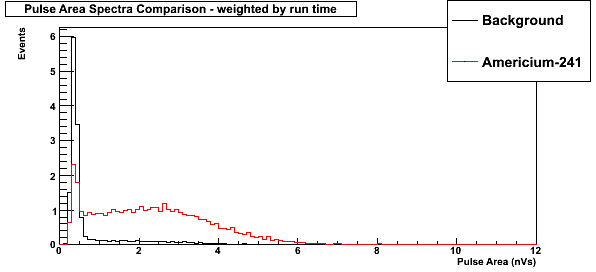
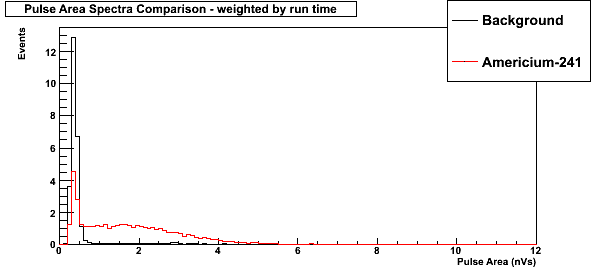
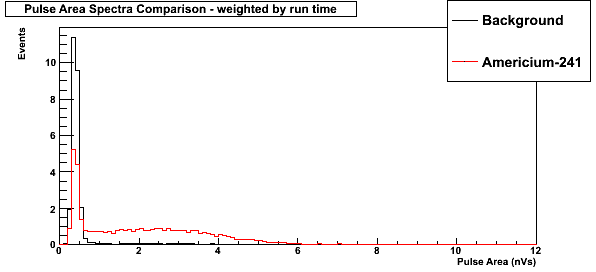
In order to determine the effect of scintillator sample size on the visible energy peak, a single non-gadolinium doped scintillator sample (1-70-2) was machined into three samples of differing length. The shortest was 10 mm thick, the middle 13 mm, and the longest 20 mm. These were compared to a different sample (1-66) of length 50 mm. 1-66 is also a non-gadolinium doped sample. Each run was conducted with 2“ PMT R1332 biased at 2200 V in the new dark room. The details of each run are shown in Table 1, below.
| Table 1: Information about data runs |
| Run | Bias | Sample Size | Source | Number Events | Total Time | Percent Saturated | Data File |
| 1 | 2200 V | 10 mm | background | 10007 | 343 s | 1.249% | 20140731_R1332_10mm-sample_2200V_background_90mV-threshold.dat |
| 2 | 2200 V | 10 mm | Am-241 | 10513 | 245 s | 1.589% | 20140731_R1332_10mm-sample_2200V_am241_90mV-threshold.dat |
| 3 | 2200 V | 13 mm | background | 9998 | 627 s | 3.901% | 20140729_R1332_2200V_background_90mV-threshold.dat |
| 4 | 2200 V | 13 mm | Am-241 | 10005 | 229 s | 2.009% | 20140729_R1332_2200V_am241_90mV-threshold.dat |
| 5 | 2200 V | 20 mm | background | 10061 | 358 s | 1.967% | 20140731_R1332_0.75inch-sample_2200V_background_90mV-threshold.dat |
| 6 | 2200 V | 20 mm | Am-241 | 10032 | 228 s | 1.495% | 20140731_R1332_0.75inch-sample_2200V_am241_90mV-threshold.dat |
| 7 | 2200 V | 50 mm | background | 10062 | 417 s | 1.898% | 20140801_R1332_2200V_scint1-60_background.dat |
| 8 | 2200 V | 50 mm | Am-241 | 10014 | 368 s | 2.087% | 20140801_R1332_2200V_scint1-60_am241.dat |
| Figure 5: Comparison of Am-241 spectra for each size (weighted by peak area) |
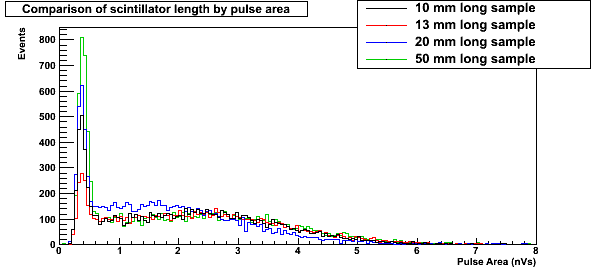 |
The peaks in Figure 5 are weighted by peak area. The area of each peak between 1 and 5.5 nVs has been normalized to match that of the 10 mm run in order to compare the shapes of the spectra. Clearly the length of the sample (from 10 mm to 50 mm) has no affect on the location and shape of the Americium peak. The 20 mm run is not considered to be contradictory to this statement because the condition of that scintillator is much worse than the other samples. The 20 mm sample had considerably worse crazing and cracking along the edges as well as one blemish on the flat surface farthest from the PMT.
| Figure 6: Comparison of Am-241 spectra for each size (weighted by rate) |
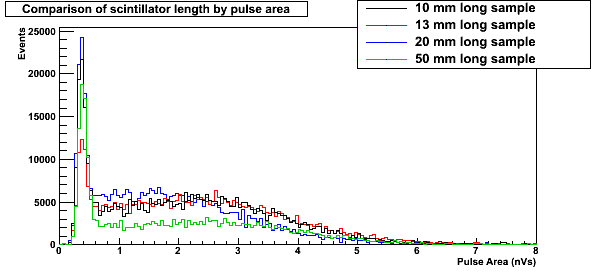 |
The spectra is Figure 6 are weighted by rate (Number of events / run time). Ignoring the 20 mm run for the reasons mentioned above, this shows that as the length of the scintillator increases, the ratio between background and americium events increase. The background peak is comparatively higher for a larger scintillator sample, meaning the americium peak appears flatter, smaller, and more difficult to find.