−Table of Contents
Muon Telescope
PMTs 0 and 3 were placed 6.5 cm apart vertically against the telescope scintillator with PMT 14 between them against scintillator 1-66-?. All PMTs were biased to -1100V. PMT 14 was triggered by a coincident event from PMTs 0 and 3. The coincident event was defined by a threshold of -25 mV with a 70 ns coincident window. The configuration of the telescope scintillator, the total time run, and the number of events varied by trial.
| Table 1: Data runs | |||||
|---|---|---|---|---|---|
| Run | Date | Configuration | Number of events | Total time (s) | Data File |
| 1 | 2013/11/14 | parallel | 754 | 57699 | TEST.DAT |
| 2 | 2013/11/15 | perpendicular | 3261 | 250863 | 1115-1118_cross_1100v_6.5cm.dat |
| 3 | 2013/11/18 | parallel | 320 | 39469 | 1118-1119_parallel_6.5cm_1100v.dat |
| 4 | 2013/11/22 | perpendicular | 1901 | 157812 | 1122-1124_sig1100v_trig1200v_cross_6.5cm.dat |
Muon Energy loss calculation
The equation used for calculating the energy loss of a muon is (this equation was taken from the source listed below):
 ,
where  is the energy of the muon and
 is the distance the muon has travelled.
R. Abbasi, et. al., An improved method for measuring muon energy using the truncated mean of dE/dx, Nuclear Instruments and Methods in Physics Research Section A: Accelerators, Spectrometers, Detectors and Associated Equipment, Volume 703, 1 March 2013, Pages 190-198, ISSN 0168-9002, http://dx.doi.org/10.1016/j.nima.2012.11.081.
The average energy of a muon at sea level was taken to be 4 GeV. The density of polystyrene is  . The diameter of the plastic is 2.10 cm. The equation used to calculate the energy lost as the muon passes through the diameter of our polystyrene scintillator is

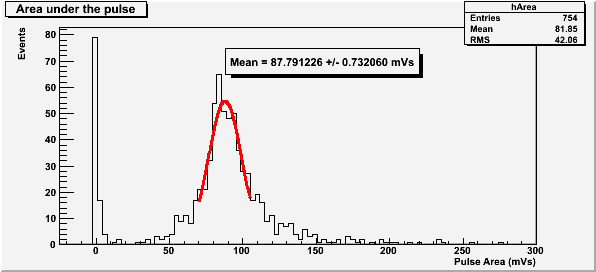
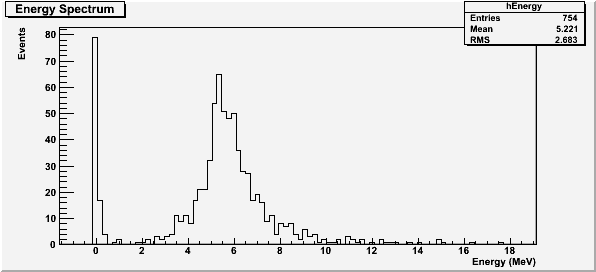
Energy Spectrum of the (long) Parallel Run
| Figure 1: Area under the pulse fit to a gaussian. |
|---|
 |
Energy conversion: 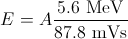 ,
where  is energy in MeV and
 is pulse area in mVs.
| Figure 2: Muon Energy Spectrum |
|---|
 |
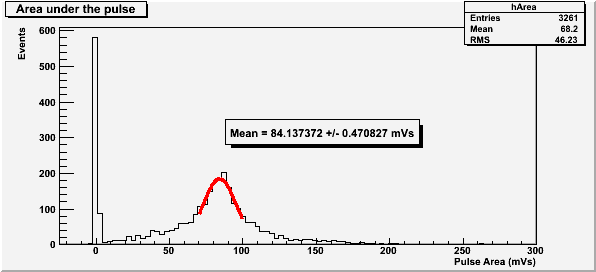
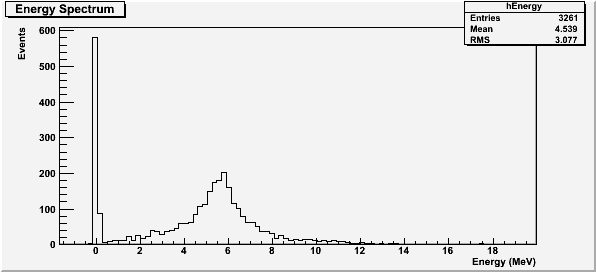
Energy Spectrum of the (long) Perpendicular Run
| Figure 3: Area under the pulse fit to a gaussian. |
|---|
 |
Energy conversion: 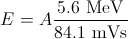 ,
where is energy in MeV and is pulse area in mVs.
| Figure 4: Muon Energy Spectrum |
|---|
 |
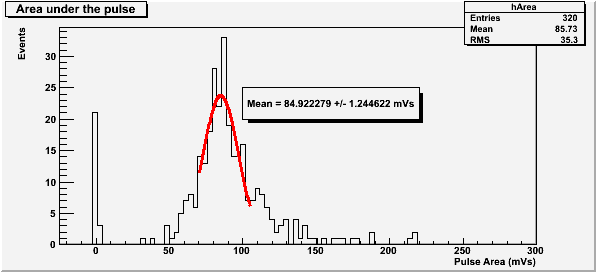
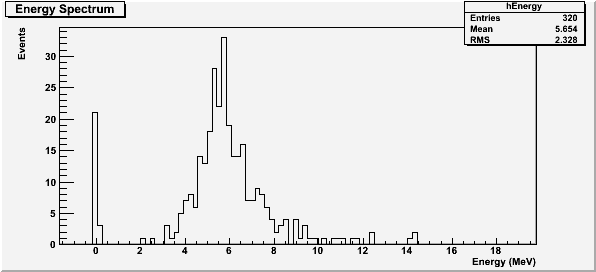
Energy Spectrum of the (short) Parallel Run
| Figure 5: Area under the pulse fit to a gaussian. |
|---|
 |
Energy conversion: 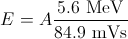 ,
where is energy in MeV and is pulse area in mVs.
| Figure 6: Muon Energy Spectrum |
|---|
 |
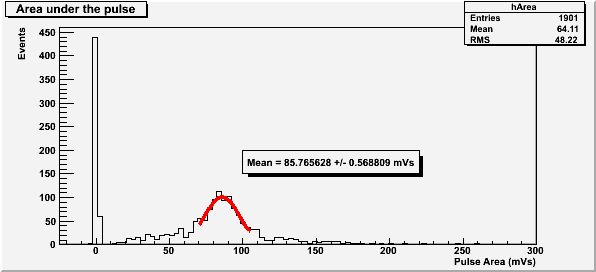
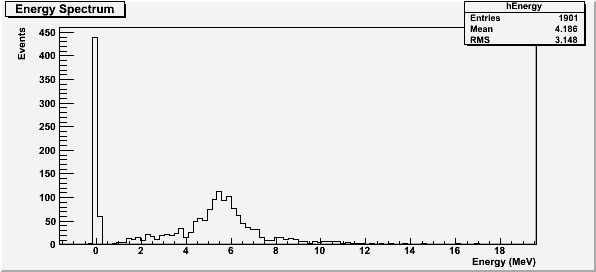
Energy Spectrum of the (short) Perpendicular Run
| Figure 7: Area under the pulse fit to a gaussian. |
|---|
 |
Energy conversion: 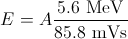 ,
where is energy in MeV and is pulse area in mVs.
| Figure 8: Muon Energy Spectrum |
|---|
 |
Comparison of Zero Energy Events
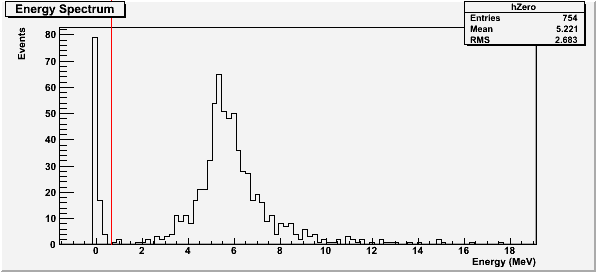
| Figure 9:Calculation of Empty Events for the parallel (long) configuration. |
|---|
 |
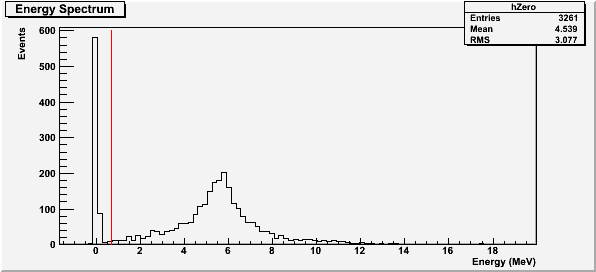
| Figure 10: Calculation of Empty Events for the perpendicular (long) configuration. |
|---|
 |
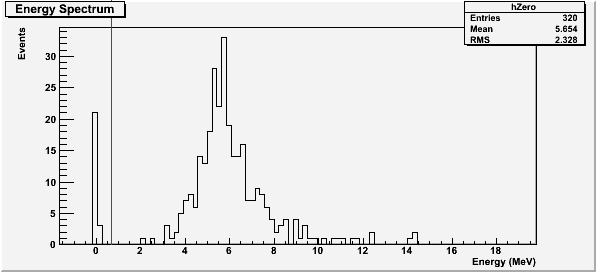
| Figure 11: Calculation of Empty Events for the parallel (short) configuration. |
|---|
 |
| Figure 12: Calculation of Empty Events for the perpendicular (short) configuration. |
|---|
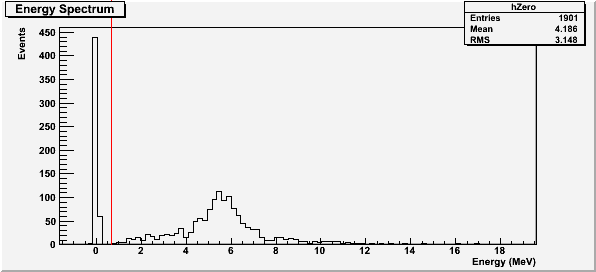 |
The number of empty events was calculated by taking the integral from the far left side of the histogram to the red line shown.
| Table 2: Percentage of empty events | |||
|---|---|---|---|
| Run Configuration | Empty Events | Total Events | Percentage |
| Parallel (long) | 100 | 754 | 13.3% |
| Perpendicular (long) | 679 | 3261 | 20.8% |
| Parallel (short) | 24 | 320 | 7.5% |
| Perpendicular (short) | 503 | 1901 | 26.5% |
Rate Calculation
| Table 3: Event Rate for each Run | |||||
|---|---|---|---|---|---|
| Run Configuration | Total Events | Events less empties | Total Time | Total Rate | Rate less empties |
| Parallel (long) | 754 | 654 | 57699 s | 0.0131 Hz | 0.0113 Hz |
| Perpendicular (long) | 3261 | 2582 | 250863 s | 0.01300 Hz | 0.01029 Hz |
| Parallel (short) | 320 | 296 | 39469 s | 0.00811 Hz | 0.00750 Hz |
| Perpendicular (short) | 1901 | 1398 | 157812 s | 0.01204 Hz | 0.008859 Hz |