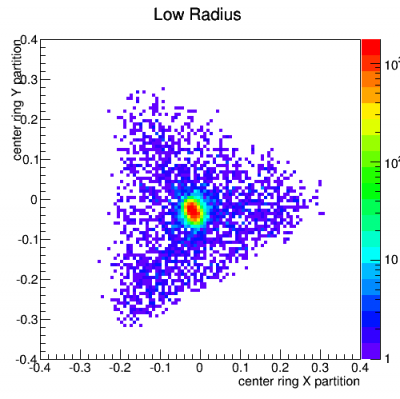
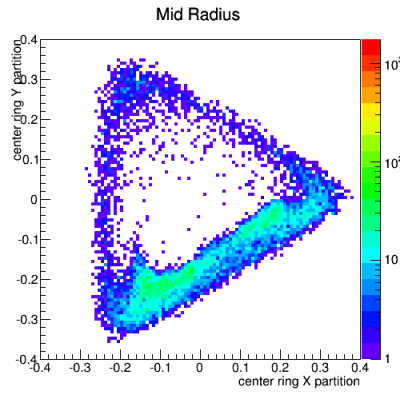
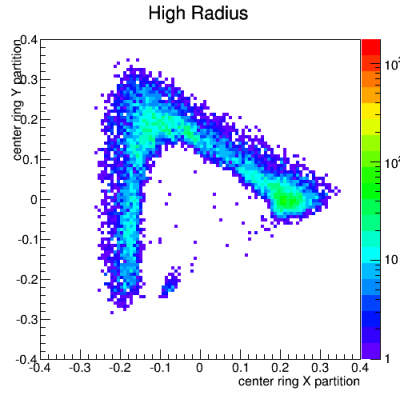
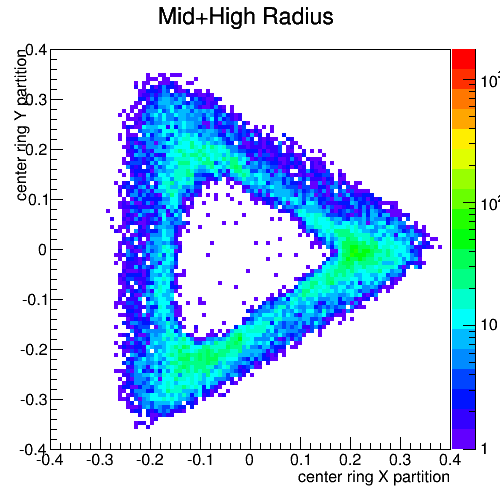
Radial selections in these plots are based only on the center and outer-ring channels A,B,F.
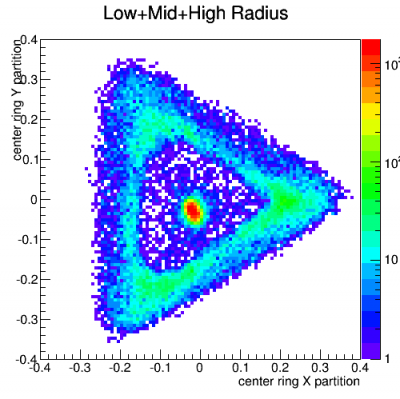
X and Y “partition” quantities were constructed using only the weighted amplitudes in the inner-ring channels C,D,E, and “triangle plots” were made for events from 13-19 keV (where the calibration peaks are) separately for low-radius, mid-radius, and high-radius events.
| Figure 3.7 | ||
|---|---|---|
| x-y plots based on partitioning between the central ring channels, 13 -19 keV | ||
 |  |  |
 |  | |
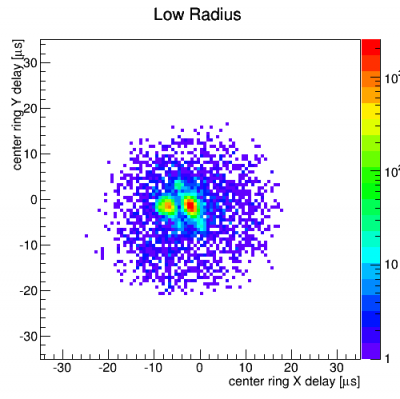
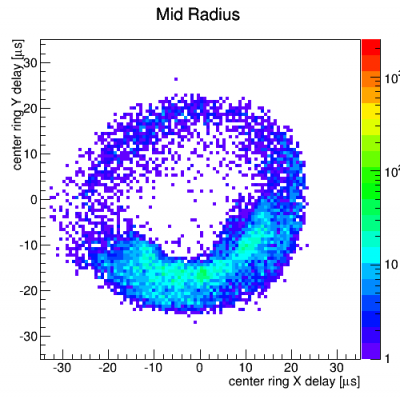
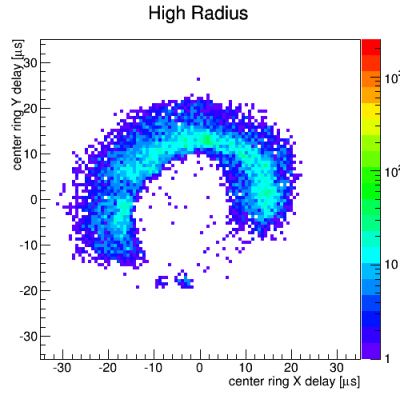
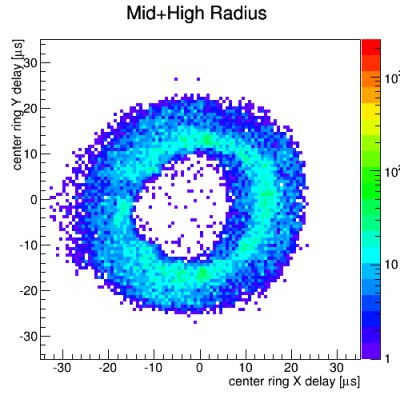
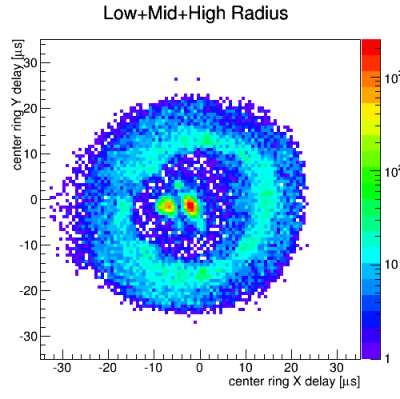
Below the same is done for X and Y “delay” quantities based on the relative timing between the inner-ring channels.
| Figure 3.8 | ||
|---|---|---|
| x-y plots based on WKr30 time differences (delay) between the central ring channels, 13-19 keV | ||
 |  |  |
 |  | |