Table of Contents
Migdal Effect
On 2019 July 11 at the SuperCDMS Collaboration Meeting in Montreal, Alan Robinson suggested that some of the features in our signal spectrum look like the Migdal Effect. The Migdal Effect is a proposed mechanism by which a NR can have anomalously high ionization yield, if some of the recoil energy results in ejecting an electron from the recoiling atom, and thus producing some ER-like ionization. (LUX has used this effect to claim sensitivity to lower-mass WIMPs than they would otherwise be sensitive too.)
Rob Calkins and Dan Jardin wrote a Migdal Effect note to apply to Soudan data. The figure below shows the expected energy spectrum produced by Migdal electrons in the case of a 2.0 GeV WIMP flux:
| Figure 4.5 |
|---|
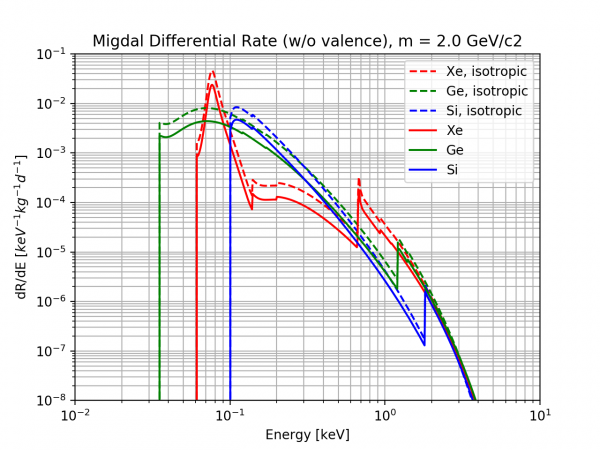 |
Rob and Dan have omitted the case of valence-shell electrons. We see in Silicon two edges where the spectrum suddenly rises, at around 100 eV and around 1.8 keV. These correspond to the L-shell and K-shell binding energies. The recoil energy must at least be above the binding energy of the ejected electron. In the case of energies just above the L-shell binding energy, we imagine that almost all of the recoil energy is used up liberating the electron, and the electron is left with almost zero energy, therefore not contributing to any ionization - but the vacancy in the atom will get filled and an L-shell x-ray will be released, and we will see that energy with yield=1.
The features in our data at 80 eVee and 160 eVee look something like the edges in the Migdal spectrum - a sudden rise on the left and more gradual fall to the right.
There is no reason to have two features, so we'd have to assume that one or the other is the L-shell edge. If we assume it's the one at 80 eVee, it means our calibration at low energies underestimates the true energy. If we assume it's the one at 180 eVee, it means our calibration overestimates - and in that case the implied yield would be in better agreement with previous measurements.
How plausible is this? Here are some points to consider:
- An NR that results in a 100 eVee event in the Migdal case would otherwise have only produced a signal of 10-20 eVee, and therefore would be below our trigger threshold.
- The probability of the Migdal effect is small - I'm not sure exactly how small for the L-shell in silicon, but looking over the literature it's probably something like 10e-3. (or, could be as high as several x 10^-2)
We can estimate based on the observed size of the feature how often we must be getting NR events around 10-20 eVee, and it's a pretty large rate. The plot below shows an estimate as a magenta square superimposed on the rest of the spectrum. (Here I've multiplied the size of the feature by 1000, but maybe it could be an order-of-magnitude lower.)
| Figure 4.6 |
|---|
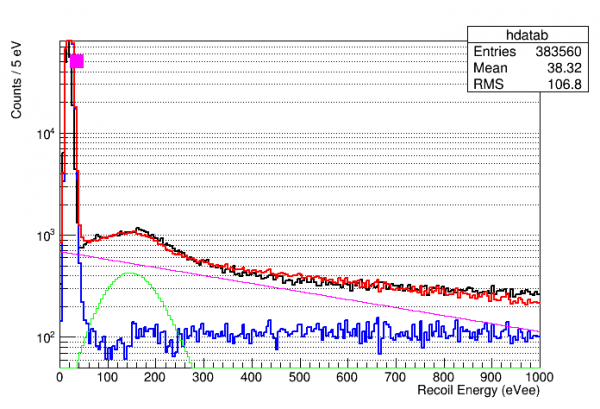 |
| The magenta square at the upper left represents the approximate ee energy and rate of NRs necessary to produce a Migdal feature of the size we see in the data |
The point shown certainly does not look like it belongs on the exponential background. But the rate is not impossible considering the total neutron emission rate and the solid angle of the detector from the source.
In order to produce the necessary 100eV recoil the incident elastically-scattering neutron would need a minimum of 750 eV kinetic energy. So we would need a large flux of neutrons in that energy range.
The followups are obvious:
- Consult the simulation for the spectrum of elastic NRs in the 100-300 eV range or so
- Do the Migdal Effect calculations to see what an L-shell feature should look like.
Implementing the Migdal effect in simulations
The DKM paper has an equation like this:
The first factor on the right is the differential rate of nuclear recoils for a WIMP flux with no Migdal effect assumed. Then they tack on a factor for the probability of a Migdal ionization producing an ejected electron which winds up with kinetic energy E_e.
What's a little confusing here is what is meant by E_r. Is it the deposited energy, i.e. the energy transferred by the WIMP? Or is it the recoil energy of the nucleus? With no Migdal effect these are the same thing. But if there's a Migdal electron ejected the total E_dep gets split between the nucleus and the energy required to eject the electron plus the electron's kinetic energy (this sum is later referred to as E_EM).
In a later equation they calculate the minimum WIMP speed necessary for a given combination of E_r and E_EM, and it is quite clear at that point that E_r refers to the nuclear recoil energy, which is necessarily less than E_dep if there is a Migdal ionization.
In describing the equation above the authors say it is the rate for a nuclear recoil of energy E_r “to be accompanied by” an ionisation electron with energy E_e.
The above seems strange to me, because on an event-by-event level, it seems like they take a non-Migdal nuclear recoil, then determine the probability for a Migdal ionization with a particular energy… which would then be “extra” energy. Certainly for a single event this is not the intuitive way to think of it. I would think you'd approach it as 1) WIMP collides with nucleus with a certain E_dep 2) if a Migdal ionization occurs, E_dep is split up between E_r and E_EM. But of course they are not treating it event-by-event, so I assume it's done correctly for a differential rate calculation.
The Migdal differential probability is a function of the velocity of the Migdal electron “in the rest frame of the nucleus immediately after the scattering process”. The expression they give is equivalent to the expression below:
Again it is a little counter-intuitive to use E_r here instead of E_dep. This is because the cartoon description provided implies a process that occurs in steps: 1) a WIMP collides with a nucleus transferring E_dep 2) the nucleus recoils with a speed corresponding to E_dep, while the electrons remain stationary 3) as the electrons get pulled along, a Migdal ionization may occur, after which the energy of the nucleus is necessarily reduced to E_r = E_dep-E_EM by energy conservation. So it would seem that the relevant velocity that the electron “sees” before Step 3 would be calculated based on E_dep. And yet they use E_r. Again I don't know that it's incorrect - could be either that I'm not thinking of it right, or that DKM's explanation is misleading.
The dependence of the probability on the electron relative velocity is simply linear, so the original paper produces probability lookup tables for a reference velocity (c/1000). From those lookup tables the probability for any electron velocity is simply
Jake generated a single lookup table for silicon which combines all of the electrons and tabulates it for E_EM, which is E_e plus the binding energy. E_EM is what we really want to know since this is the energy that presumably produces a yield=1 charge signal.
For the purposes of predicting a Migdal signal given a simulation of nuclear recoils (for the Run68 analysis, either elastic neutron scatters or gamma-emission recoils) we'd like to have an expression for the probability of a given E_EM for a given E_dep. So it seems like we should do the following:
This seems logically correct - I'm using E_r rather than E_dep, and I assume that the E_dep provided by the simulation does not change, i.e. the differential cross-section of the WIMP-nucleus or gamma-nucleus interaction is unaffected by the presence or absence of the Migdal effect. But my confusions leave me uncertain as to whether this is definitely a valid way to apply the Midgal probabilities.
Migdal numerical simulations
The Migdal effect is a hypothetical process in which a nuclear recoil in a detector could release an energetic electron. In that case, a purely NR event would be transformed into a combination event, with some of the deposited energy producing ionization characteristic of NR yield, while the rest produces ionization characteristic of ER yield.
The probability of the Migdal effect is somewhat small but it may have an observable effect on our spectrum. It would tend to move some NR events to higher observed energies, and it's possible that it would produce features. It is more likely to produce spectral features (like peaks) when it occurs in (n,gamma) events. It probably won't produce anything interesting for the elastic neutron collision spectrum.
The figure below is a first, crude attempt to simulate the Migdal effect as applied to simulated (n,gamma) data. The (n,gamma) simulation used was presented from Anthony on 1 Feb 2020.
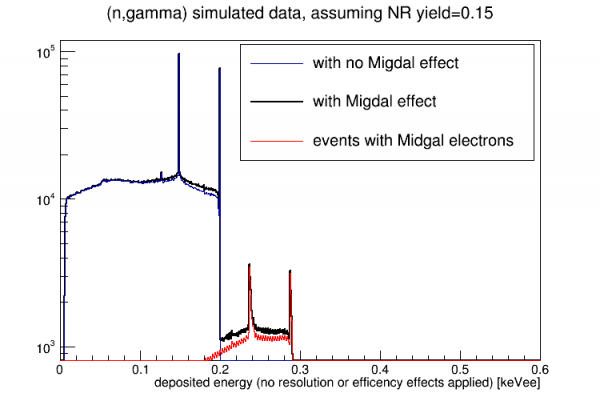
The plot above contains several inaccuracies:
- A constant NR yield of 0.15 is applied rather than something energy-dependent.
- I used the total deposited energy of each event to calculate the production of Migdal electrons. However most of the events involve multiple, separate nuclear recoils. The Migdal effect should be calculated separately for each NR in an event.
- I show a total observed spectrum, combining non-Migdal and Migdal events. But the non-Migdal spectrum includes all events - instead I should be removing events which have produced Migdal electrons.
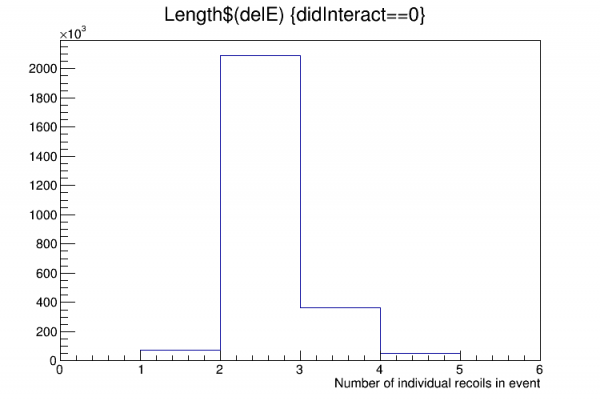
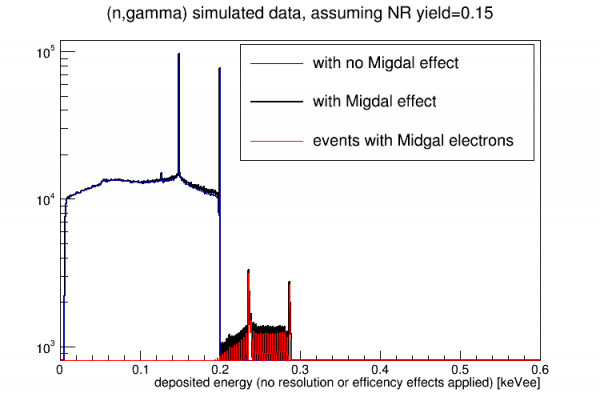
The plot above is an improvement: it uses individual deposited energies, although it only includes 1-recoil and 2-recoil events (that's most of them). This is still not quite right though - I should use the initial recoil energy, not the deposited energy. This still assumes a simple constant NR yield f 0.15.
 |  |
A better approach is to do a Migdal monte carlo simulation. Step through the (n,gamma) events, and for each individual recoil calculate a random Migdal electron energy (0 if there is no Migdal emission). Fill a new Root tree with the Migdal energies. Then this can be friended to the (n,gamma) tree. Then in analysis any desired yield function can be applied.
Migdal Monte Carlo simulation
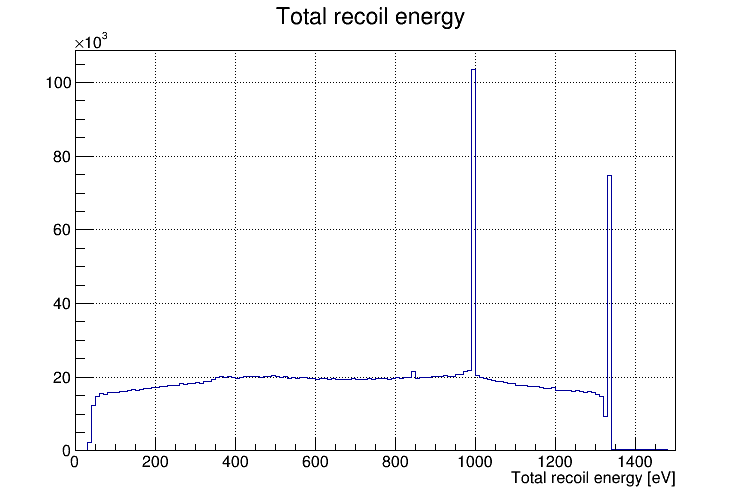 | This is recoil energy from (n,γ) events from the 1 Feb 2020 update of Anthony's simulation. The two prominent peaks are from cases where the recoiling nucleus comes to a stop before another recoil occurs. The peak at 991 eV is events with two recoils, one at 961 and one at 30 eV. The peak at 1331 eV is from events with a single recoil. |
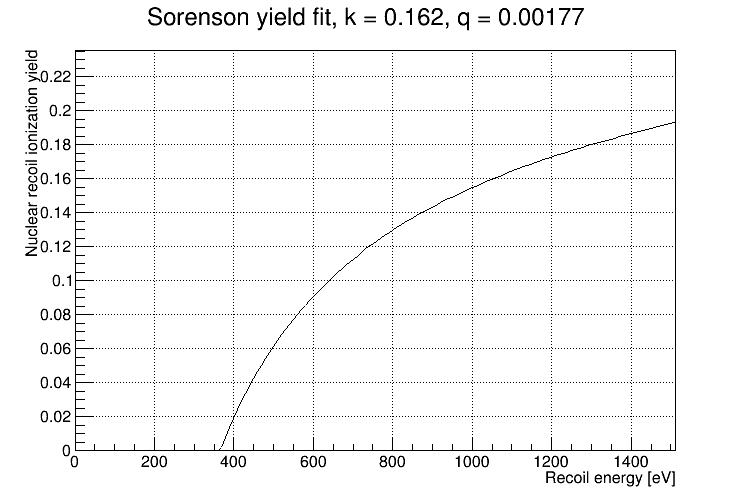 | This is one of the yield curves produced in Nick's MCMC fits to the observed data. This one uses the Sorenson formula and produces one of the best fits. Below 366 eV the yield falls to zero. |
 | Here the Sorenson yield curve is applied to the spectrum to show the observed electron-equivalent energy spectrum. |
 | I applied a Migdal effect Monte Carlo to the output from Anthony's (n,γ) simulation. Each NR has the potential to eject a Migdal electron. In such events the electron-equivalent energy is a combination of NR and EM. Three new “Migdal peaks” occur. These are reflections of the NR peaks, including the “peak” near zero energy corresponding to NRs below 366 eV which produce no ionization. The Migdal peak is produced when a NR in one of the peaks is accompanied by a Migdal electron ejected from the L-shell with very little kinetic energy - the additional EM energy comes from the x-ray emitted when the L-shell vacancy is filled. |
 | To explain the non-observation of the NR peaks in the data Nick's MCMC fit assigns a large nuclear-recoil Fano factor. Here I have applied one of his fit values (F=9.17) to the simulated (n,γ) in the no-Migdal effect case. |
 | Here the Fano smearing has been applied to the simulation with the Migdal effect included. A much smaller Fano factor of 0.6111 is used for the EM energy - this comes from an empirical resolution curve taken from Am-241 calibration data. Two of the Migdal peaks are smeared away because they represent the sum of a low-resolution NR peak and a higher-resolution EM peak. But the lower peak, near 110 eV, survives, since this is the sum of near-zero NR energy and the higher-resolution L-shell peak. |
 | This is a direct comparison of the no-Migdal case with the Migdal simulation result, with yield and Fano effects included. Several ER Fano factor values are compared, representing a plausible systematic range. |
 | Here Nick's simulated trigger efficiency is applied. |
 | Here the baseline resolution is applied. |
 | Here the energy-dependent analysis cut efficiencies have been applied. This represents the final simulated (n,γ) spectrum, comparing the Migdal simulation to the no-Migdal case. The peak is still prominent. Note: this 110 eV Migdal peak would also arise from the elastic NR simulation, which would also have a “peak” of low-energy NRs which produce zero ionization. So we could expect the final Migdal peak to be stronger. |
The simulated Migdal peak at 110 eV looks kind of similar to a peak in the observed data sitting on top of a broader feature, at 170 eV. Could the observed peak be the Migdal peak? The width is about right, but the location is wrong - which could mean that our ER calibration is not very accurate at low energies. Recall that this calibration is based on the Am-241 spectrum with the lowest peak at 8 keV.
I saw another hint of the low-energy calibration being wrong (in the same direction) some time ago, looking for the L-shell Compton step in Na-22 data, which also appeared to show up at too-high an energy. (This apparent step feature disappeared after we improved analysis cuts.)