Pulse Shape Analysis Summary
*Motivation* This is a summary of the pulse shape analysis done on the run 62 HVSi detector. This was originally done as a way to gain some analysis experience but is turning into a full fledged project with the addition of a movable source and the detector monte carlo (DMC) simulations. The idea is based entirely on position reconstruction. If we can use a calibrated signal with a known position and compare the shape of pulses in individual channels, we should be able to back out some physics and gather some positional information about all pulses, not just the calibrated ones. As stated, we need more for this to truly work, and in general it would best to proceed with the help of either the DMC or a movable source.
*Data* I took data from the HVSi run 62 set and used mostly high volt data (50V for this run) and then a small amount of insight into 2-sided data. The results can be found here for the normal 50V data and here for the 2-sided data.
The jist of the data is as follows. The 50V data is a general plot of rise time vs. fall time for peaks that pass certain criterion. In general, the criterion chosen for run 62 was that the peaks were centrally located as in PFINTall/PTINTall is large compared to the noise body and picks out the americium peaks. The plots of rise time vs. fall time are based on the amount of time it takes a peak to rise to 80% of it's max height and then fall 80% below max height.
After finding generalized pulse shapes I decided to look into more stringent energy cuts. After calibrating to the 60 keV line I applied a cut to select various energy bands and I plotted them for each channel. In general here the data is a spread with higher energy events trending towards shorter rise time and longer fall time (consistent with larger peaks/peaks the rail). The most interesting take away from here is the plot on PF where the Americium peaks are focused. Interestingly both the 60 keV cut and the 12-25 keV cut have a dense band of events which appear to be absent from the other channels and is likely from the Americium peaks (this is backed up by applying cuts to the peak location and outside the peak location and in doing so you can cause the band to appear or disappear).
| Figure 1: 60 keV PF cut with and without the 60 keV lines |
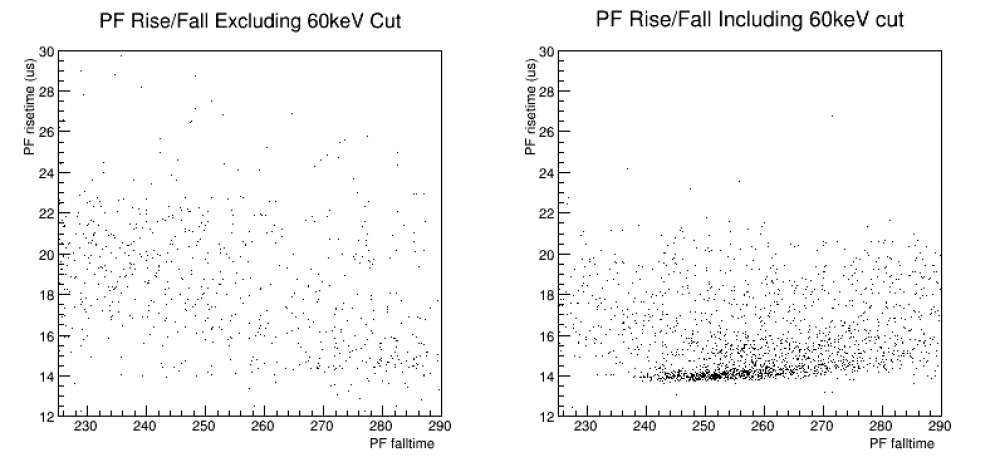 |
With this in mind, we have a metric to at least find the calibration pulses in the main channel in which they occur. The clear next steps here would be to verify this data with DMC and to compare how this behaves in different channels. Once we know how other channels react to pulses in both their channel and other channels we can move forward to better understand exact position reconstruction. Unfortunately, I am again gated by having a lack of information about what the shapes of the pulses in the other channels actually mean. So, instead of being stationary, I tried looking at 0V data, but the Am peaks weren't super clear so I moved onto 2-sided 0V data.
With the 2-sided data I decided to look at something a bit different and took a general look at trends of energy with respect to pulse shape. The only cut's I implemented where energy cuts in order to limit the overall energy range, keeping only events in the 10-400 keV range. Overall, is mostly as expected. As energy increases, pulse shape trends towards longer fall time but there appears to be some events in a lower blob that we aren't entirely sure what they are exactly from and why their energy is different from the rest. In general, this again shows a similar trend as above, as energy of an event increases so does the fall time but this doesn't necessarily lead to some interesting physics.
| Figure 2: Two Sided data with energy spread for PTotal |
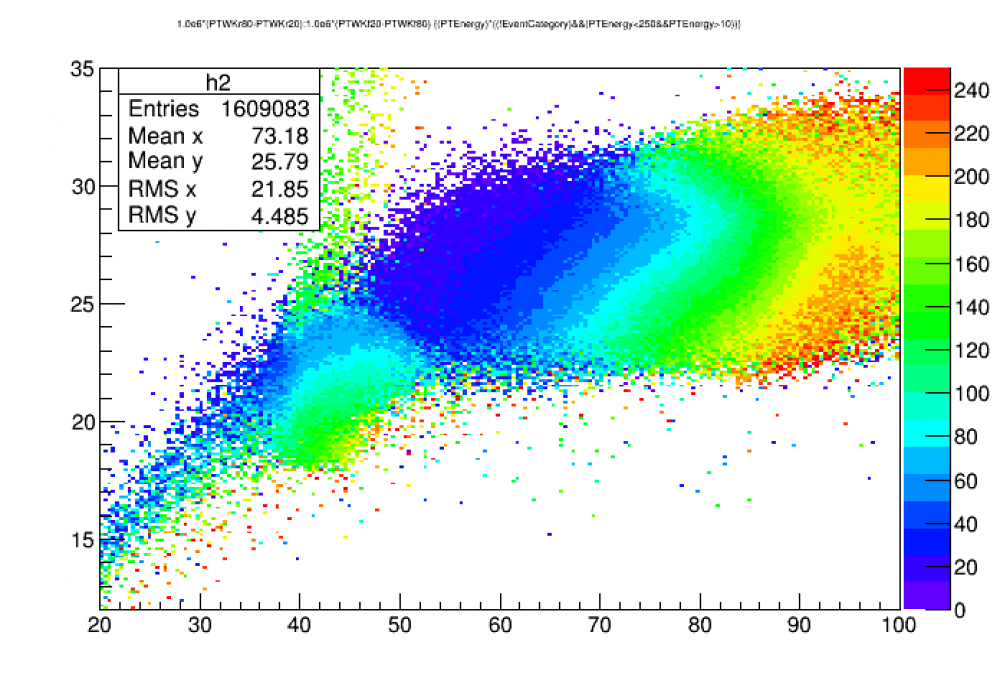 |
*Discussion/Conclussions* Overall it appears as though the data has a few trends that seem to be expected. The data trends towards higher energy being longer fall times and shorter rise times. This could have to do with a simple increase in pulse size and it could have a lot to do with railing of channels, particularly at higher voltages. The trends seems to be fairly spread out in terms of fall time but the main chunk of the data is much more focused in terms of rise times (again, likely due to channel railing). The questions now become what is the best course of action moving forwards. In general, it's going to be combining what has already been done here and by Nick in older Germanium data to both DMC and future data with a moving source. The questions that need to be answered are as follows:
- Are these trends universal? Does the data appear different for different channels and how do these trends behave with 0V or even higher volt data
- Can we use the pulse shapes to determine locations of events based on calibrated events in various channels?
- Do the Am peaks cluster in other channels as well as the central channel if the source is moved? Can we infer anything important from this clustering?
- What is the best way to quantitatively analyze how these pulse shapes compare to future runs and DMC data?
- Can we extend what we learn on these detectors to the other detectors and compile a comprehensive and physically meaningful set of data and pulse shapes?