Table of Contents
Run 39
Setup
| Table 1: Run 39 setup | |||
|---|---|---|---|
| Detector | G106a | ||
| Tower | T1 | ||
| DIB | 1 | 2 | 3 |
| Face | 2 | 5 | 6 |
| Side coax | ZB1-4-4 | ZB1-4-6 | ZB1-4-8 |
| SQUET | ZC70 | ZC13 | ZC23 |
| Stripline | #27 | #19 | #20 |
| Readout | DCRCv3 | ||
| Sources | 1 Am-241 disc above Ch. B1 (D2PA) & 1 Pb-210 disc | ||
The same source holder plate used to test G101b (100 mm spiral mask) in Runs 36 & 37 was mounted facing Side 1. The source holder plate allows for the installation of one Am-241 source and the Pb-210 disc. The Am-241 source was mounted such that its collimation hole lay above Phonon Channel B1 (DIB 2 Channel A).
Although the intial purpose of this run was to investigate surface event rejection using the Pb-210 source, the best base temperature that could be achieved was 87 mK (89 mK with DCRCs plugged in). As this lay above all phonon Tcs, it was not possible to achieve this goal. An investigation into the reasons for the high base temperature has borne some fruit and the next best course of action is to run an empty fridge with the 600 mK rod removed.
However, it was possible to run ionisation measurements to investigate the charge collection efficiency as a function of bias (ie. electric field strength across the crystal). Rather than investigating charge collection efficiency at the surface, the main purpose of the measurements presented here is to make this measurement over the bulk. This is achieved by looking for the 60 keV line on Side 2 rather than using a Ba-133 source to probe the bulk as has been done in the past.
Apart from the problems with achieving a sufficiently low base temperature, this run was also plagued by electrical issues. All problems faced are briefly discussed here.
Electrical Issues
Shorts on Candy (stripline based on MIT design)
During this run, it was intended to test the stripline based on the MIT design, which has been nicknamed Candy. Unfortunately, this was not possible as electrical checks showed that two pairs of wires had shorted. The traces affected were both Cu-Be pairs: SQUID Bias B & SQUID Return B; and Qo Source & Qo Drain. Measurements with an ohmmeter indicated that both shorts lay in the vicinity of the bottom heat sink. It is possible that this occurred during installation or thermal cycling as the wires are pressed together tightly with copper heat sinks in this position to ensure good thermal contact.
It was debated whether a repair should be attempted. However, it was decided that such a repair would take a considerable amount of time and may not be possible in its current position. Although easy to reach, the kapton tape would have to pulled back without removing the insulation, the wires would have to be closely inspected to determine the point of shorting and the pairs would have to be untwisted. Additionally, if the repair was successful, a MDM 51-pin connector must be soldered onto the ends of the wires, which would delay cooldown by a couple of days.
Repairing Stripline 27
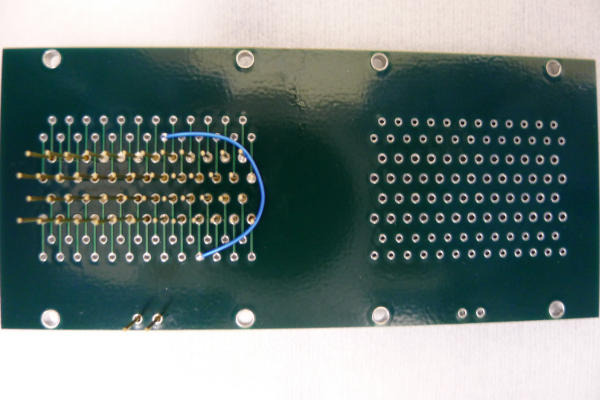
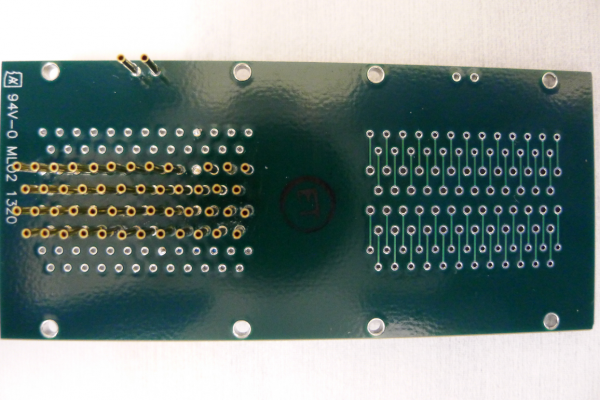
Fortunately, an easier option existed to combine Striplines 27 & 21. However, it was decided that as only Feedback Coil C was the only important trace severed on Stripline 27, using Stripline 21 to carry only one trace was a poor use of resources. As a result, one of the QET Return C lines on Stripline 27 was sacrificed and the Feedback Coil C signal from the SQUET card was diverted up this line using a PCB originally designed to plug into two striplines at the cold end. As shown in Fig. 1, a 30 AWG wire was used to short the pins belonging to the QET Return C line in question and Feedback Coil C. The pin corresponding to QET Return C on the PCB was cut such that it could not come into contact with the SQUET card due to the fact that the QET Return pins for each phonon channel are shorted to each other on the SQUET card.
| Figure 1: PCB at Cold End to divert Feedback Coil C trace up QET C Return line. |
|---|
 |
 |
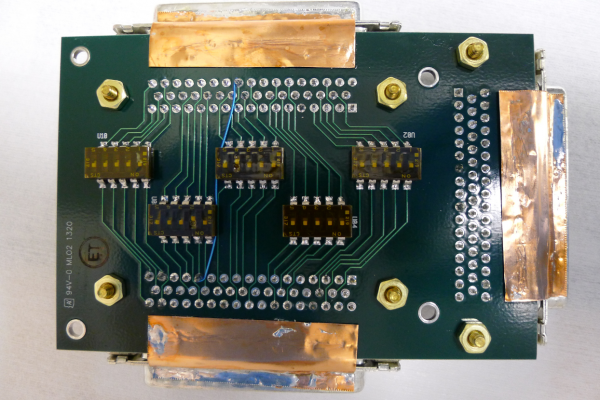
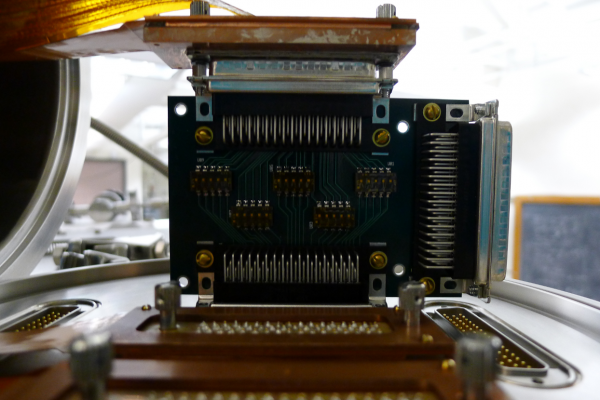
Upon reaching the warm end, another PCB, shown in Fig. 2, was placed inside the ebox (vacuum side) to divert the Feedback Coil C trace back to its correct pin before the signal hit the DCRC. This was achieved by wire-wrapping a 30 AWG wire around the corresponding pins on the D-sub 50 connectors that plugged into the ebox feedthrough and stripline. Dabs of solder was added to ensure good electrical contact. Switches for the traces in question were set to the off position, breaking the original circuit to avoid any complications that may arise should these lines come back to life during cooldown.
| Figure 2: PCB at Warm End to divert trace back before hitting DCRC. |
|---|
 |
 |
It is intended to investigate whether the addition of these PCBs has led to an increase in noise by acquiring PSDs. If any added noise is at an acceptable level, this arrangement is a possible solution to bringing Qo bias back to life on Stripline 20.
Shorts to Ground
Shorts to ground between the QET Bias and QET Return lines were found when conducting electrical checks during cooldown. These shorts were capacitive in nature, implying that they ran through the crystal. This would imply that the Qi & Qo Bias lines should also be shorted to ground, however this was only found to be the case for DIB 1. The feedthroughs on the ebox flange were cleaned with isopropanol and dried with nitrogen gas while at room temperature before evacuation to remove any possible debris that could be causing these shorts. This successfully reduced the conductance to ground between these channels to <2 nS. However, this is still higher than usual.
This is not the first time such shorts have been witnessed when testing 100 mm IZIPs. However, it is not a common occurrence. In past runs, the shorts disappeared after cooling down, so it was decided to carry on due to the low conductance. At liquid nitrogen temperatures, the shorts did indeed disappear. However, they reappeared at liquid helium temperatures, and were present at base temperature.
Due to our poor base temperature, it is unknown if these shorts to ground, of the order of 2 nS, have caused any problems as only the phonon channels are affected. The shorts to ground between Qi & Qo bias on DIB 1 have disappeared.
Problem with DCRC33
It looks as though DCRC33 has developed a fault. It was initially plugged into DIB 2 (Stripline 19), and while setting up the DAQ configuration files, the board started triggering on what appeared to be logic pulses in the charge channels. Qo was the first to start displaying these pulses, followed shortly by Qi. The frequency of these pulses slowly increased until eventually, the trigger rate went crazy.
Multiple soft and hard resets of the board had no effect. If anything the situation worsened as the charge traces eventually flatlined. Turning on the FET ehater seemed to work only for brief periods of the order of half-a-second. A quick electrical check with the breakout box showed no signs of a problem. This was confirmed when DCRC31 was plugged into DIB 1 (Stripline 19), as the charge traces remained stable, pointing the finger at DCRC33.
DCRC33 will be tested again while at base temperature towards the end of the run in an attempt to recreate the problem. Additionally, a bench test will be performed before returning the board to Fermilab to hopefully provide Sten with more than enough information to diagnose and repair the fault.
Cryogenic Problems
High Base Temperature
As mentioned above, the lowest base temperature achieved during this run was 87 mK (89 mK with DCRCs plugged in). An investigation into the possible reasons for the poor base temperature was launched. The still pressure was measured to be 55 μbar, which was rather low. Therefore, the first port of call was to determine whether the still was running dry by adjusting the still heater and measuring changes in both the still pressure and temperatures of the stages. The results are summarised in Table 2.
| Table 2: Measurements of Temperatures and Still Pressure as functions of Still Heater Power | |||||
|---|---|---|---|---|---|
| Still Heater Power [mW ± 0.05 mW] | H35 Thermometer [mK] | Still pressure [μbar] | Still Thermometer [kΩ ± 0.01 kΩ] | Cold Plate Thermometer [kΩ ± 0.01 kΩ] | Mixing Chamber Thermometer [kΩ ± 0.1 kΩ] |
| 0 | 86.9 ± 0.05 | 55 ± 2.5 | 4.59 | 9.26 | 23.3 |
| 2 | 101 ± 0.5 | 80 ± 2.5 | 4.42 | 9.75 | 20.4 |
| 3 | 105 ± 0.5 | 90 ± 2.5 | 4.40 | 9.77 | 19.8 |
| 4 | 109 ± 0.5 | 100 ± 5 | 4.38 | 9.78 | 19.2 |
| 5 | 111 ± 0.5 | 110 ± 5 | 4.37 | 9.77 | 18.9 |
| 6 | 115 ± 0.5 | 120 ± 5 | 4.35 | 9.80 | 18.4 |
| 7 | 118 ± 0.5 | 140 ± 5 | 4.34 | 9.79 | 17.9 |
| 8 | 122 ± 0.5 | 150 ± 5 | 4.33 | 9.78 | 17.4 |
| 9 | 125 ± 0.5 | 160 ± 5 | 4.32 | 9.79 | 17.1 |
As expected, increased power to the still heater resulted in a higher still pressure, translating to a greater circulation rate. As a reult, the cold plate cooled. Increasing the power to the still heater above 2-3 mW did not result in any significant change in the temperature of the cold plate. However, warming the still increased the temperature of the mixing chamber. This is rather surprising due to the colder temperature of the cold plate. A colder cold plate would mean that cooler He-3 would enter the mixing chamber, and coupled with the increased circulation rate should result in a lower mixing chamber temperature.
One possible reason for this is thermal contact between the still and mixing chamber. Such contact cannot be through the tower due to the presence of the 100 mK heat sink that lies between the 30 mK (mixing chamber) and 600 mK (still) temperature stages and is thermally anchored to the cold plate. If there was thermal contact through the tower, the cold plate's temperature should also increase with the still and mixing chamber. This is indicated by the following:
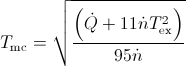
where T_mc is the temperature of the mixing chamber, T_ex is the temperature of the incoming He-3, n_3 is the circulation rate and Q is the cooling power. This is derived from the following:

where H_3 is the enthalpy of pure He-3 and H_3,d is the enthalpy of He-3 in the dilute phase. Please see F. Pobell, “Matter and Methods at Low Temperatures”, 3rd edition, Springer, 2007, ch. 7.
The most likely culprit is the 600 mK rod that extends from the still to heat sink the 600 mK stage on the tower. On its journey, the rod does pass very close to the 30 mK stage that is thermally anchored to the mixing chamber. Although there is no thermal contact at room temperature, the cans and rod do move around during cooldown and it is possible that the 600 mK rod is in contact with the 30 mK stage at base temperature.
A simple way to determine if this is true is to remove the tower, 30 mK & 100 mK cans, and 600 mK rod from the fridge. Cooling down an empty fridge and repeating the aforementioned test would help to determine if indeed the rod is to blame. While this test is performed, holes can be drilled into the 600 mK rod to mount polyethylene spacers in an effort to prevent contact at base temperature.
Additionally, it is intended to perform a single-shot test towards the end of this run to determine whether the phase boundary does indeed lie within the mixing chamber. Single-shot have been performed during this run, but the results have been inconclusive.
Charge Collection Efficiency
G102a (4Q device)
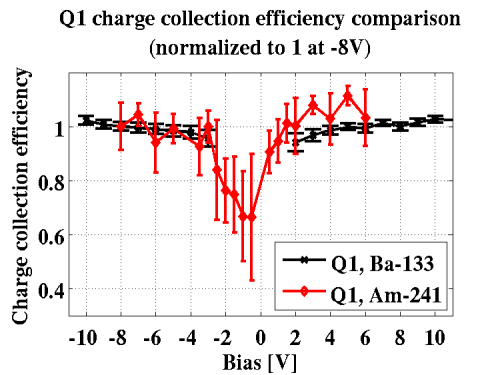
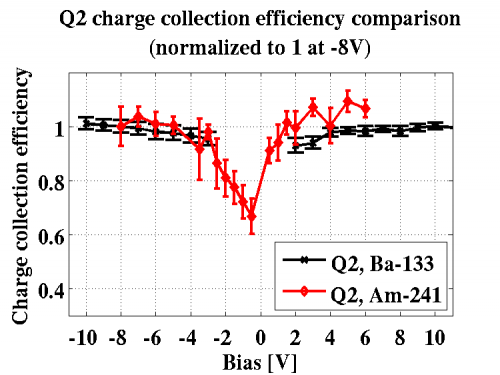
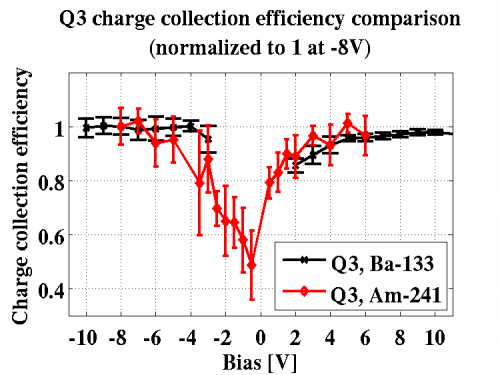
A quick aside. Charge collection efficiency was measured with G102a, a Umicore 4Q device, both with Am-241 and Ba-133 sources. The 4Q device features four electrodes on one face of the crystal, and a single electrode on the opposite face that grounded. The device features the ability to bias each of the four electrodes independently, and these electrodes are patterned as concentric rings. The surface area covered by each electrode is constant in an effort to ensure uniform response. The electrodes are labelled Qn, where n=1 is the innermost electrode and n=4 is the outermost one.
Initial tests with G102a were performed by installing four Am-241 sources, each facing the centre of an electrode. Following tests were performed with a single Am-241 source on either face. The reduction in the number of Am-241 sources allowed for measurements with Ba-133 to probe the charge collection efficiency in the bulk of the crystal. The results from these measurements are shown in Fig. 3.
| Figure 3: Charge collection efficiency as a function of bias for the 100 mm 4Q device G102a. | |
|---|---|
 |  |
 |
|
Q4 is not shown as this channel was used as a veto. Although the possibility of biasing the electrodes at different potentials existed, the results shown in Fig. 3 are from data collected where all four electrodes were biased at the same potential. Good agreement is seen between bulk and surface events.
The absence of measurements with Ba-133 between bias voltages of -2 V and +1 V is due to the difficulty in discerning the 356 keV peak in these data series. This may be due to the very poor charge collection efficiency in the bulk at these low biases.
G106a (100 mm IZIP)
Collecting Holes on Side 2
As mentioned above, the Am-241 source faces Side 1 in this run with G106a. Therefore, to investigate charge collection efficiency in the bulk, Gaussian functions can be fit to the 60 keV peak on Side 2 at each bias. In order for the charge carriers to reach Side 2, they must traverse the length of the crystal. Due to the 1 mm penetration depth of 60 keV photons in germanium coupled with the 1.5 mm separation between charge and phonon rails on each crystal face, a relatively small number of these events are expected to be seen on Side 2.
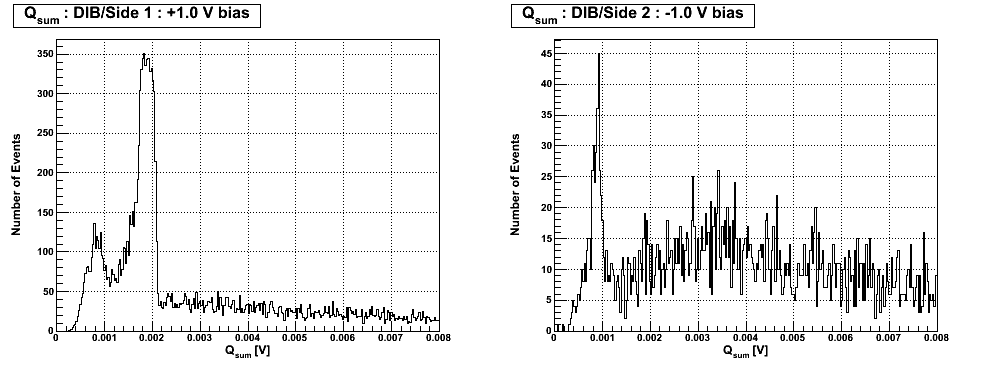
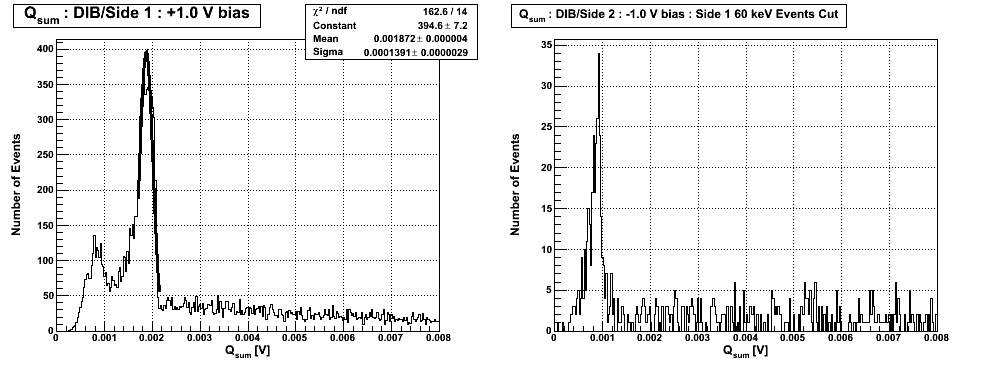
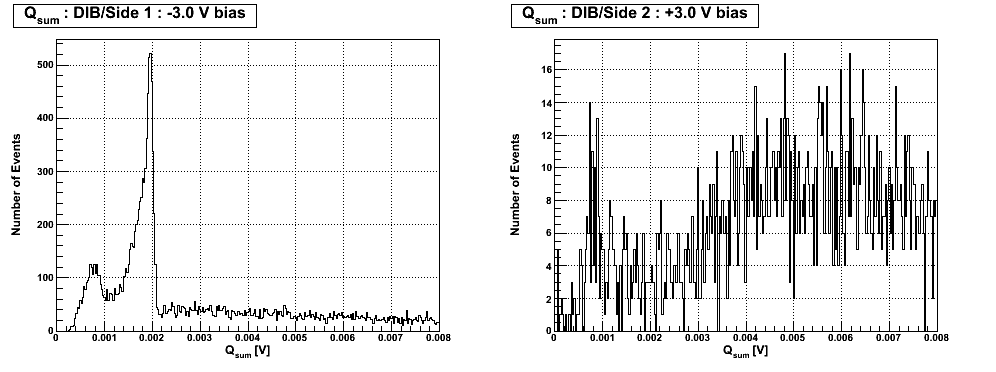
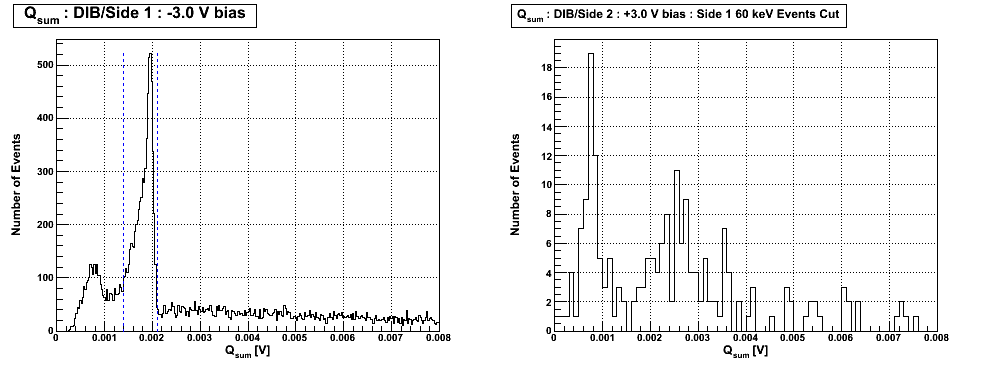
Although it is true that fewer events constitute the 60 keV peak on Side 2 compared with Side 1, when collecting holes the statistics are decent as illustrated in Fig. 4. A clear 60 keV peak is observed on Side 2, consisting of fewer events than its Side 1 counterpart. As the charge carriers that reach Side 2 from 60 keV photon interactions must be detected on Side 1, fitting a Gaussian function to the 60 keV peak on Side 1 allows for the establishment of a cut as shown in the bottom frame of Fig. 4. The cut here is defined as the mean of the fit plus-or-minus the standard deviation times three. The resultant Qsum Side 2 spectrum after implementing this cut has changed little. Therefore, even at low biases such as +/-1 V, it is easy to identify the 60 keV peak when collecting holes.
| Figure 4: Qsum spectra at +/-1 V bias for Sides 1 & 2 before (top) and after (bottom) cut on Side 1 60 keV peak. |
|---|
 |
 |
Collecting Electrons on Side 2
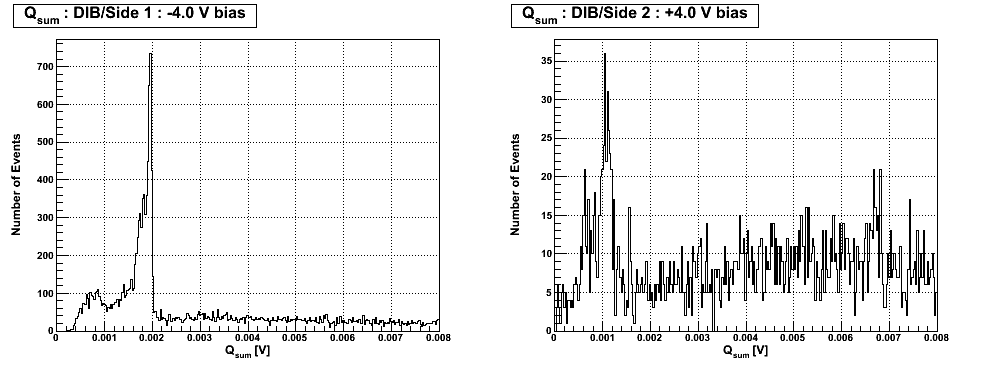
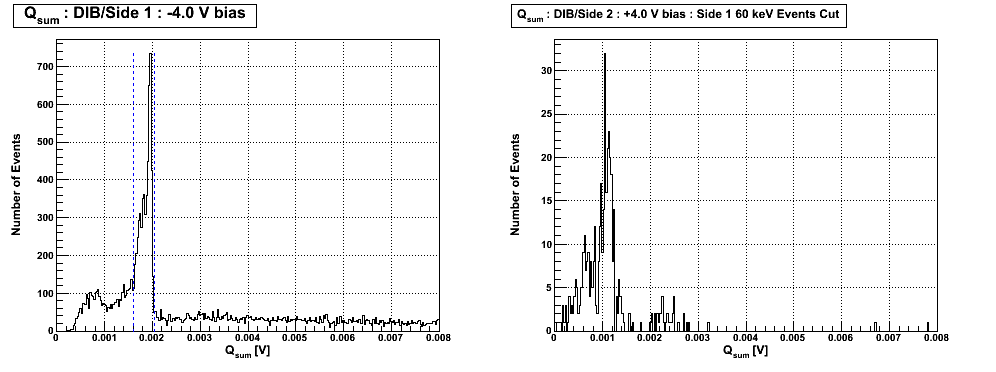
| Figure 5: Qsum spectra at -/+4 V bias for Sides 1 & 2 before (top) and after (bottom) cut on Side 1 60 keV peak. |
|---|
 |
 |
| Figure 6: Qsum spectra at -/+3 V bias for Sides 1 & 2 before (top) and after (bottom) cut on Side 1 60 keV peak. |
|---|
 |
 |
Seagull Plot
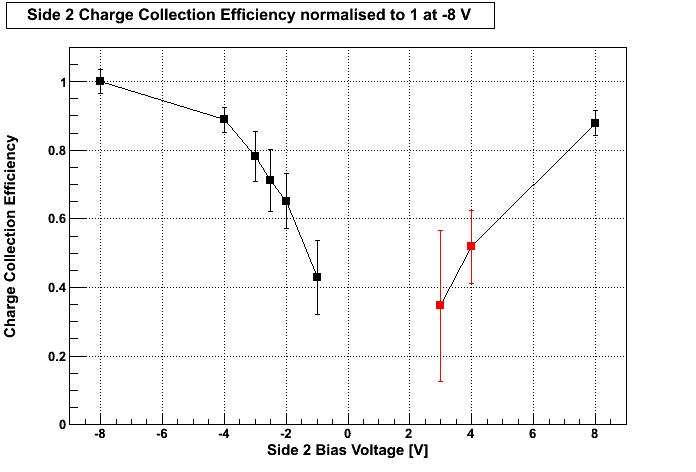
| Figure 7: Charge Collection Efficiency on Side 2 as a function of bias for G106a. |
|---|
 |
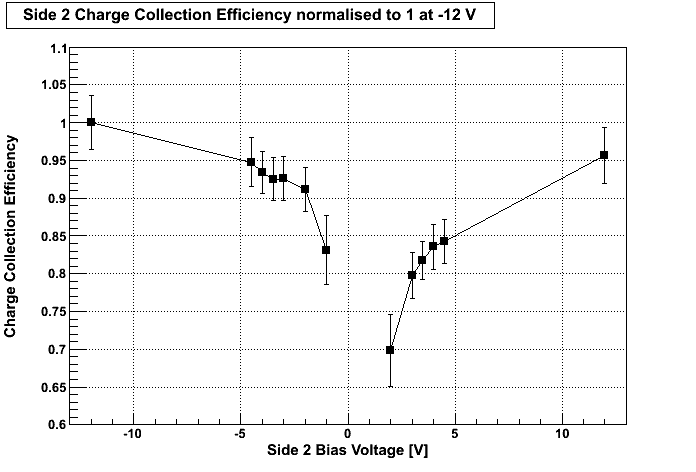
here is apparently another seagull plot from cdms:k100:run_diary:20130905:
| Figure 1: Charge Collection Efficiency on Side 2 as a function of bias for G106a. |
|---|
 |
| Table 1: 60 keV Peak Positions on Side 2 for G106a. | ||
|---|---|---|
| Side 2 Bias [V] | Mean [mV] | Sigma [mV] |
| -12 | (2.207 ± 0.004) E-3 | (5.524 ± 0.425) E-5 |
| -4.5 | (2.091 ± 0.002) E-3 | (4.921 ± 0.237) E-5 |
| -4 | (2.062 ± 0.002) E-3 | (3.367 ± 0.160) E-5 |
| -3.5 | (2.042 ± 0.002) E-3 | (3.793 ± 0.182) E-5 |
| -3 | (2.044 ± 0.002) E-3 | (3.834 ± 0.178) E-5 |
| -2 | (2.012 ± 0.002) E-3 | (3.871 ± 0.178) E-5 |
| -1 | (1.835 ± 0.005) E-3 | (8.964 ± 0.364) E-5 |
| +2 | (1.542 ± 0.010) E-3 | (9.762 ± 0.803) E-5 |
| +3 | (1.760 ± 0.004) E-3 | (4.987 ± 0.328) E-5 |
| +3.5 | (1.804 ± 0.003) E-3 | (3.039 ± 0.210) E-5 |
| +4 | (1.845 ± 0.003) E-3 | (4.687 ± 0.313) E-5 |
| +4.5 | (1.860 ± 0.003) E-3 | (4.468 ± 0.258) E-5 |
| +12 | (2.111 ± 0.003) E-3 | (6.147 ± 0.282) E-5 |