2016/10/18 (Tuesday)
| Setup: DIB1/3/4 → 3.2 MHz filters → cables → DCRC55(1)/33(2)/50(3) | |
| 0855 | Tower/MC/Coldplate = 35.4/36.3/224 mK, Still = 1.40 K / 85 μbar, G1/G2 = 155/155 mbar, 1K Pot = 1.71 K / 32.0 mbar. MB = 30.8% Boiloff rate: this is a little worse than slow-mode but much closer to slow- than fast-mode |
| 0900 | Fill LN2 cold trap bath |
| 1100 | Studying DIB4pD - this is TES0 and seems to have a sharp transition. This channel was railed but adjusting its SQUID settings helped: |
| New SQUID settings | ||
|---|---|---|
| Channel | SQUID bias | Lockpoint |
| DIB4pD | -51.3 | -4.9 |
| 1200 | Sending a 400 Hz 12 mVpp test signal to DIB4pD and set its Driver Gain to x8. Change QET bias and record peak-to-peak output voltage: |
|---|
| DIB4pD QET bias scan with test signal | |||
|---|---|---|---|
| QET Bias [μA] | Output [mVpp] | Phase | Notes |
| 0 | 167 | in | |
| 400 | 46 | in | |
| 350 | 39 | in | |
| 300 | in | no visible output, <4 mVpp | |
| 250 | 41 | in | |
| 200 | 161 | in | |
| 240 | 40 | in | |
| 230 | 13 | out | |
| 220 | 167 | out | |
| 210 | 233 | out | |
| 200 | 162 | in | |
| 230 | 13 | out | 15 kHz sinusoidal oscillations |
| 228 | 24 | out | |
| 226 | 41 | out | |
| 224 | 64 | out | |
| 222 | 105 | out | |
| 221 | 134 | out | |
| 220 | 140 | out | oscillations |
| 219 | out | strong oscillations | |
| 218 | out | very strong oscillations | |
| 215 | 193 | out | weaker oscillations |
| 212 | 220 | out | |
| 210 | 230 | out | |
| 208 | 250 | out | |
| 206 | 380 | out | |
| 204 | 520 | out | |
| 202 | 165 | in | |
| “out” means that output is 180 deg out of phase with test signal | |||
| Rparasitic = 9.77 mΩ | |||
Noah says the oscillations are expected and occur when the TES resistance is too small (less than shunt - this means the TES is current biased and therefore unstable)
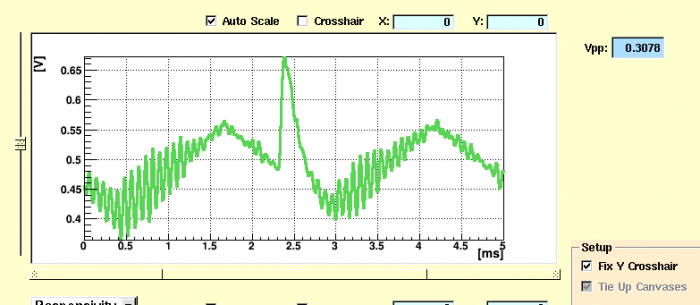 | QET bias 230 μA |
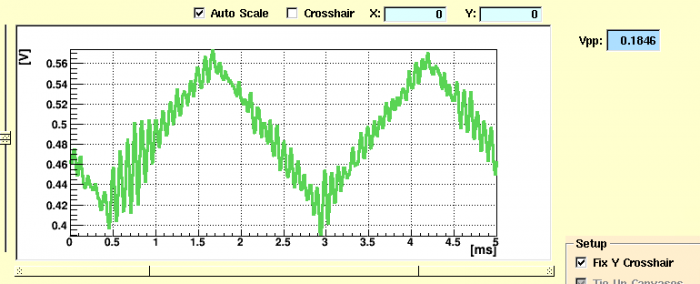 | QET bias 230 μA |
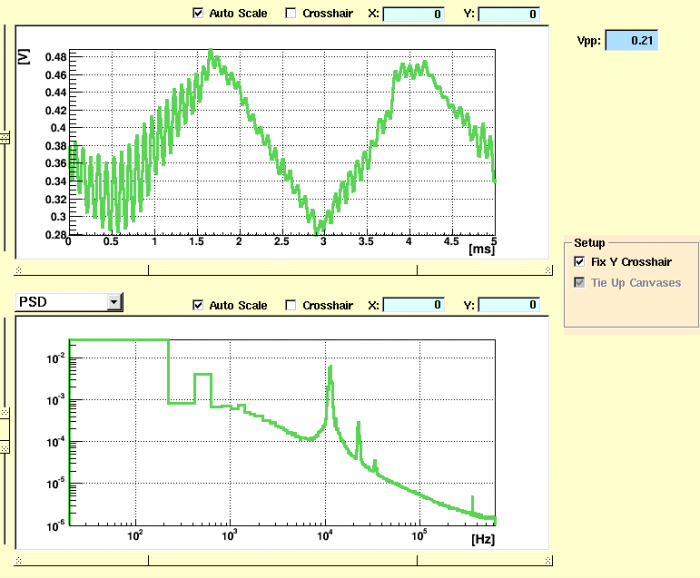 | QET bias 219 μA |
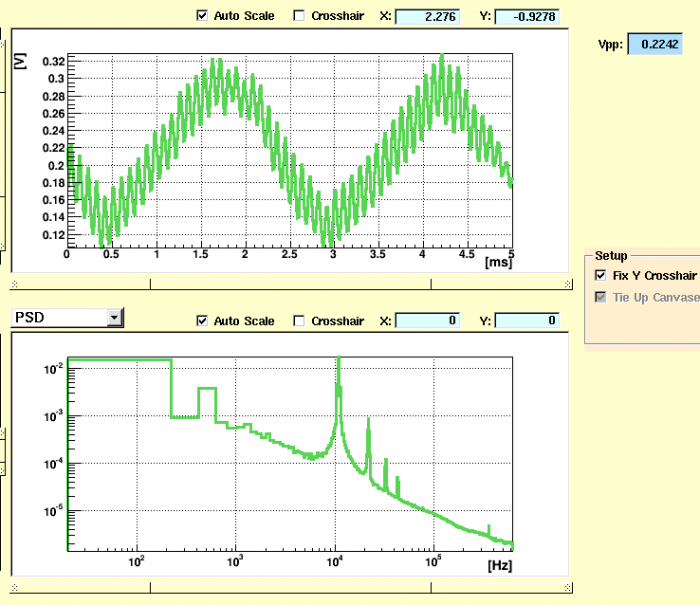 | QET bias 218 μA |
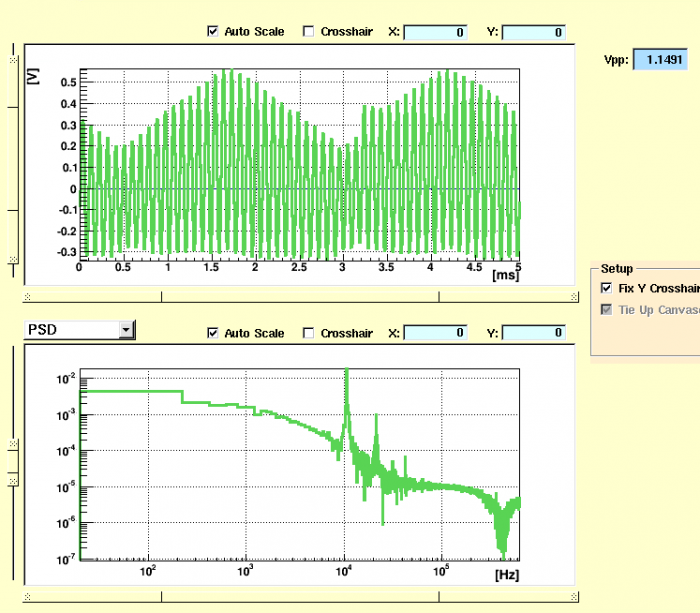 | QET bias 217 μA |
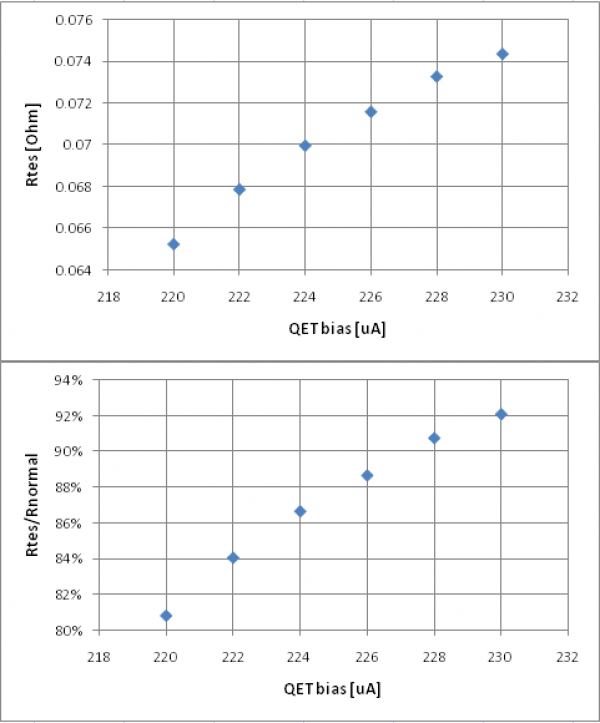
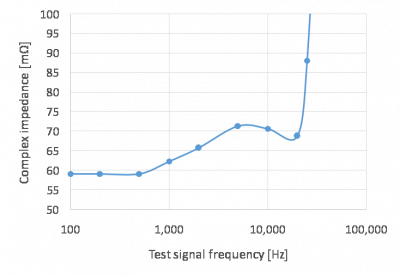
| 1300 | Initial attempt to use above complex impedance data to calculate Rtes in transition for DIB4pD seem to not make sense. Attempting to do this with “mini-IbIs” gives reasonable looking results. The two high biases used were 300 and 350 μA, and a driver gain of x2 was chosen (at x8 it was impossible to keep from railing at the various extremes). The normal state resistance comes out to Rtes = 81 mΩ. |
|---|---|
| We found some errors in our first attempt to use this data to get resistances in the transition state. See this page on calculating TES resistances using a test signal for info on how to do the calculation. |
| Mini-Ibis resistance results for DIB4pD in transition: |
|---|
 |
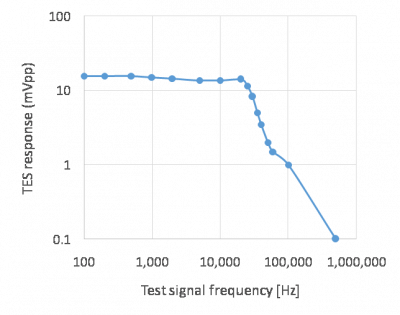
| At some point Noah performed complex impedance measurements on DIB4pD. He applied a 12 mV test signal. |
| DIB4pD (TES0) complex impedance measurement | |
|---|---|
| Test signal frequency [Hz] | Output signal [mVpp] |
| 100 | 15.7 |
| 200 | 15.7 |
| 500 | 15.7 |
| 1000 | 15.1 |
| 2000 | 14.5 |
| 5000 | 13.6 |
| 10000 | 13.7 |
| 20000 | 14 |
| 25000 | 11.5 |
| 30000 | 8.2 |
| 35000 | 5 |
| 40000 | 3.5 |
| 50000 | 2 |
| 60000 | 1.5 |
| 100000 | 1 |
| 500000 | 0.1 |
| Test signal amplitude: 12 mVpp Driver gain setting: x2 QET bias: 200 μA (probably) |
|
 |  |
| 1335 | Commence LHe transfer (21.9%). |
|---|---|
| 1422 | End LHe transfer (89.5%). |
| 1434 | Release pressure from main bath. |
| 1510 | Release pressure from main bath. |
| 1705 | Fill LN2 cold trap full. |
| 1745 | Place Cf source on side of fridge at detector height. |