−Table of Contents
NaI Detectors
Detector Information
The NaI detectors are Model: 8H6/5-X from Bicron Corp. From this site: Saint-Gobain Crystals, it is implied by the model that the NaI detector is 8in diameter x 6in thick. The exact model is not listed on the website, but the dimensions of the 8H6 model can be inferred by using this diagram of a 6H6 model: 6H6 Diagram.
This source, from the same site, shows the efficiencies of these detectors: Efficiency Calculations
Motivation
The following measurements were taken in the PuBe source room in PAN 443 with one of the sodium iodide detectors described here. The two main goals of these measurements were to observe the silicon neutron capture line as a sanity check, and to re-characterize our old NaI detectors as a dry run for working with the new NaI plank-shaped detectors.
Setup
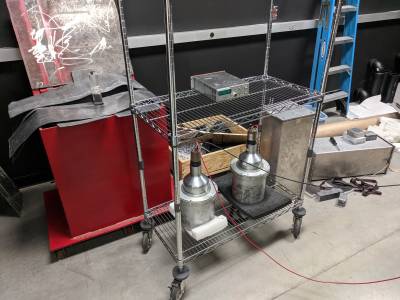
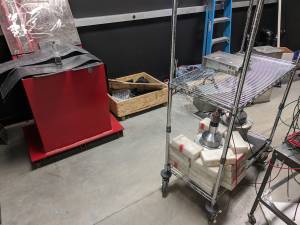
The detector, shown below, is powered by a HV rack box and has its dynode terminated. Output runs through through a fan in/out and into an Ortec 4xx Spectroscopy Amplifier box, which has the following settings:
coarse gain: 5
shaping time: 2.0 us
fine gain: as far CW as the dial would go (broken readout, don't know if this is max or min)
NEG, on bipolar output.
All data is from 400s runs, with live times ~390s.
 |
12/12/19 Runs
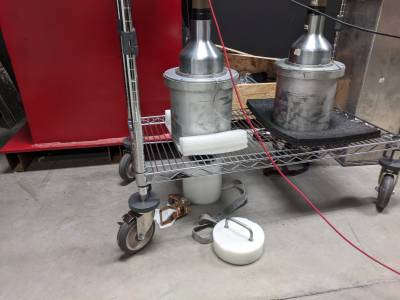
Used the Na22 source to contribute some known lines. The initial trial with the Na22 (389 s) very close to the detector seemed to shift what bins the peaks appeared in to the right, perhaps the result of a high gamma frequency saturating the detector.
 |
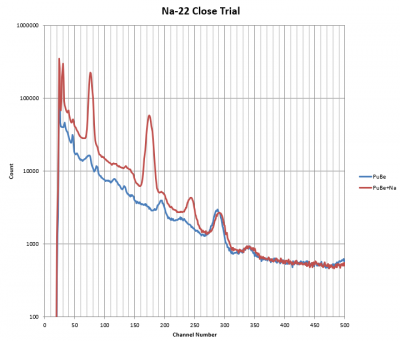 |
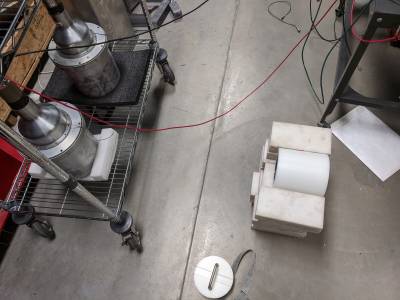
Redoing this trial with the Na22 further away led to a cleaner result.
 |
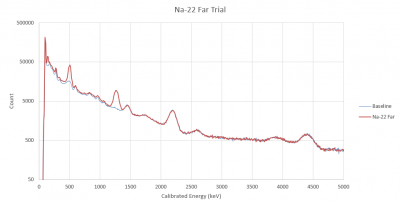 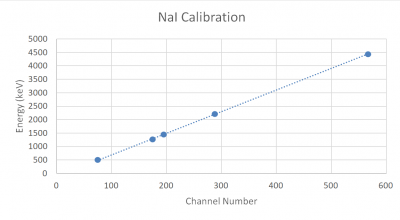 |
The known Na contributions at 511 and 1270 keV help to find other known peaks (H capture, K40), and the resulting calibration is fairly linear out to the known 4.44 MeV PuBe line.
12/19/19 Run
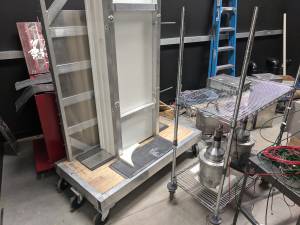
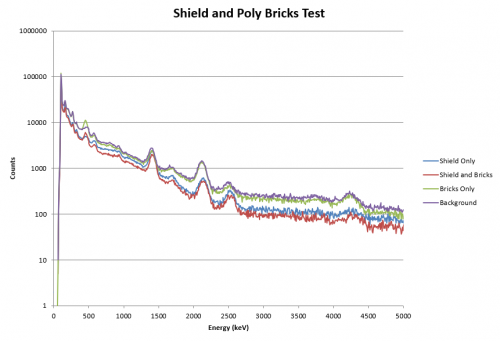
Took measurements using different arrangements of lead shielding and poly bricks, with the goal of observing an increased hydrogen capture line because of the bricks. The theory behind the shield was to hopefully slow down the PuBe neutrons so they would capture more easily.
 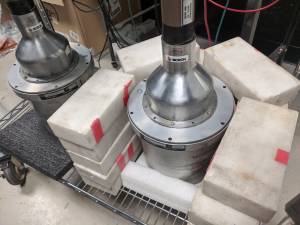  |
Both with and without the shield, the presence of the poly bricks adds a line around 450 keV. This is not the expected hydrogen capture energy, but it is somewhat close to the known capture line for boron (478 keV). This might make sense if the polyethylene bricks are borated. Either way, this test indicates that relatively low masses of capturing material produces enough gammas to be observed by the NaI detector, a promising sign for observing the Si capture line.
 |
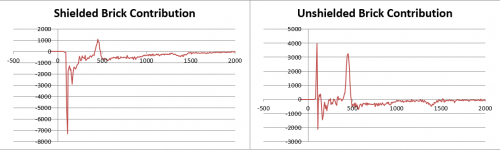 |
Note: The first peak at 100 keV in the Unshielded Brick Contribution graph is a single point, and likely an outlier. Interestingly, the 450 keV contribution is both larger and more identifiable in the unshielded data. Finally, the absence of the shield (and subsequently lower count numbers) shifts the peaks slightly to the left this time, seemingly the opposite trend from the near and far Na-22 trials. Possibly a result of the shield filtering out more lower-energy gammas?
1/24/20: Si Capture Line
Took two very long (10 hour run time) measurements with and without a sandbag placed directly underneath the detector. The source had at this point been moved to the howitzer container, which does change its spectra but shouldn't impact direct comparison tests searching for the Si capture line. Visually, the two measurements appear virtually identical:
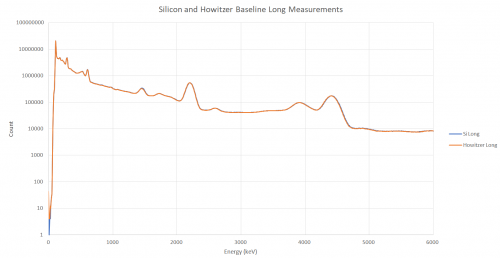 |
Doing a simple subtraction to isolate the silicon contribution yields the following, which looks promising at first:
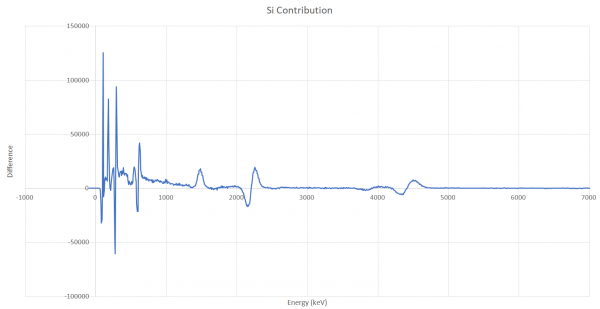 |
However, (almost) every notable deviation from 0 appears as a trough-peak pair centered around the channel number of an existing peak in the data. These are artifacts of the way that the Si Long measurements has all of its peaks shifted slightly to the right, which could be due to something like a fluctuating bias voltage, or be an indicator that calibration depends on rate count. For example, summing up these measurements through all bins 0-8191 and dividing by live time reveals that the Si Long measurement has a slightly higher count rate, 7647 counts/second, than the Howitzer Long measurement, 7592 counts/second; higher count rates shifting the peaks to the right would fit in with the behavior observed with the proximity of the Na-22 source. Either way, these trough-peak pairs do not represent actual silicon contribution.
The only actual contribution peak, which appears without a preceding trough, is at the K-40 primary energy (1460 keV), and is likely due to the presence of potassium in the sandbag. Overall, these results seem to indicate that these NaI detectors don't have the sensitivity to observe an Si neutron capture line.
Continued effort to find Si Capture lines
In March 2021 we repeated attempts to see Si capture lines with the NaI detector. We again took data with the NaI detector in the presence of the PuBe source in its howitzer. This time we took datasets with and without the two 150-mm Si detectors present near the NaI detector.
Here is a convenient reference for gammas from n-capture: https://www-nds.iaea.org/pgaa/pgaa7/index.html
Here is another one: https://www-pub.iaea.org/MTCD/publications/PDF/Pub1263_web.pdf
(Also: here's a link giving n-capture cross-sections for all the elements: https://www.osti.gov/etdeweb/servlets/purl/20332542. Some notable observations: the silicon cross-section is an order of magnitude smaller than germanium; germanium is comparable to iron and copper; and chlorine is yet another order of magnitude higher. That's interesting - if we have trouble getting enough counts from other materials, maybe we should try a bag of salt.)
From that reference we find the two most prominent gammas expected from Si-28 (the most abundant silicon isotope):
- 3.539 MeV
- 4.934 MeV
These should appear at nearly the same rate.
As with the sandbag run, we find very little difference between the spectra with and without the silicon present. These were short runs, 400 seconds each. We attempted to estimate the rate at which we should see the silicon capture gammas. For the Run 68 setup we estimated that neutrons captured on the detector at a rate of about 0.2 Hz. The setup with the howitzer is different of course, but we take that same rate, scale it up by the silicon mass, and guess at the solid angle incident on the NaI detector, we get perhaps only 30 hits in 400 seconds. The strong direct gammas from the PuBe source could well be obscuring these lines, even in the longer datasets taken a year ago.
So we should repeat this test with a lead shield to block the gammas from the source. Probably the easiest would be with the source in the paraffin drum and a wall of lead bricks between PuBe and NaI.
Calibrated spectrum and line IDs
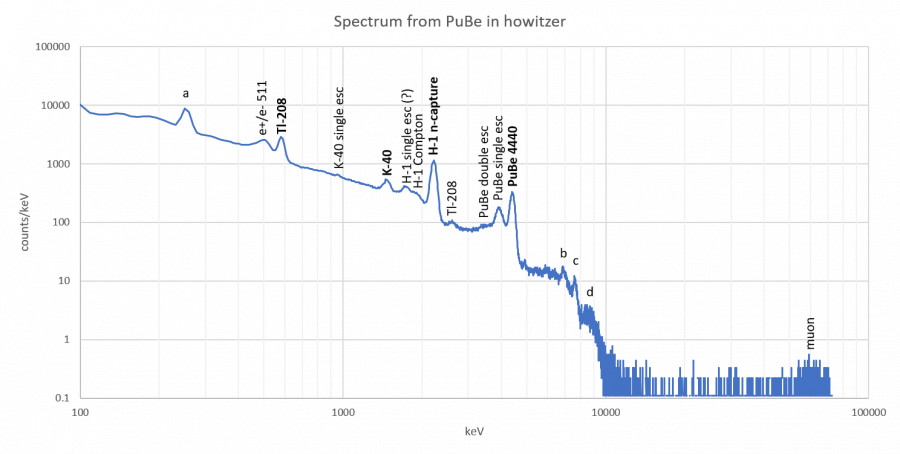
In the 400-second dataset taken above, we show identified and unidentified features. A high-energy calibration was done based on a linear fit to three lines: K-40, H-1 neutron capture, and the 4440 keV PuBe line. A second calibration for lower energies is used based on a linear fit to K-40 and the lower Tl-208 line from the thorium decay chain. We can also identify the 2614 keV Tl-218 line, some escape peaks, and some Compton edges.
Here's an Excel spreadsheet analyzing this spectrum.
To identify features it's useful to refer to data taken with and without the PuBe near the detector. Comparing these spectra helps identify which features are lab background and which are PuBe-related.
Here are some details and remaining mysteries:
- We are now pretty familiar with the strong 4440 keV PuBe line. But documentation on the PuBe source suggests there should also be a line at 3214 keV, about 70% as strong. There is no indication of this line. There should be a third line at 9641 keV, about 20% as strong as the 4440 keV line. There's no indication of this line either.
- The lower energy line labeled “a” is not identified with certainty. It could be another line from the thorium decay chain (Pb-212, 239 keV), but it is stronger when the PuBe source is present. So maybe it is a backscatter peak instead. The backscatter from H-1 should be 229 keV. According to the calibration the line appears around 250 keV. It could certainly be the case that the calibration is a bit off at this low an energy.
- The Tl-208 line at 583 keV gets a lot smaller if lead shielding is used or if the PuBe source is removed. This doesn't make sense if it's from thorium and its daughters present in the lab. Is there another line produced by PuBe at the same energy?
- The 511 keV peak is somewhat distorted when the PuBe source is present. It looks like a clean gaussian when the PuBe is not present.
- “H-1 single escape” is probably a misidentification, because it is more prominent when the PuBe is not present. So this peak around 1780 keV seems to be in the lab background. It could be 1764 keV from Bi-214 in the uranium decay chain.
- “b” and “c” are quite possibly n-capture lines from material in the lab. They appear around 6890 and 7630 keV respectively. The IAEA database shows forests of lines in that energy region for both copper and iron. I don't know of much copper in the PAN 443 storage area, but there is certainly steel - the rack that the NaI sits on and possibly some of the NaI material. “c” is nominally a very good match to the strongest iron line (actually a double line), but there's no iron line near “b”. Alternatively the copper lines can fit both features if we assume that the calibration is too low in this region, by about 4%. It's not a perfect fit because there should probably be a strongish line between “b” and “c” too that we don't really see.
- The muon bulge seems to be approximately in the correct place. I'm not certain about the dimensions of the NaI, but in previous notes I have the diameter as 7.75“ and the height as 6”. The dE/dx for muons in NaI is 4.79 MeV/cm. So vertical muons should deposit 73 MeV. The bulge peaks around 62 MeV nominally. So the calibration at this very high energy may be around 15% too low. That bolsters the idea that in the region around the Fe capture lines the calibration is a bit too low as well.
Spectrum with Howitzer and 2 inches of steel shielding
2021 March 3: Data was taken with the same setup as above except that the howitzer was moved back a few inches in contact with the wall and 8 1/4“-thick plates of steel were leaned up against the howitzer (with lead bricks at the bottom to keep the plates secure).
| Figure 1 |
|---|
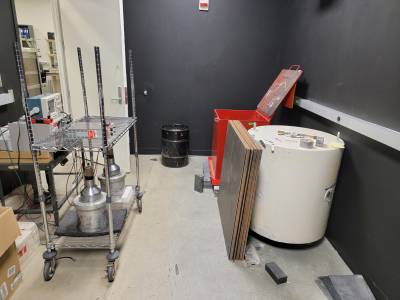 |
| Setup for the data taken with the PuBe source in the Howitzer and 24 steel sheets. |
Spectrum with drum and 2 inches of steel shielding
2021 March : More data was taken with the same set up with 16 and 24 1/4” thick steel plates. Then we moved the source into the small drum and moved the shields so they were leaned up against the drum. With this set up, more data was taken with 8, 16, and 24 steel plates.
| Figure 2 |
|---|
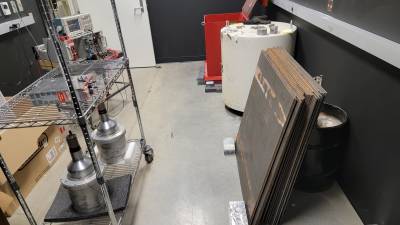 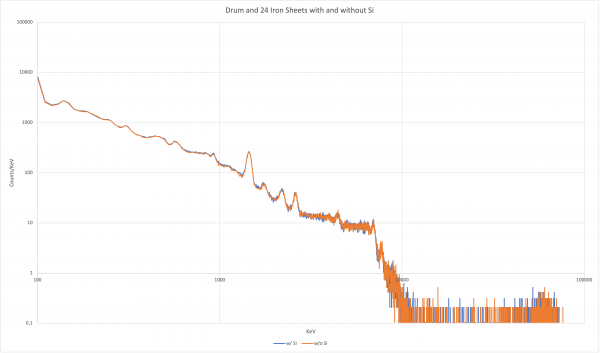 |
| Left: setup for the data taken with the PuBe source in the drum and 24 steel sheets. Right: spectra taken with the setup on the left. |
Here is the spreadsheet for this data: drum_24.xlsx
Here's a spreadsheet showing a spectrum with this setup, compared to a spectrum with the Howitzer and the same amount of steel. It looks like maybe the highest lines are more prominent in the drum setup - are these iron capture lines? Spreadsheet with drum+steel (no Si), compared with Howitzer+steel
Spectrum with drum, 2 inches of steel shielding and fridge shielding
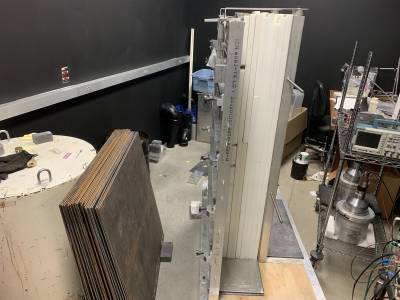
2021 June 9: Data was taken with the PuBe source in the drum, 24 of the 1/4“ steel plates and the fridge shielding. This was done with and without silicon near the detector.
| Figure 3 |
|---|
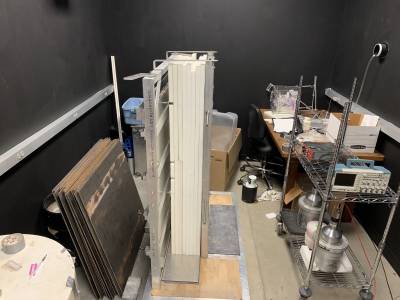 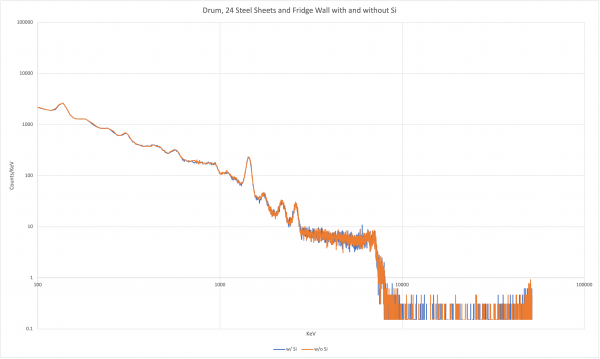 |
| Left: setup for the data taken with the PuBe source in the drum, 24 steel sheets, the fridge shielding and the silicon near the detector. Right: spectra taken with the setup on the left |
The main effect that the fridge shielding appears to have is ridding of the PuBe 4440 peak. The peaks previously labeled “a”,”b“ and “c” (possibly iron or copper peaks) are not apparent anymore either. Here is the spreadsheet for this data: drum_24_fridge.xlsx
Spectrum with Howitzer, 2 inches of steel shielding and fridge shielding
2021 June 10: Data was taken with the PuBe source in the Howitzer, 24 of the 1/4” steel plates and the fridge shielding. This was done with and without silicon near the detector.
| Figure 4 |
|---|
 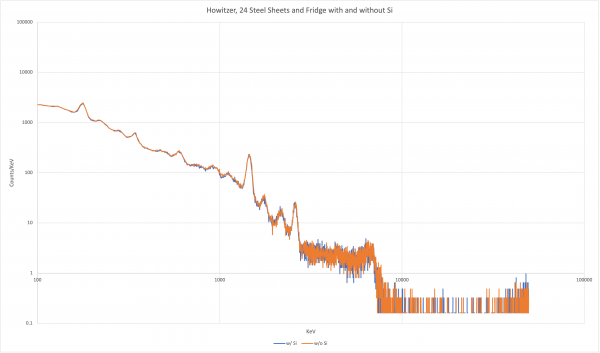 |
| Left: setup for the data taken with the PuBe source in the Howitzer, 24 steel sheets and the fridge shielding. Right: spectra taken with the setup on the left. |
This spectrum differs from the one collected with the source in the drum by an overall lower count of gammas, similar to what was displayed earlier, No extra peaks appear.
Data spreadsheet: howitzer_24_fridge.xlsx
Spectrum with Howitzer, 2 inches of steel shielding and HDPE shielding
2021 June 11: Data was taken with the PuBe source in the Howitzer, 24 of the 1/4“ steel plates and HDPE shielding. This was done with and without silicon near the detector. This is different from the fridge shielding merely by the absence of the lead portion of the fridge shielding.
| Figure 5 |
|---|
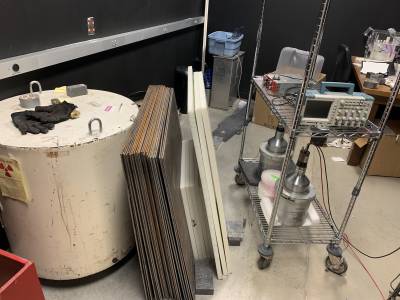 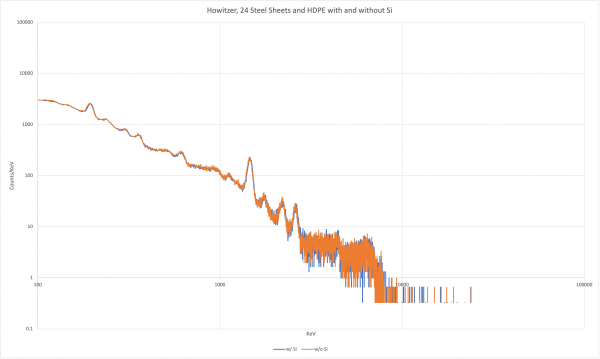 |
| Left: setup for the data taken with the PuBe source in the Howitzer, 24 steel sheets and the HDPE shielding. Right: spectra taken with the setup on the left. |
Data spreadsheet: howitzer_24_hdpe.xlsx
Spectrum with drum, 2 inches of steel shielding and HDPE shielding
2021 June 11: Data was attempted to be taken with the PuBe source in the drum, 24 of the 1/4” steel plates and HDPE shielding. We incurred a problem with the system. The spectrum appeared to have no peaks whatsoever. We have had issues with the signal from the detector not appearing before. This was usually solved by finicking with the output cord from the detector or increasing and decreasing the coarse gain in the spectroscopy amplifier. In this case, the coarse gain was set to 20, due to the issue of a lack of signal beforehand. It was suspected that the amplifier gain “quick fix” failed in the middle of the run but this was not the case as the oscilloscope showed that a strong signal was still being picked up.
| Figure 6 |
|---|
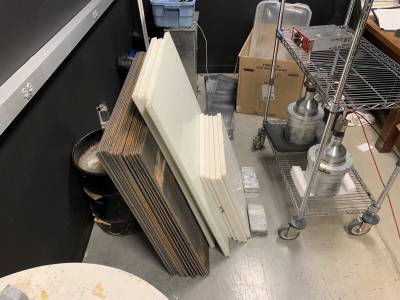 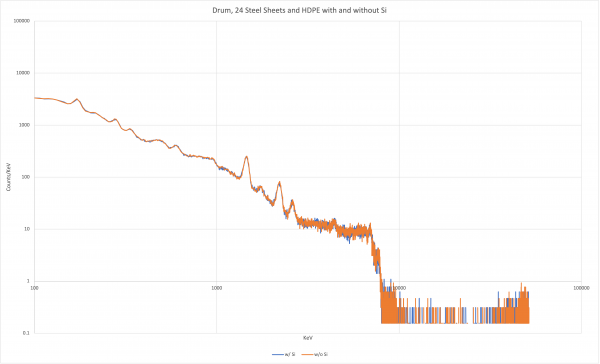 |
| Left: setup for the data taken with the PuBe source in the drum, 24 steel sheets and the HDPE shielding. Right: spectra taken with the setup on the left. |
This is what the MAESTRO program was originally displaying for this run:
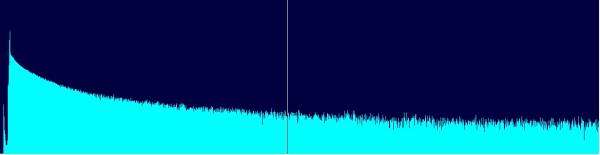
After some finicking with the cords and the gain, a signal started appearing strong with the coarse gain set to 5. Data was collected and the spectrum appeared to contain the expected peaks again.
Effort to find Cl capture lines
On June 15, 2021, we got a 40lb bag of Morton pool salt. This was motivated by the fact that the capture cross section for chlorine is significantly larger than for silicon. We will substitute this bag of salt for the silicon hoping that we will see the capture lines for chlorine. A simple calculation tells us that we expect a rate of capture that is about 692 times larger for the bag of salt than for the silicon detectors. Here is a spreadsheet with that calculation: chlorinevssilicon.xlsx. We expect to see peaks in the spectra at about 6.11 MeV and 1.16 MeV for the chlorine. There is also a capture line at 1.95 MeV.
Spectra with drum, 2 inches of steel shielding and HDPE shielding with and without Cl
2021 June 16: We took some spectra with the PuBe source in the drum, 24 steel sheets and the HDPE shielding with and without the bag of salt near the detector.
| Figure 7 |
|---|
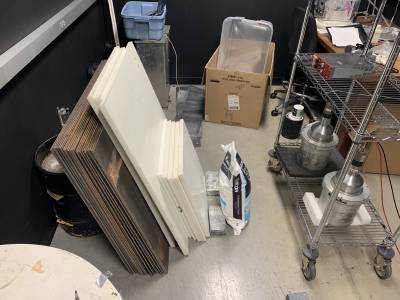 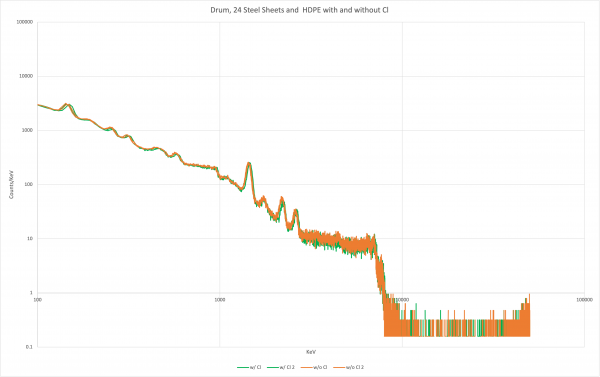 |
| Left: setup for the data taken with the PuBe source in the drum, 24 steel sheets, HDPE and the bag of salt. Right: spectra taken with the setup on the left. |
We cannot identify the peaks for chlorine that we were looking for. However, there is a small peak at about 1.1 MeV, which is where one of the chlorine peaks is expected, in both of the spectra with and without the salt. This small peak is unidentified.
Here is the data spreadsheet: drum_24_hdpe_cl.xlsx
The next step is to increase the collection time (or live time) for each spectrum. We have increased it from 400s to 600s. A spectrum with the salt near the detector was collected with a live time of 600s. It did not reveal anything not previously seen. Here is the data compared with the 400s run without the salt: drum_24_hdpe_cl_600s.xlsx
One theory we have is that the 24 steels sheets are stopping too many of the neutrons to allow us to see good neutron capture lines. We will remove some steel shielding and redo some measurements.
Spectra with drum and HDPE shielding with and without Cl
2021 June 17: We took some spectra with the PuBe source in the drum and the HDPE shielding near the drum with and without the bag of salt near the detector. The live time was also set back to 400s. This did not reveal anything interesting. Next, we poured the salt out into 2 boxes and kept some in the original bag. We then placed these 3 containers of salt around the detector. We also placed the HDPE shielding behind the detector.
First, with this new setup, we put the fridge wall between the source and the detector. This did not reveal anything of interest. We then took away the fridge wall and put 8 steel sheets in its place. In this spectrum, a very small peak appeared at about 1.1 MeV. This is precisely where we expect the largest Cl peak to be. We then added 8 more steel sheets, for a total of 16, to try to isolate this peak. Again, the spectrum showed a small peak near 1.1 MeV.
| Figure 8 |
|---|
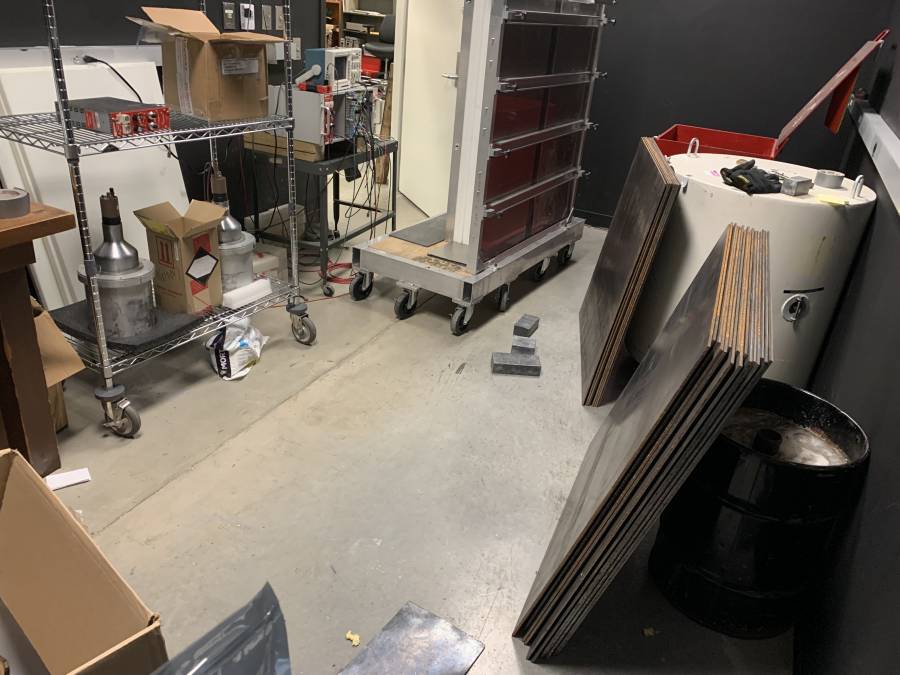 |
| Setup for the data taken with the PuBe source in the drum, 16 steel sheets, the HDPE behind the detector and the containers of salt. |
2021 June 18: We poured the salt into 5 2 gallon plastic bags with some salt remaining in one box and salt remaining in the original bag. We then surrounded the NaI detector with the bags of salt.
| Figure 9 |
|---|
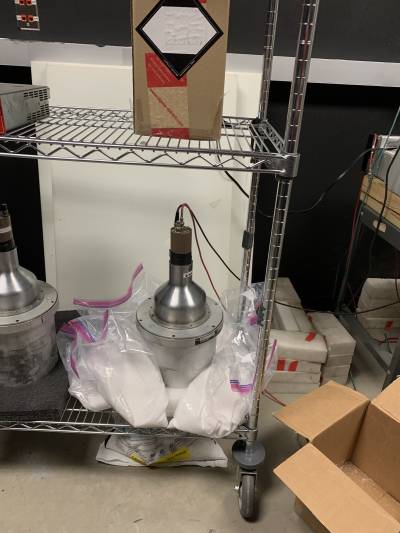 |
| Image of the new salt arrangement with multiple plastic bags |
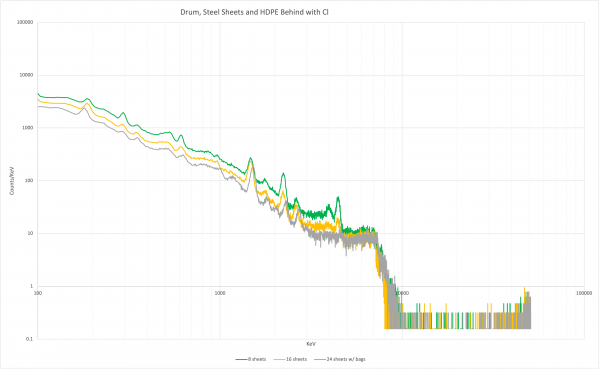
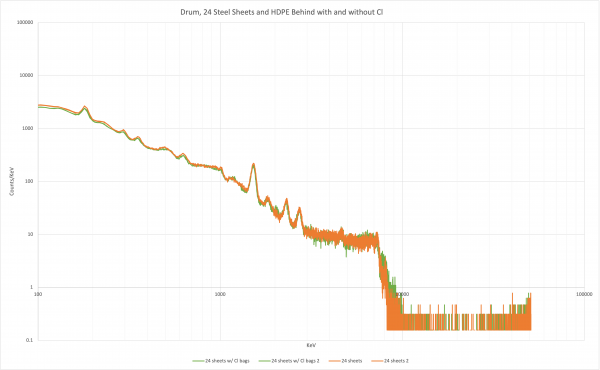
Using 16 sheets of steel, again, the peak at about 1.1 MeV was slightly more apparent and was wider. We then added more steel sheets for a total of 24. With the 24 steel sheets and the salt surrounding the detector in the bags, the peak was the most apparent it has ever been, so far.
Next, we tested the 24 steel sheet setup without the salt in the room. The result shows that this peak near 1.1 MeV is not conclusively the Cl capture line. The peak is still in the spectra without the salt, albeit perhaps slightly smaller.
Cl-35 Capture Line Found
Spectra with drum, 24 steel sheets, 3 HDPE walls and a HDPE floor
2021 July 6: 3/4 of the full fridge shielding was assembled using 2 permanent walls and loose HDPE sheets. Spectra were taken with and without salt surrounding the detector, as shown in Figure 9. Without the salt, no peak was apparent at 1.1 MeV. With the salt, a clear peak is seen in the spectrum. This peak is precisely where a Cl-35 capture line is expected: 1.16 MeV.
| Figure 10 |
|---|
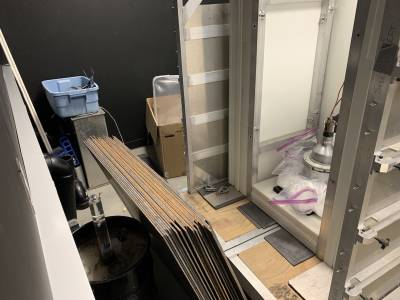 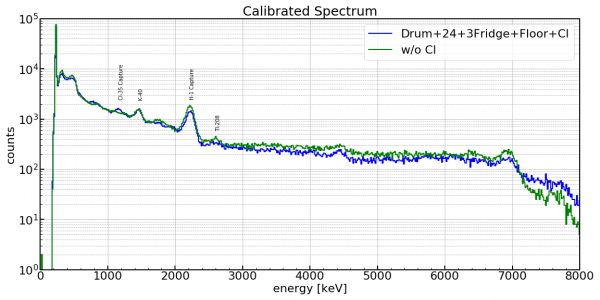 |
| Left: Image of the setup with the PuBe source in the drum, 24 steel sheets, 3 fridge HDPE walls, an HDPE floor and the NaI detector. Right: the spectra from the setup on the left. One spectrum is for the setup with salt (Cl) surrounding the detector and another is without the salt. A clear peak is at 1.16 MeV for the spectrum with salt, which must be the Cl-35 neutron capture line. |
Spectra with drum, 24 steel sheets and 3 HDPE walls
2021 July 9: Spectra was taken without the HDPE floor and with the whole setup from earlier rotated 90º. A peak is still seen at 1.16 Mev, but there is also a peak, with the salt near the detector, at 1.94 MeV. This is very close to Cl-35's 1.95 MeV line which has a cross-section roughly 60% as large as the 1.16 MeV line's. Looking back at the spectra from July 6, there is perhaps a slight bump at 1.95 MeV with the salt as well. It is peculiar that we would see this line and not the 6.11 MeV line.
| Figure 11 |
|---|
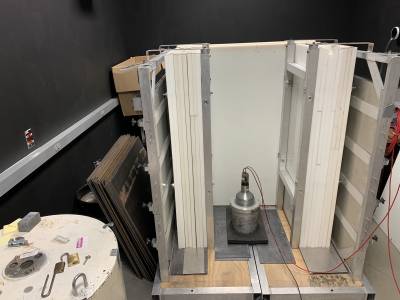 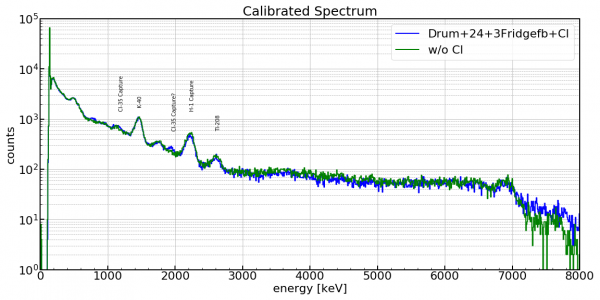 |
| Left: Image of the setup with the PuBe source in the drum, 24 steel sheets, 3 fridge HDPE walls and the NaI detector. Right: the spectra from the setup on the left. One spectrum is for the setup with salt (Cl) surrounding the detector and another is without the salt. Peaks are seen at 1.16 MeV and 1.94 MeV for the spectrum with salt, which are perhaps both the Cl-35 neutron capture lines. |