Table of Contents
PuBe Neutron Source
Documents
- PuBe Source Certificate. This page is in the scan below too, but this version is more clear.
- Documents from Kurt Wick and Kevin Booth. These are high-quality scans of old documents found in Kurt Wick's files.
Neutron Rate
The source documents state the following neutron emission rate:
| Table 1 | |
|---|---|
| Neutron emission: | 1.96E6 n/s |
| Calibration date: | 16 May 1966 |
There are also notes in the documents about how this rate is expected to change over time. These notes are not complete. To understand them I consulted a 1958 DOE technical report about PuBe neutron sources and the Wikipedia articles on Plutonium and Plutonium-239.
The source is meant to be a pure compound, PuBe13. There may be an excess of plutonium or beryllium. The plutonium emits alphas, which sometimes interact with beryllium nuclei in alpha,n reactions, emitting high-energy neutrons.
Plutonium is created by neutron capture on U-238. Primarily this produces Pu-239. If the neutron activation occurs over a long time, there will be significant amounts of Pu-240 created too, and smaller amounts of Pu-241 and Pu-242. For the purposes of estimation I'll consider Pu-242 negligible. Another possible isotope is Pu-238 - I'll assume that's negligible too.
Pu-239 and Pu-240 are both alpha emitters with half-lifes in the thousands of years. But Pu-241 undergoes beta decay to Am-241 with a half-life of 14.4 years. Am-241 is an alpha emitter and thus will contribute to neutron production, so as Pu-241 is replaced by Am-241 the neutron rate will increase.
| Table 2 | |||
|---|---|---|---|
| Isotope | Decay mode | Half-life (years) | Alpha decay energy (MeV) |
| 238Pu | alpha to 234U | 87.74 | 5.593 |
| 239Pu | alpha to 235U | 24100 | 5.156 |
| 240Pu | alpha to 236U, spontaneous fission | 6560 | 5.256 |
| 241Pu | beta-minus, to 241Am | 14.4 | |
| 242Pu | alpha to 238U | 376000 | 4.985 |
| 241Am | alpha to 237Np | 432.2 | 5.486 |
Starting with a certain number of Pu-241 atoms, the number of Am-241 atoms after time t depends on the mean lifetimes of the isotopes as:
| Equation 1 |
|---|
| |
| Figure 1 |
|---|
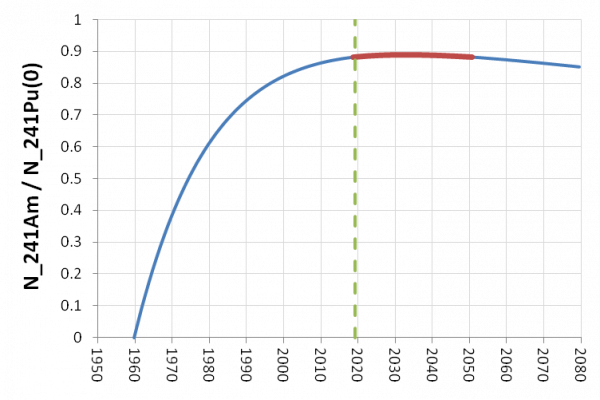 |
Figure 1 sets t=0 at 1 October 1959, following a note in one of the source documents - apparently this is the approximate date that the plutonium was produced. Interestingly we are now approaching the peak amount of Am-241 - it will vary by less than 1% over the next 30 years.
The alpha-emitting isotopes have different neutron yields because they have different alpha energies. The DOE report says that Am-241 and Pu-238 (around 5.5 MeV) have a neutron yield 1.27 times greater than Pu-239 and Pu-240 (around 5.2 MeV). Following the logic of the DOE report we can write how the neutron yield at time t is different from the neutron yield at time 0, in terms of the relative abundances of the plutonium isotopes in the original sample and there mean lifetimes:
| Equation 2 | |
|---|---|
| a | |
| b | |
| c | |
Equation 2b above combines Equation 2a with Equation 1. The entire factor before the parentheses is called k in the DOE report (although they include Pu-238 and they approximate the half-life of Am-241 as infinite instead of 432.2 years, which wouldn't make much difference in the first couple decades but after 50 years it's significant). The longer half-lives of Pu-240 and Pu-239 have been neglected - this amounts to an error of less than 1%.
The above allows us to fill in the incomplete details of the equation in the source documentation concerning neutron rate as a function of time. That source gives k as 0.30±0.06, “obtained from a study of the changes in emission rates of several other PuBe sources”. If we use that equation (with the half-lives of Pu-241 and Am-241) and extrapolate back from the calibration of 16 May 1966 to the presumed production time of 1 October 1959, we would get an initial neutron rate 7.3% smaller: 1.82e-6 n/s. This is almost the same as the initial rate assumed in the document, 1.81e-6 n/s (the difference may be due to using older values for the half-lives).
So, given this value for k and the error, we can plot the neutron activity versus time:
| Figure 2 |
|---|
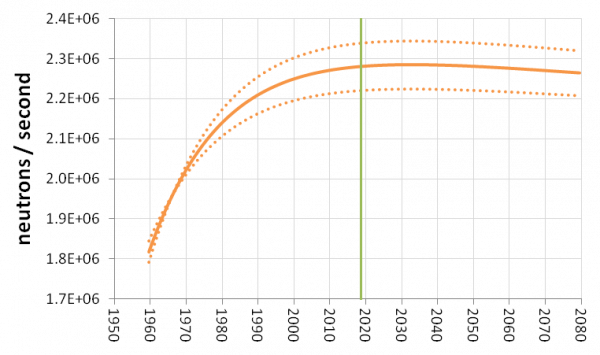 |
During the time of the -125V PuBe data in Run 68 (green in the plot), the neutron activity is calculated to be:
| Date | Neutrons/second |
|---|---|
| 22 Sep through 3 Oct 2018 | (2.28 ± 0.06)E6 |
(This value differs by no more than 1% from 2003 to 2088.) The current rate represents an increase of 16% since the calibration in 1966. If we can trust the uncertainty in k, then the relative uncertainty in the rate is only 2.6%. (There is also some uncertainty in the 1966 calibration mentioned in the documentation, apparently about 1%, that could be folded into this.)
Isotopic composition
The documentation states that the isotopic composition of the source is not available. But we can make some inferences and guesses.
As described in the Wikipedia article on Plutonium-239, when plutonium is manufactured the primary isotope created is Pu-239; the next most abundant isotope is Pu-240. Pu-239 is the most useful isotope for weapons - if there is too much Pu-240 the bomb won't work. Plutonium is classified as follows:
| Table 3 | |
|---|---|
| Classification | Fraction of Pu-240 |
| Supergrade | 2–3% |
| Weapons grade | 3–7% |
| Fuel grade | 7–18% |
| Reactor grade | 18% or more |
Pu-240 can be minimized if the duration of the exposure of U-238 to neutrons is kept short. This does not happen in commercial reactors. However the source was made before the era of commercial reactors. So it is reasonably likely that the source is higher than reactor grade.
It has been said that the PuBe source has an activity of 1 Ci. This is presumably the (original) alpha-activity of the plutonium. The mass of the plutonium in the source is given in the documentation as 15.98 g. If this were 100% Pu-239, that would come to 0.99 Ci. It's possible that 15.98 g was selected to target at least 1 Ci. A very small fraction of Pu-240 would bring it significantly above 1 Ci since its half-life is much shorter. (For example, 10% Pu-240 would result in 1.25 Ci.) The 1 Ci activity is not stated in the source documentation, so it's likely that it was not precisely known.
The initial Pu-241 abundance can be estimated from the value of k as described above. It depends on the abundance of Pu-240 assumed, but not strongly. (Again I assume I can neglect other isotopes.) For possible Pu-240 fractions of 0-20%, the Pu-241 fraction implied by k=0.3 is in the range 0.4% to 0.6%.
If we assume that the Pu-240 fraction is 7%, then the Pu-241 fraction comes to 0.48%. This would mean that the ratio of Pu-241 to Pu-240 is about the same as the ratio of Pu-240 to Pu-239. That may be reasonable if the neutron capture cross sections of Pu-239 and Pu-240 are similar.
Activity
There are several activities we can identify for the PuBe source. In addition to the total alpha rate there's the neutron production rate. The alpha,n reaction results in excited nuclear states, so there is also a high-energy gamma rate similar to the neutron rate. The plutonium isotopes decay to the ground state of their daughters, but this is not the case for the Am-241 - it has the familiar 60 keV emission, which is close to its alpha rate. For the assumption that the initial source was 7% Pu-240 and 0.48% Pu-241, we find the following activities:
| Table 4 | |
|---|---|
| Emission type | Activity |
| alpha (total) | 1.41 Ci |
| neutrons | 61.6 μCi |
| high-energy gamma, after alpha,n | ~61.6 μCi |
| alpha from Am-241 only | 0.23 Ci |
| gamma from Am-241 | ~0.23 Ci |
The neutron and high-energy (4 MeV or so) gamma activities are high compared to the other sources we keep in the safe, all of which are weaker than 10 μCi. The alpha activity is much higher than the neutron activity because few alphas (only about 1 in 20,000) produce (alpha,n) reactions. But of course the alpha activity is not directly relevant to safety or anything we can measure because no alphas will escape the source housing.
But note that the gamma activity from Am-241 is extremely high by our standards - 230,000 stronger than our 1 μCi Am sources. This is an activity I hadn't appreciated before. Luckily at 60 keV these are not very penetrating - the source housing will block something like 90% (0.1-inch thick stainless steel), and we never remove the source housing from the steel can, which will block more. Then there is the steel tube in the paraffin barrel, the paraffin, and the steel barrel. (note: the tantalum layer in the source housing is a very good gamma shield, so the amount not blocked may be significantly smaller.)
This may present an opportunity to measure the Am-241 content in the source. We could try removing the can from the barrel and taking data. We would need a fast detector because of the high rate, so not phonon sensors - would it work with the HPGe detector? A CDMS-style detector with charge channels is another possibility but it would introduce more layers of metal between source and detector.
These rates help to understand some things you see said about plutonium and PuBe neutron sources. It has been said that PuBe is a “weak gamma emitter”. This seems strange because the gamma rate is similar to the neutron rate. However it is much lower than the alpha rate - and it is much lower than it would be if the alpha emitters also emitted gammas. The presence of Am-241 makes it a much stronger gamma source. It's also said that the presence of Pu-241 in plutonium samples presents a radiation hazard, and we can see why - people working closely with plutonium are exposed to much more gamma activity in a source with Pu-241 in it (after it has decayed for several years) than a source with no Pu-241.
Neutron Energy
The energy spectrum of neutrons produced by the (alpha,n) interactions in PuBe is shown below, plot courtesy of Anthony (I don't know the source):
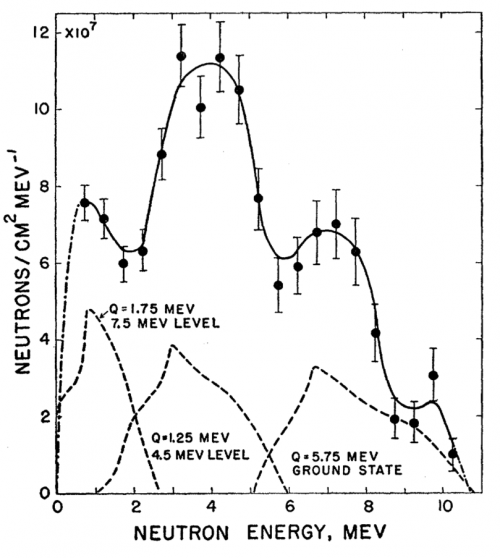
UPDATE: The source of this plot is a 1955 Physical Review article, "Neutron Spectrum and Absolute Yield of a Plutonium-Beryllium Source"
Chemical Composition and Physical Dimensions
This 1973 OSTI report is a safety study of PuBe sources of the exact same type as ours, manufactured at Mound Laboratories by Monsanto Research Corporation. The report gives some details about how the sources are constructed.
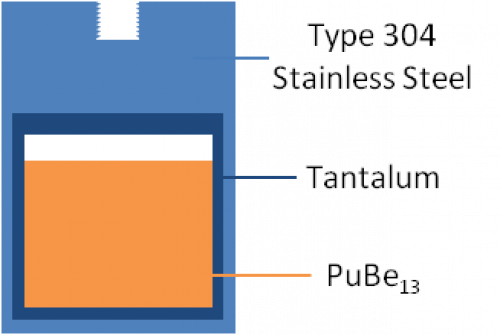
Plutonium and beryllium are melted together in a cylindrical tantalum container. Upon cooling, PuBe13 is formed. The masses given in the source documentation are 15.98 g of plutonium, 7.86 g beryllium. This would form 23.80 g of PuBe13 with a slight excess (0.04 g) of beryllium. According to the PuBe13 density given in the DOE report the volume of the source should be 5.49 cm^3.
After cooling the top of the tantalum container is welded on. This is placed into a cylindrical stainless steel container, also sealed with a welded-on top. The top has a 10/32-threaded hole tapped into it.
The source document gives inner and outer dimensions for the stainless steel and tantalum container. Not enough information is given to determine the individual thicknesses of the steel and tantalum parts. The total thickness of the wall is 0.10 inches (2.54 mm) - this would be the sum of the tantalum and steel thicknesses plus any gap between them.
The sketch below and the following table of known and estimated dimensions should be useful for simulations.
| Figure 3 |
|---|
 |
| Table 5 | ||
|---|---|---|
| Component | Size [in] | |
| Steel outer height | 1.45 | |
| Steel inner height | 0.9 | guess |
| Steel floor thickness | 0.05 | guess |
| Steel outer diameter | 1.02 | |
| Steel inner diameter | 0.92 | guess |
| Tantalum outer height | 0.9 | guess |
| Tantalum inner height | 0.75 | |
| Tantalum floor thickness | 0.05 | guess |
| Tantalum outer diameter | 0.92 | guess |
| Tantalum inner diameter | 0.82 | |
| PuBe height | 0.635 | |
| PuBe diameter | 0.82 | |
Note that tantalum has an electron density 1.85 times greater than stainless steel (it's even 1.5 times greater than lead) so it will improve the gamma shielding of the container.