−Table of Contents
HPGe (High Purity Germanium) Detector
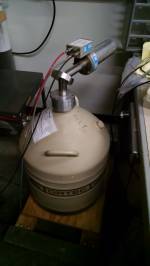
The MXP Lab has a high purity germanium detector that is occasionally used in the class. It is useful for making measurements of high energy gammas.
| Specs |
|---|
| Princeton Gamma Tech |
| Pre-amp: Model RG-11 B/C, Serial 6451 |
| Detector: Model IGC30 ED, Serial 858, +3500V bias |
This detector has been used in the past to measure the background gamma spectrum in Tate. See Allison's note here .
More recently, this detector has been used in PAN. It may be desired to use the HPGe to detect coincident gammas from thermal neutron capture in our detectors. To make this measurement, the HPGe must have a way to communicate with the detector DCRCs. We propose using a spare DCRC to read, trigger on, and digitize the HPGe output.
HPGe setup
A manual for the HPGe is available here. Unfortunately, the data sheet for this particular crystal has yet to be located. We do know, that it is a p-type Ge detector, but it's exact dimensions, expected leakage current, etc. are unknown.
The detector is kept cold by its own 30L LN2 dewar. Like the LN2 cold traps, this has a hold time of ~days, and just needs to be topped off at the end of each day.
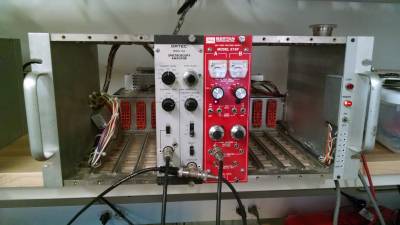
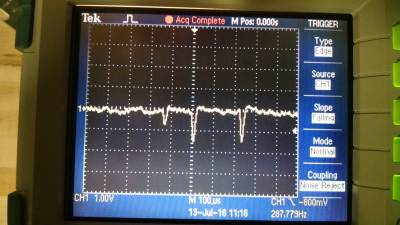
The detector requires a large bias voltage (3.5kV). This is provided by a Bertran 375P HV supply, the red NIM module in the image below. The bias must be brought up slowly over a matter of minutes, making sure the detector is stable along the way. The detector has a built in pre-amplifier. This gets its power from the main amplifier module via a Dsub cable. The pre-amp output then gets fed to the main shaping amplifier. The main amplifier settings chosen were Gain=100 and shaping time=6us. The output of the shaping amplifier can be seen in the scope image below, with a couple pulses visible. Note that this p-type detector is expected to produce negative pulses at the output.
Reading out the HPGe with DCRC and MIDAS
There were two proposed methods for digitizing the HPGe signal with the DCRC; through either the charge, or phonon lines.
Method 1 (ongoing R&D): The first was to use the miniBob(mini break out box) and feed the signal into one of the charge channels. This is preferable due to the faster digitization rate of the charge channels. The miniBob has LEMO connectors for Qi, Qo inputs. These are connected to a circuit which appears to be functionally the same as the cold charge electronics; i.e. coupling capacitor connected to a FET and feedback resistors. It was thus thought that simply connecting a voltage signal to the miniBob LEMO connector would then pipe that signal through all the appropriate circuitry to the charge ADC, just like when operating a detector. However, this does not currently appear to be the case. When connecting a signal generator to the LEMO, the PulseViewer shows that the DCRC seems to be reading the derivative of the input signal. When connecting the output of the HPGe and shaping amplifier, the pulses seem to form “M”s. this is not well understood.
Method 2 (works!): This method makes use of a DCRC RevC.1 feature. These boards have an option to monitor the LED voltages by using the phonon ADCs. In the LED settings in the ODB, there is an option to connect the LED voltage to phonon ADCs. By using this option, one can digitize a voltage signal put across the LED line and ground. To ensure matching input impedance (to say a BNC cable), one should also put a 50Ω resistor in parallel with the incoming signal as shown below.
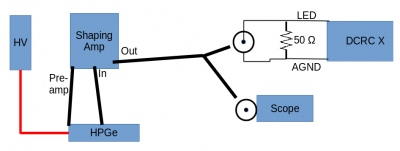
This setup produces the desired result. Signal generator output across the LED line is picked up by the phonon ADC with no noticeable modification. the only downside is that the phonon channels digitize at half the rate of the charge channels, so the trace resolution is not as good as it could be.
Processing HPGe raw data
An initial processing with CDMSbats has been attempted. This was done with our first trial series, an example pulse of which is seen below.
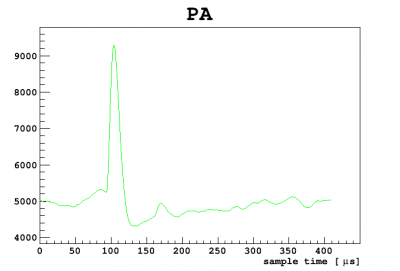
The processing was done with all algorithms turned off except for phonon integral quantities. The processing completed, but the PAINTall RQ has somewhat stupid. The low tails the pulses, negated the pulse areas and the spectrum looked like garbage. Once newer data with improved pulse shapes is taken, this can be improved.
In the mean time, a rudimentary analysis of pulse heights of ~2hours of overnight data reveals the beginnings of a recognizable spectrum. The ratio of the two most prominent peaks is roughly that expected for the 208Tl 2.6MeV and the 40K 1.4MeV lines.
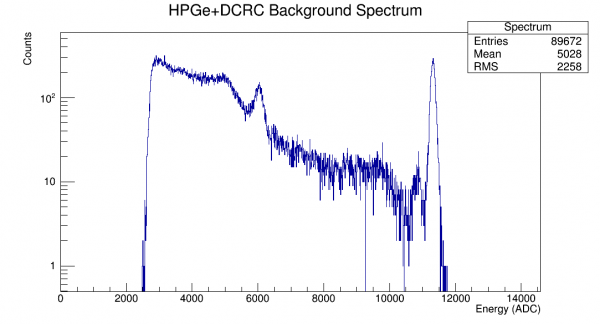
Comparison to previous spectra taken with this detector seem to jive with the high end.
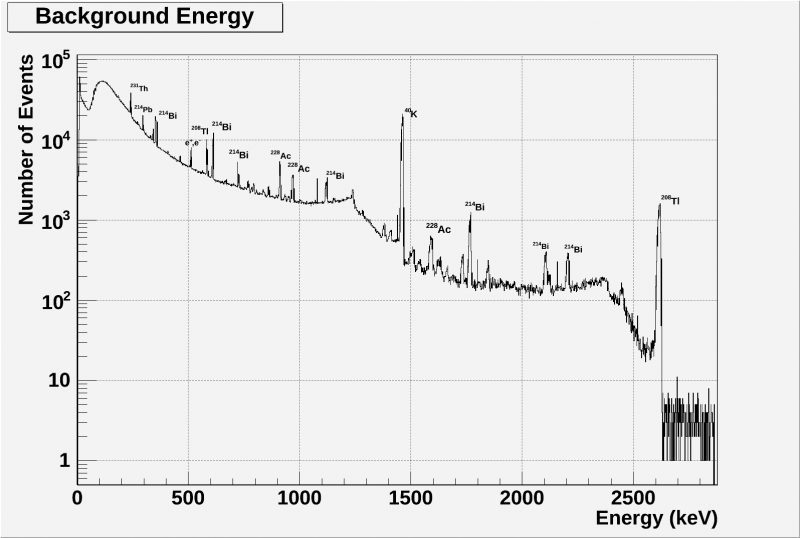
Later spectra, taken in Pan43 without the DCRC are described here.
Later used on Mar 05, 2019, Mar 21, 2019
Finding Thermal Neutron Capture Lines
The HPGe detector is desired to detect thermal neutron capture gammas from the detectors. As a check, a PuBe source has been utilized, along with the HPGe detector, to confirm that these capture gammas can be identified. In a first test with a NaI detector, capture lines from silicon detectors could not be found. Salt was then used to attempt to find chlorine capture lines. It was unsuccessful, so the HPGe detector was desired for its higher resolution than NaI detectors.
First, the HPGe detectors were set up similarly to how they were previously.
| Figure 1 |
|---|
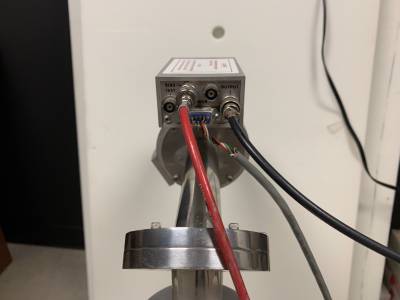 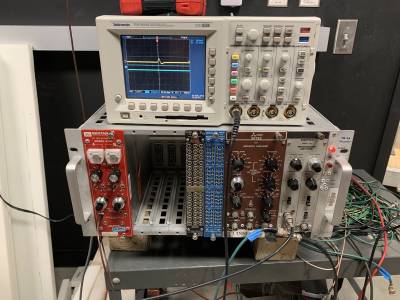 |
| Left: the electronic box on the HPGe detector. Right: the amplifier and high voltage modules along with the oscilloscope displaying a pulse. The red cable goes from the bias input on the detector to the back of the high voltage (red) module. The grey power cable runs from the detector to the back of the amplifier (grey) module. A black cable runs from the detector to the input of the amplifier. The green cable runs out of the amplifier to the Ortec Easy-MCA 8k Channel box that connects to the computer. Finally, another black cable runs from the output of the amplifier to the oscilloscope. The 3 modules in the middle were not utilized. |
It was found that the best parameters for the amplifier to have were a coarse gain of 5 and a shaping time of 6.0μs. A bias of 3.5 kV was applied to the detector by increasing the bias by no more than 100 V/s and stopping for a couple minutes every 1 kV. Also, the brown research amplifier in Figure 1 could also be used in place of the grey spectroscopy amplifier. Both served the same purpose despite the different names.
30 June 2021: A spectrum was taken with the PuBe source in the black paraffin drum, 24 steel sheets in front of the drum and 8 sheets of HDPE behind the HPGe detector. It was discovered that 1200s live time was a good amount of time. Comparing this spectrum with the NaI spectrum with the same setup, four of the peaks were able to be identified. Any peaks beyond about 3000 keV were not able to be seen due to the HPGe's lack of sensitivity at those energies.
| Figure 2 |
|---|
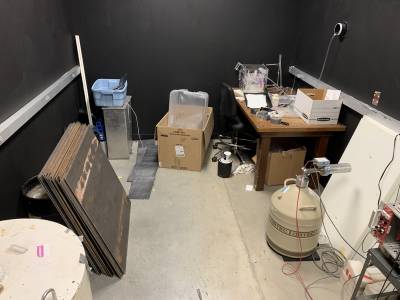 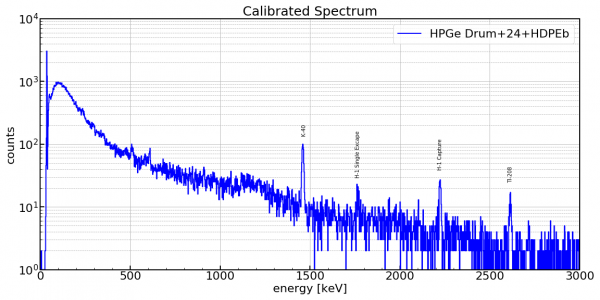 |
| Left: the detector setup with the PuBe source in the drum, 24 steel sheets and HDPE sheets behind the HPGe detector. Right: the spectrum from the setup on the left. |
1 July 2021: A test was performed to find the difference between spectra when the detector was moved closer to the source. To do this, the detector was placed next to the steel and a wall of the fridge shielding was placed behind the detector in place of the free HDPE sheets. This new setup makes more lower energy peaks apparent, but the peak that is believed to be the H-1 single escape peak is not apparent anymore.
| Figure 3 |
|---|
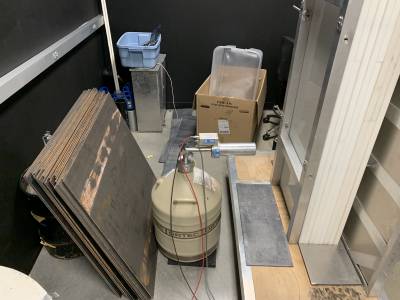 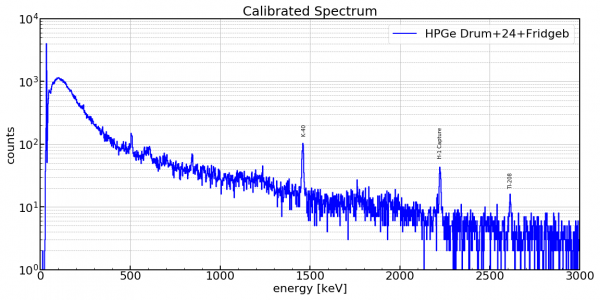 |
| Left: the detector setup with the PuBe source in the drum, 24 steel sheets and the fridge wall behind the HPGe detector. Right: the spectrum from the setup on the left. |