WLS Fiber Trapping Efficiency
Data collected here was reanalyzed. This should be compared to computational data presented here.
| Experimental Data Files |
|---|
| 20140909_muon_fiber.dat |
| 20140912_muon_fiber_foil-mask.dat |
| Experimental Data |
|---|
| Figure 1: Data collected by Hannah/Alex |
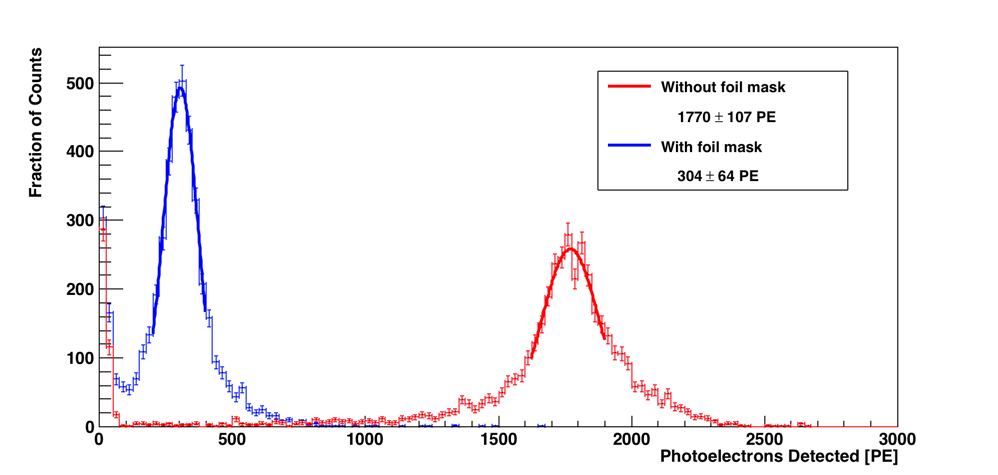 |
| The percentage 100*(w/ mask peak)/(w/o mask peak) is (17.2±3.8)%. |
| Computational Data | ||
|---|---|---|
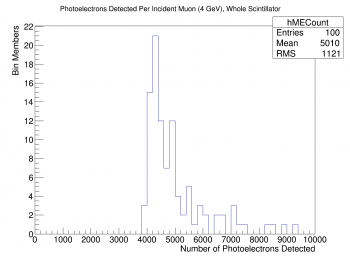
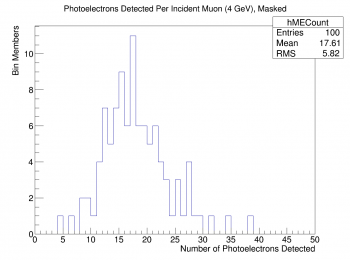
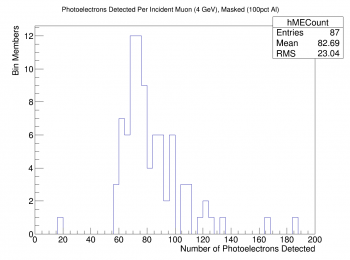
| Figure 2: “Whole Scintillator” Muon run | Figure 3: Al Mask (R=0.95) Muon run | Figure 4: Al Mask (R=1.00) Muon run |
 |  |  |
- Possible reasons:
- QE spectrum was given for 1800V, measurements at 2000V
- Pencil beam of muons
- Relative geometry of football-shaped sample