−Table of Contents
TB4 Board and CPTA-151 SiPM characterizations
Compare with Alex and Hannah's previous measurements. SiPM A here is SiPM 3 on those pages.
TB4 Board
Channel 4 is unable to apply a constant bias and accurately read out pulses from SiPMs.
Saturation Point
Data was collected for this measurement on 2017/08/05.
Setup
To measure the saturation point of the TB4 board, pulses of known voltages were sent into each channel of the TB4 board.
| Experimental Setup | |
|---|---|
| First Step | Second Step |
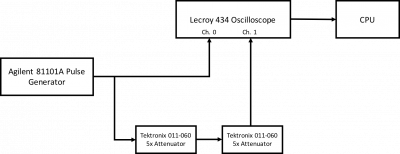 | 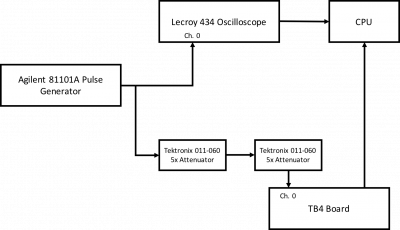 |
| Lecroy ch. 0: 1 MOhm termination | Lecroy ch. 1: 50 Ohm termination |
| Pulse generator settings: Freq. = 30Hz, Mode = Compliment, Delay% = 95%, Width = 200ns, LeadE = 30.0ns, TrailE = LeadE, Offset = 0mV, Amplitude = varied from 50mV to 1V, term. = 50ohm to 50ohm | |
| Due to the voltage offset created by the bias applied by the TB4 board, the attenuators could not be placed before the junction coming out of the pulse generator the oscilloscope could not display such pulses. Thus, first to determine the actual reduction in pulse amplitude, the procedure shown above was used. It was found that Vatten = (0.038±0.01)Vo. | 1000 data points were collected at each voltage for both the oscilloscope and the TB4 board. The average pulse amplitude and the standard deviation were determined across all trials. |
Analysis
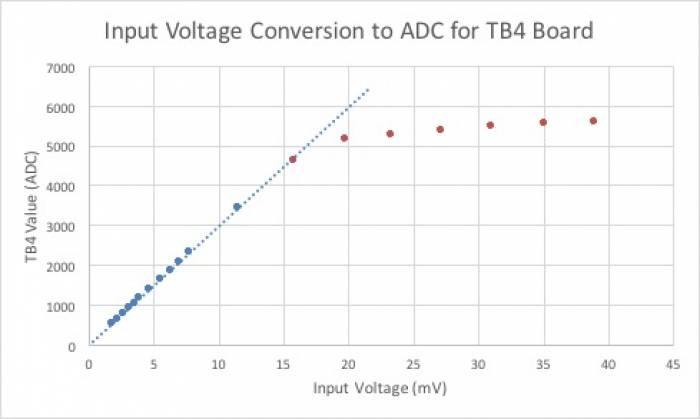
All ADC values plotted have been baseline subtracted. To convert to the ADC value displayed by the TB4 program scope, add 8200 to the ADC value.
| Linear Fits To Data | |
|---|---|
 |
|
| The input voltage values on the x-axis have been corrected for the attenuation. Both x and y error bars in all graphs are smaller than data points. While not visible, the standard deviation of points at or below 4615.1 ADC was about 7 ADC. At 5166.8 ADC and higher, the standard deviation increased suddenly to about 15 ADC. | |
| Plot | Chi Plot |
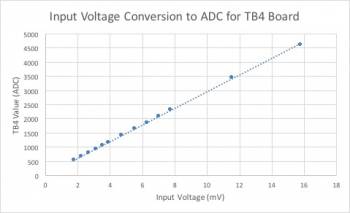 | 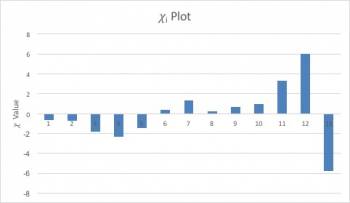 |
| Data collected from the range [1.772, 15.75] mV was fit to a linear model. This range was initially selected as the ADC standard deviation increased notably for data points greater than 11.51 mV. A least-squares fit gave the following equation: y = (15.9+/-3.7) + (294.5+/-0.5)x. | The reduced chi-squared value of this fit was 8.6, larger than the desired value of 1. One can also see that the chi plot shown above isn't entirely random, indicating a poor linear fit. |
| Plot | Chi Plot |
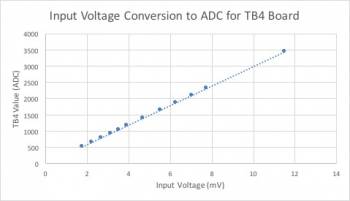 | 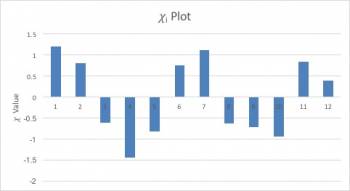 |
| A range of [1.772, 11.51] mV was selected for this plot to try to improve the reduced chi-squared value of the fit. A least-squares fit gave the following equation: y = (-7.7+/-4.5) + (299.8+/-0.8)x. The intercept has units of ADC and the slope has units of ADC/mV. | The reduced chi-squared value of this fit was 0.97, very close to the desired value of 1. The chi-plot appears to have a random distribution, indicating a good linear fit. |
It was determined that the TB4 board saturation point lies between (11.51+/-0.02)mV and (15.75+/-0.03)mV, or equivalently (3446+/-7)ADC and (4615+/-7)ADC. More data may be collected in the future between these values to determine exactly where the TB4 board saturates. The TB4 documentation indicates that the saturation point lies near 13000 ADC, which, after subtracting the baseline of 8200 ADC, roughly agrees with the experimental values.
Bias Voltage Conversion
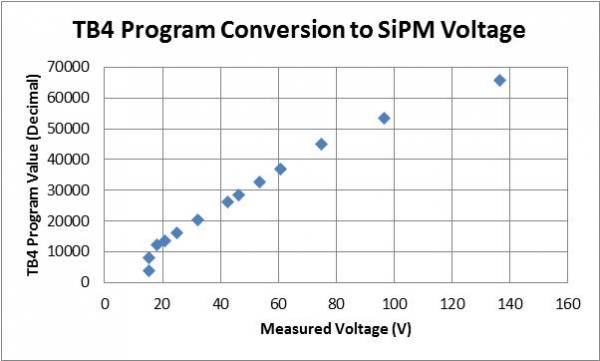
Data for this measurement was collected on 20170805. A digital voltmeter was connected directly to each channel. Originally, the voltage across a 500kOhm resistor was measured, but this gave values that were roughly half of those indicated by the TB4 documentation for a given bias. The “Bias_Set_Point” parameter of the “.tb4” control file was altered to determine the conversion from the computer hex code to a voltage applied to the SiPMs.
| “Bias_Set_Point” register conversion to actual voltage in TB4 program | ||
|---|---|---|
| Hex Value of Register in Program | Decimal Conversion of Hex Value | Measured Voltage (+/- 0.1 V) |
| 1000 | 4096 | 15.3 |
| 2000 | 8192 | 15.3 |
| 3000 | 12288 | 18.2 |
| 3600 (Russian SiPM bias) | 13824 | 20.7 |
| 4000 | 16384 | 25.1 |
| 5000 | 20480 | 32.2 |
| 673F | 26431 | 42.5 |
| 7000 | 28672 | 46.1 |
| 8000 | 32768 | 53.6 |
| 9000 | 36864 | 60.7 |
| B000 | 45056 | 75.0 |
| D000 | 53248 | 96.5 |
| FFFF (maximum value) | 65535 | 136.5 |
| Figure: SiPM Bias Voltage Conversion from Hex | |
|---|---|
 |
|
| The linear regime of the plot, [3000,B000] in hex, was fit using a chi-squared model. The fit equation was determined to be y = ( +/- )x + ( +/- ), where y is the decimal value of the register in the TB4 program and x is the desired bias to be applied to the SiPMs. The slope of the equation has units decimal/V and the intercept has units of decimal. | |
| Linear Fit | Chi Plot |
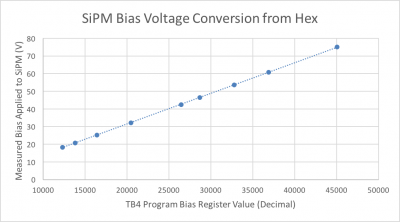 | 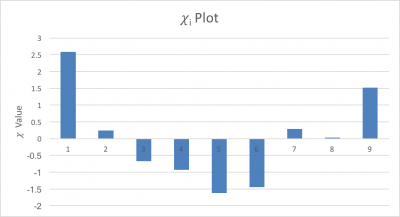 |
| A least-squares fit gave the following equation: y = (-3.32+/-0.04) + (173.7+/-0.2)*10-5x, where the slope has units of V/decimal and the intercept has units of V. | The fit had a reduced chi-squared value of 2.17, indicating a good linear fit. |
CPTA 151 SiPMs
The electrical conductance of an unbiased SiPM was measured using a DVM to be (4.2±0.1) nanosiemens, corresponding to a resistance of (238±6) MΩ.
| Summary of SiPMs | |||
|---|---|---|---|
| SiPM Label | Tab Color | Number | Status |
| A | Best SiPM | ||
| B | Second best SiPM | ||
| C | Not great, but somewhat useable | ||
| D | Completely unusable | ||
External Trigger
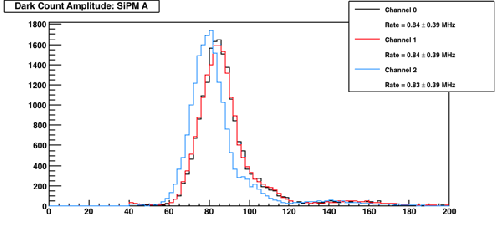
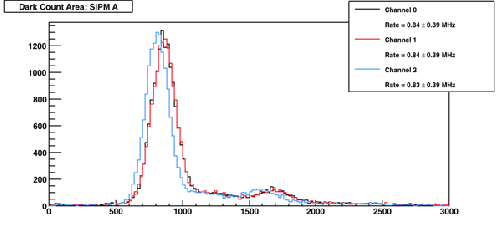
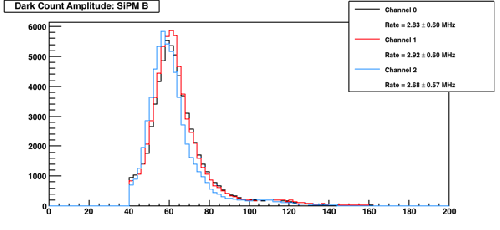
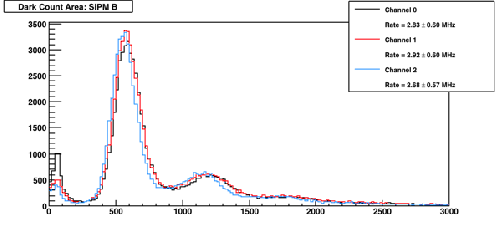
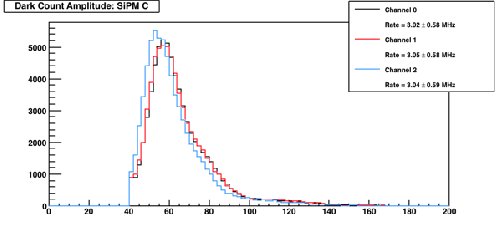
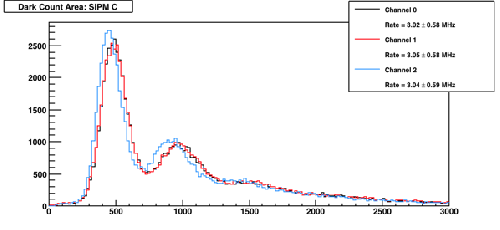
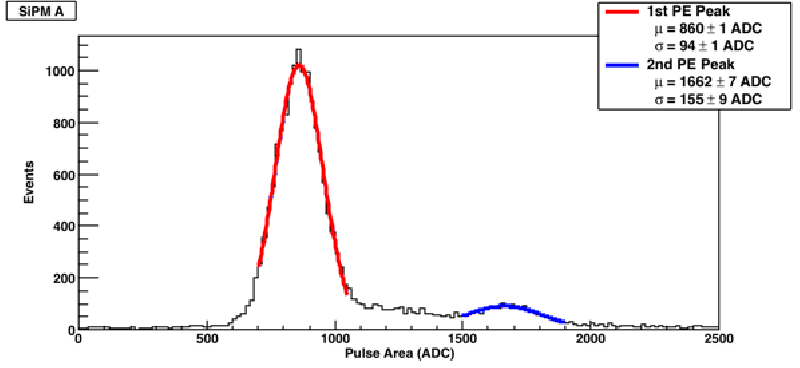
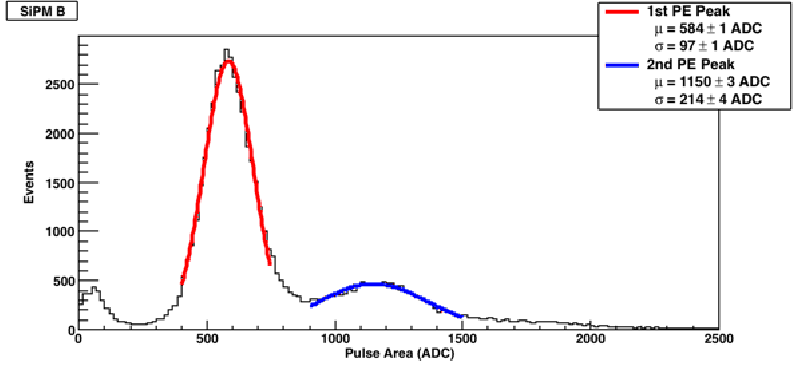
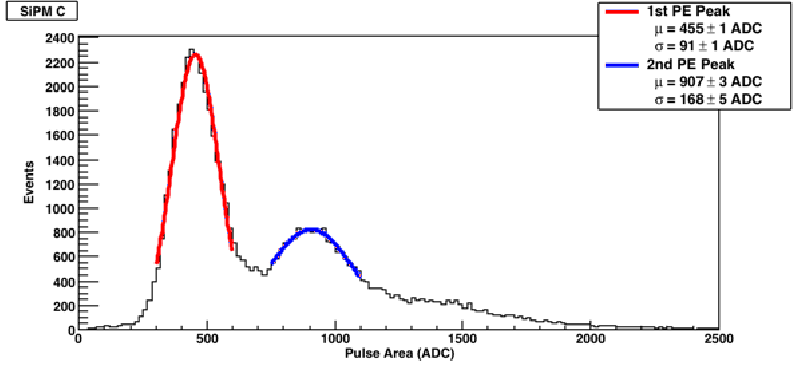
The TB4 was externally triggered using a pulse generator. The channel to which each SiPM was connected to was varied.
| Figure: “sipm_characterization.C” | |
|---|---|
| Amplitude | Area |
| SiPM A | |
 |  |
| SiPM B | |
 |  |
| SiPM C | |
 |  |
| Figure: Photoelectron peak fits (“sipm_characterization_PEfits.C”) |
|---|
 |
 |
 |
Muon Runs
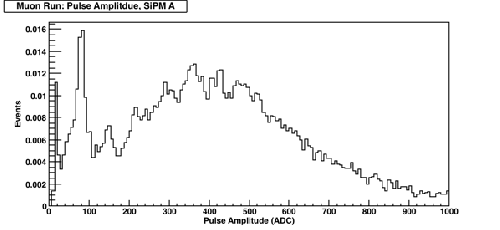
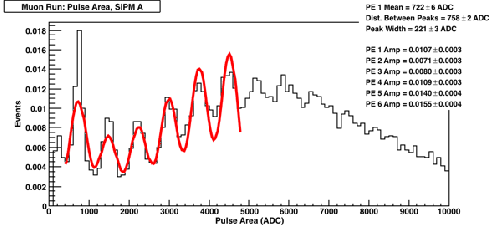
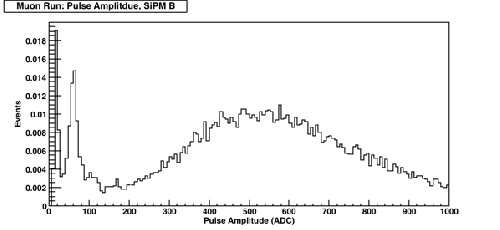
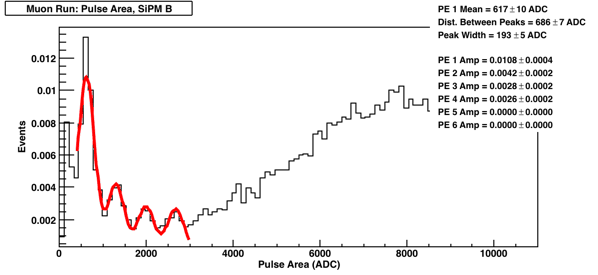
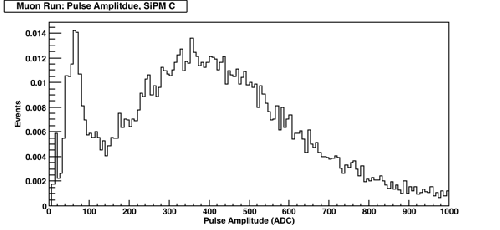
Muon data collected shown below was collected on 20170428. Analysis was redone on 20170718.
| Figure: Photoelectron peak fits using muons (“sipm_characterization_muon.C”) | |
|---|---|
| Amplitude | Area |
 |  |
 |  |
 | 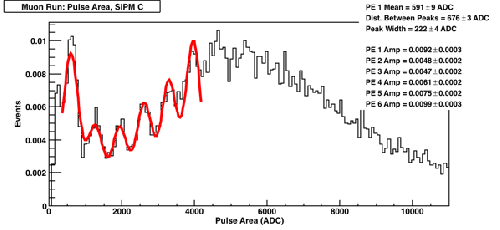 |
| Compare with Alex's data here | |
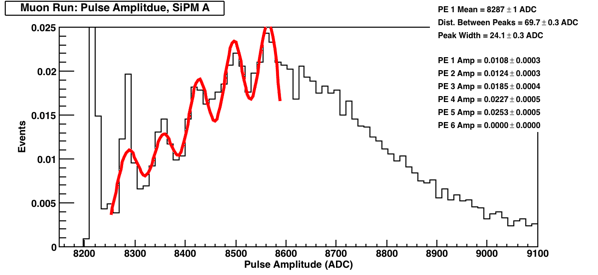
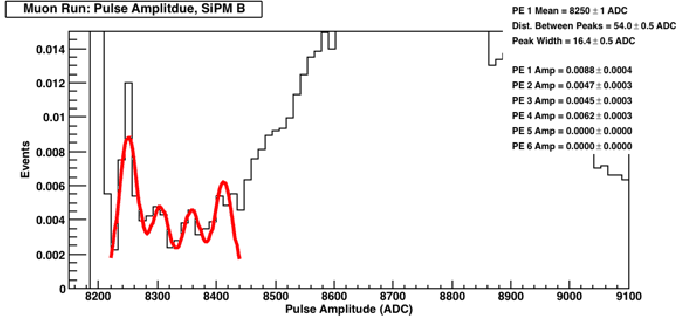
The analysis below was done on 2017/08/10 of muon data collected on 2017/04/28. The objective was to determine what threshold should be set in terms of photoelectrons.
| Figure: Fits to find trigger thresholds in terms of photoelectrons |
|---|
| Amplitude |
 |
 |
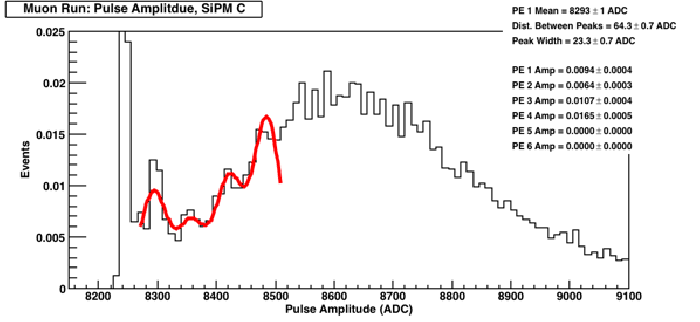 |
To obtain thresholds from this data, the equation is: Threshold = (PE 1 mean) + (n - 1.5)*(Distance between peaks), where n is the number of photoelectrons one desires to trigger on. Consequently, a 2 PE threshold run for SiPM A would have a threshold set at 8322 ADC.A 2 photoelectron trigger is the smallest value that should be used, given DAQ speeds as compared to dark count rates.
Summary
| Table: Summary of problems encountered with SiPM setup | |
|---|---|
| Problem | Solution |
| Fluctuating background | |
| Peak location | For runs that are internally triggered whose pulse are less than 150 bins long, the amplitude of the pulse is determined by the hist→GetMaximum() function. The edges of the pulse are determined when the average of a bin and the 3 bins prior to it are less than 10% of the pulse amplitude. Dark count peaks are found by . |