R71 Position Reconstruction Procedure
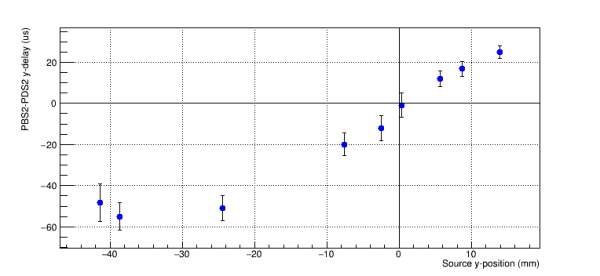
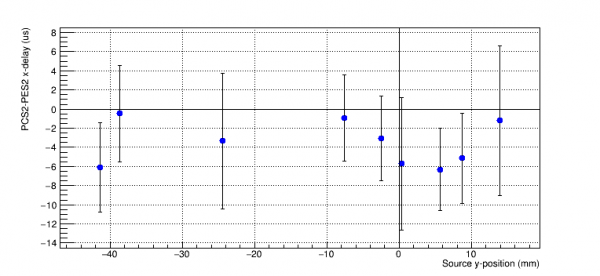
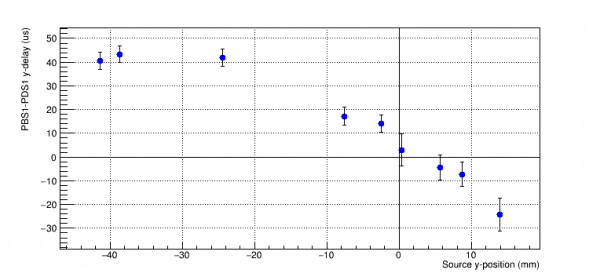
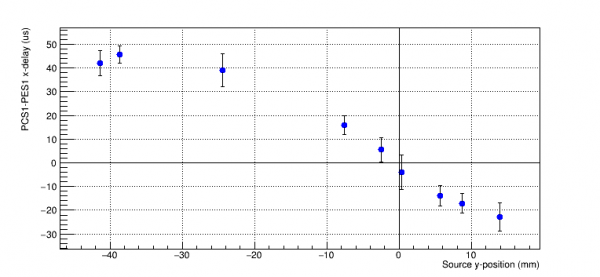
Repeating the phonon delay calculations done by Nick. In each plot using gaussian fits of the WKr30 values for each phonon channel with the plots for side 2 on the left and the plots for side 1 on the right.
  |   |
|
Due to a 45 degree shift of the phonon channels on side 1, we see a linear relationship in both x and y delays. These two delays can be combined to produce a radial “xy-delay” = sqrt(x-delay^2 + y-delay^2).
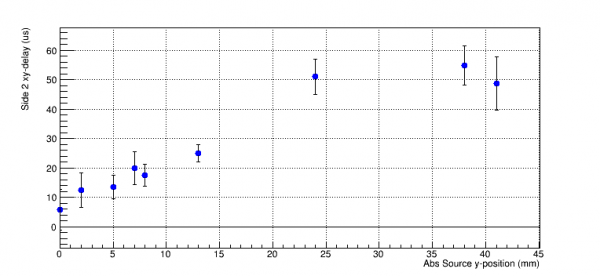 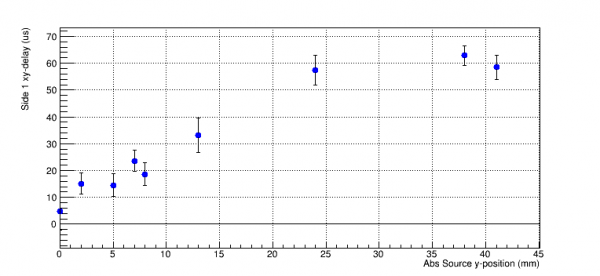 |
To work around the curl at farther out source positions, we can use the delay between channels F and A.
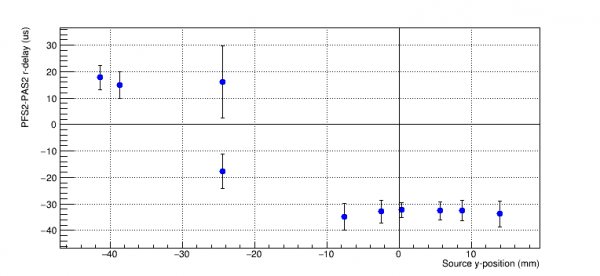 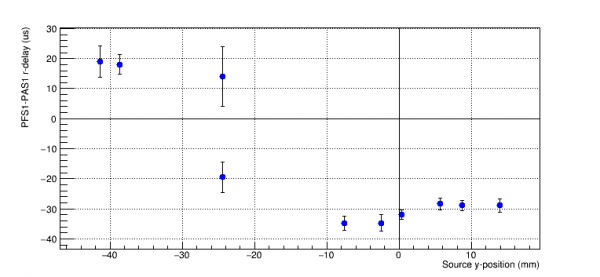 |
The 3rd position's data on the r-delay plot is double peaked, its histogram is shown below. The x-axis is PFS2WKr30-PAS2WKr30(us).
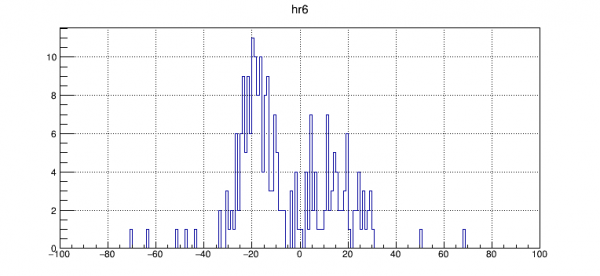 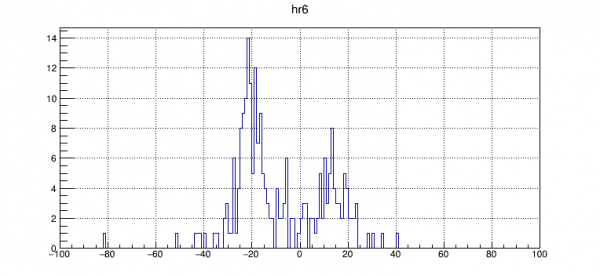 |
A plot of (PFOFRC-PAOFRC)/PSum vs PFS2WKr30-PAS2WKr30(us) at this position is shown below (side 2: left, side 1: right).
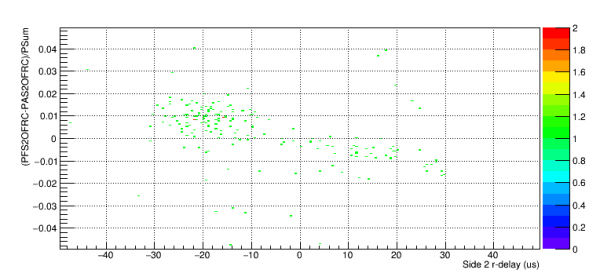 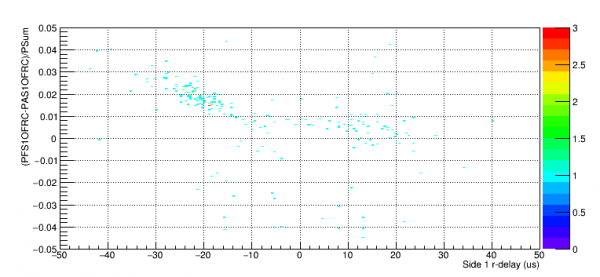 |
Using a simulation of the source carriage setup, we can see how much spread there is to the 60 keV beam.
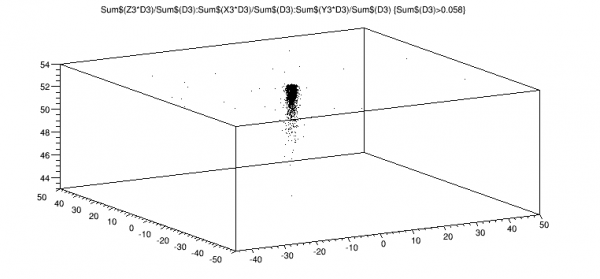 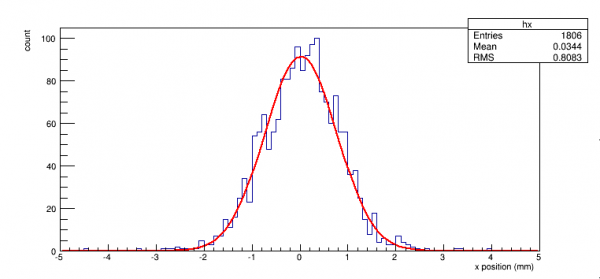 |
In both directions, we see a gaussian spread with sigma = 0.75mm, assuming the two peaks are separated by 2*0.75mm we can see if the r-delay plot makes any more sense.
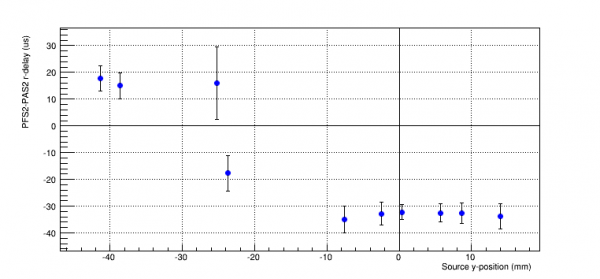
There are 3 points which are outside of the F channel, they can be offset by 60us and combined with the previous xy-delay.
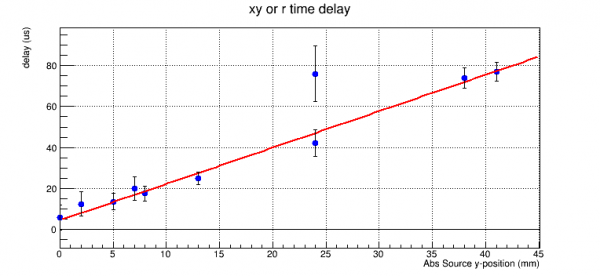 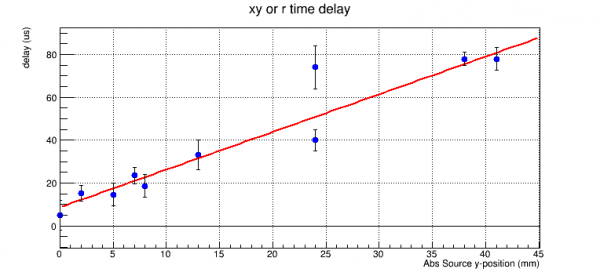 |
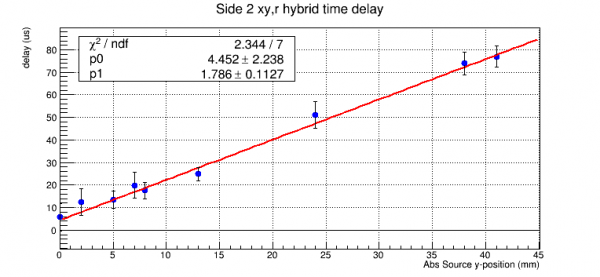
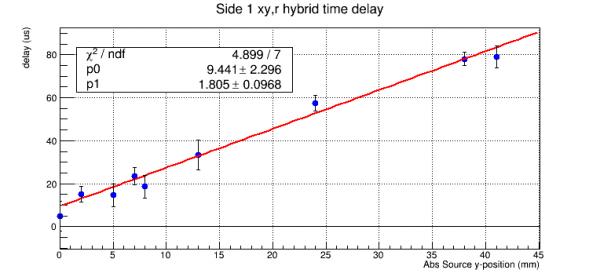
Neither of the peaks on the 7th point seem to match very well, so we can instead use the xy-delay for that point.
  |
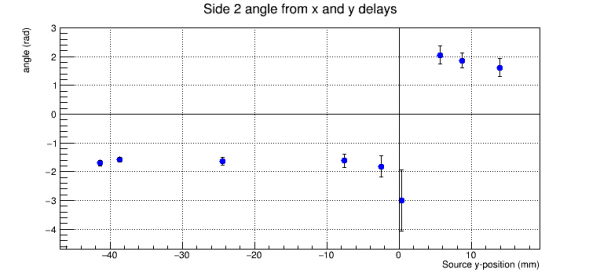
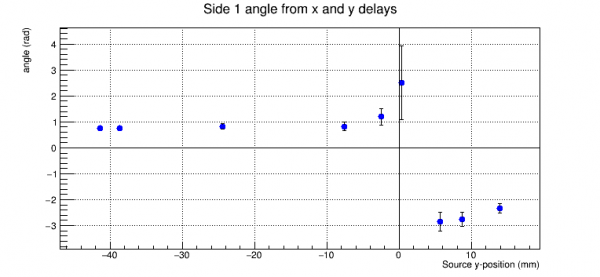
Using the x-delay and y-delay, we can also estimate the angular position of the source.
  |
Using the delay vs position fit, we can reverse the process and calculate the position, where xy-delay is used when PFS2WKr30<PAS2WKr30 and r-delay is used otherwise.
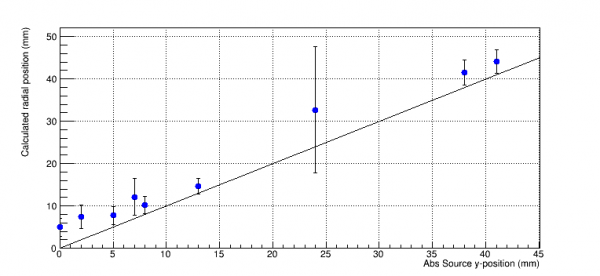 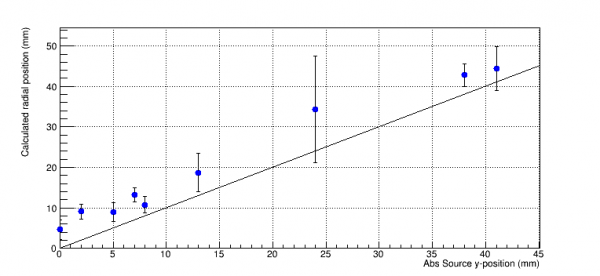 |
An ideal line of slope 1 is drawn, showing that there is a slight unexpected offset, possibly due to an offset in the source mover setup.