Table of Contents
R71 Phonon Delay Quantities
XY (B,C,D,E) Delays
Bulk 60keV events were selected with cuts on the Q1 energy range, Psum energy range. An additional cut was made requiring either a high PFS2 or PBS2 fraction depending on the source position. Phonon channels all have relative calibration applied. X and Y delays use the difference of WKr30 quantities for the 4 inner-ring channels B,C,D, and E.
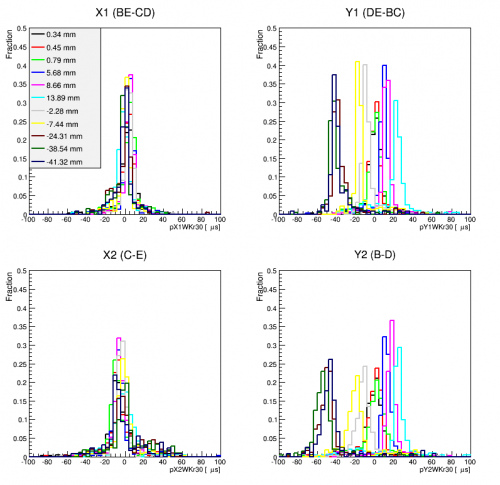 | 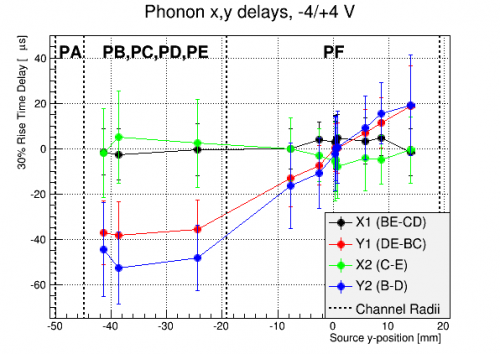 |
| Phonon xy 30% delays for -4/+4 V data. | |
|---|---|
These quantities are most sensitive when the event is under channel F and demonstrate decreased sensitivity, and even foldback, for events under one of the channels which is used in the delay calculation.
This analysis was repeated using a better estimate of the pulse start times. In particular, the 0% rise time was extrapolated from the 30% (used above) and 10% rise times. With this quantity, the same general trends are observed, but the delay magnitudes decrease somewhat.
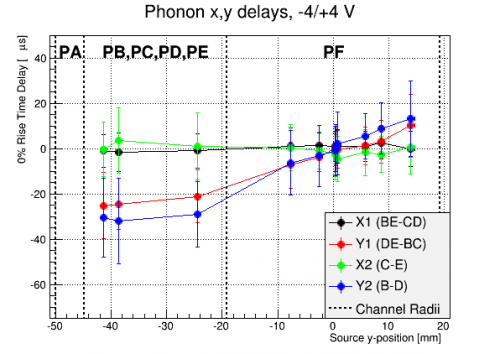 |
| Phonon xy 0% delays for -4/+4 V data. |
|---|
Radial (F,A) Delay
Using the same event selections as above, we can also study the radial delay quantity which uses the outer ring, A, and central channel F. Similar to the XY quantity, this exhibits the most sensitivity when the event is not under one of the channels used in constructing the quantity.
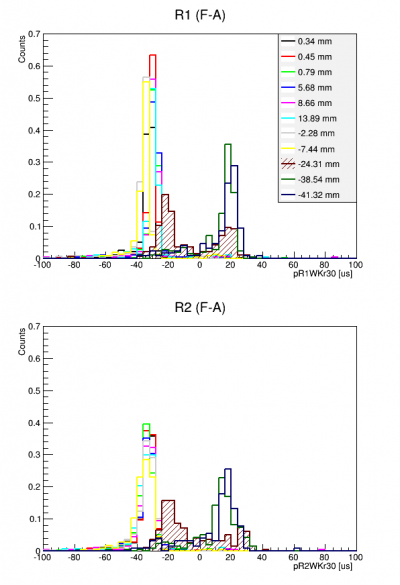 | 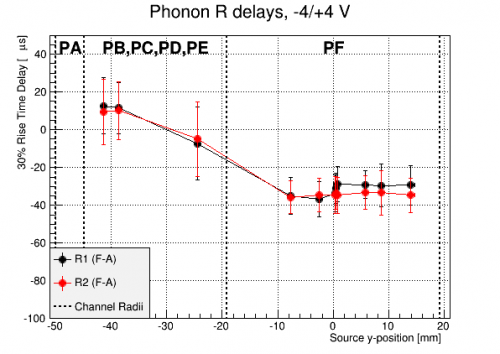 |
| Phonon R 30% delays for -4/+4 V data. | |
|---|---|
Note, however that at the position nearest to the border between PF and the inner ring channels, the distribution of radial delays has a different characteristic shape that at other locations. It appears to have 2 regions of high density, each near the population of other inner/outer events. Since the mean of the distributions in the left figure were used in constructing the graphs in the right figure, the sensitivity in the inner ring may appear more concrete than it really is.
Again, when using the extrapolated 0% delay, the delay magnitudes decrease.
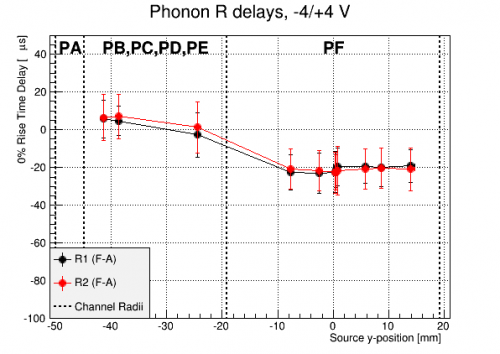 |
| Phonon R 0% delays for -4/+4 V data. |
|---|
Phonon Propagation Implications
We can try to interpret these results by examining the slope of the Y quantities when near the center of the detector. In this region, the Y delay quantities are roughly linear, with Y1 (Y2) having a slope of 0.65 (0.48) km/s. The events are near surface 2, and if we assume the phonons are moving in a straight line from the event location to the channels, the Y2 delay, from B2 to D2, would be simply due to the amount by which the source has been moved closer to one or the other channel. Then slope of Y2 would give half the phonon propagation speed, and this speed would be then 0.96 km/s.
Similarly, if we consider the Y2 delay when the event is under channel B2, it would be due to the propagation from B2, on one side of F2 , to D2, on the other side of F2. The propagation speed would then be ~40 mm / 50 us = 0.8 km/s.
However, these are ~5-7x lower than the Ge sound speed of <m>c_s</m> = 5.4 km/s near which ballistic phonons propagate (Depending on the phonon species, propagation speeds are measured to be 3-6 km/s in Ge). So this simple, straight line propagation model of the phonon signal is inadequate to describe the phonon arrival times.
Diffusive Limit
We can try another extreme model, where the phonons only travel diffusively, i.e. when they are first reaching channels other than the primary, they are not yet ballistic. If they have a mean free path <m>\lambda</m>, and scatter N times, they will diffuse a distance <m>\sigma = \lambda \sqrt N</m>, while the total distance the phonon traveled between collisions is <m>L=N\lambda</m>, which gives us <m>sigma = \sqrt{\lambda L}</m>. Now, we can compare the effective speed, <m>c_{eff}=\sigma/{\Delta t}</m>, to the sound speed, <m>c_s = L/{\Delta t}</m>. The ratio gives: <m>c_{eff}/c_s = \sigma/L = 1/{\sqrt {N}}</m>.
Our measurements indicate a mean free path of<m>\sigma</m> = L/7 – L/5 with the number of scatters being N = 25 – 49. This represents a lower limit on <m>\lambda</m> and an upper limit on N, it's the slowest path the phonons could take in propagating through the crystal.
Ballistic Limit
We can think more carefully about the ballistic limit, wherein the phonons come out from the location they are created (either the recoil site or along the charge's transport path) and move straight through the detector, only reflecting at crystal edges or being absorbed by TES fins. In this case, the ratio of effective speed to sound speed is just the ratio of the straight-line distance to the total distance, L. L depends on the crystal geometry and phonon path through it, but on average its the detector length scale, <m>L_det</m> (something like R=50 mm or h=33 mm) times number of bounces, N.
We can then say <m>c_s = {N L_det}/{\Delta t}</m> which gives N=4–6. This limit assumes that the phonons only interact with the sidewalls so they must have a mean free path at least as long as <m>N L_det</m> and a lifetime as long as <m>\Delta t = 50 us</m>.
The truth is somewhere in between these two extremes. The initial, high-energy phonons which are produced in the recoil or via NTL effect move diffusively and decay. As they do so, their mean free path gets longer, eventually reaching the scale of the detector size. They then may bounce off a few bare crystal faces before being absorbed in a TES. This whole story has focussed on the first phonons to reach a non-primary phonon sensor. The bulk of the phonons come over the next ~100 us, and they may have spent more time diffusing or bouncing around ballistically.
Arrival Times
Another way to study the propagation is by looking at the arrival time of phonons at the various channels. We can use the charge signal to determine when the event first occurred, and study how long after that each channel first saw phonons. This was done for the same set of series studied above, using the same cuts and same set of bulk 60 keV events. The start time of each event was taken as the 20% rise time of the largest charge signal in the event. Then the average delay from this to the extrapolated 0% rise time of each phonon channel was calculated.
An example of these distributions is shown in the figure below for an event near the detector center. The F channels observe phonons first, with S2, near the event, slightly sooner than S1. Then the inner ring channels all see the phonons, and finally the outer channels.
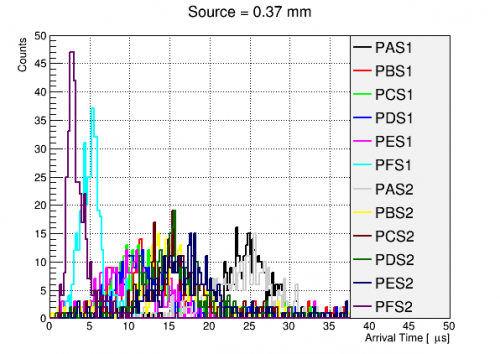 |
| Phonon arrival times near r=0 |
|---|
To study these delays, we plot them for all series as a function of the azimuthal distance to the center of the relevant phonon channel. In other words, the horizontal distance from the NTL phonon column to the channel center.
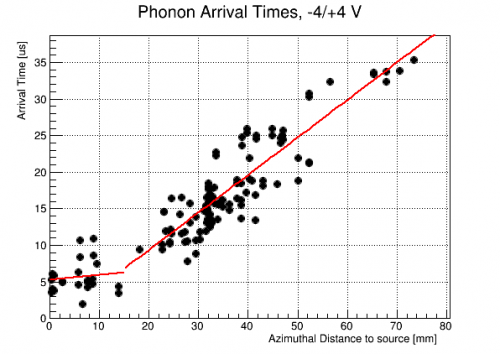 |
| Phonon arrival times as a function of azimuthal distance from source to channel center |
|---|
There might be 2 different regimes here, though the fitting does rather guide the eye. These slopes are in units of us/mm, so they imply speeds of 1/(0.065495 +/- 0.116515) km/s = 5.5–inf km/s and 1/(0.51243 +/- 0.0258283) km/s = 1.9–2.1 km/s .
Can we somehow argue the fast, close speed is diffusion and the slower, further speed is ballistic with bouncing? I expected the opposite, with a slow, diffusive start, then fast ballistic. Maybe the diffusion is close to the sound speed and the phonons can go more or less straight to the nearby channel and hang out there where there's plenty of chance to be absorbed. But then those that go ballistic bounce off a bunch of bare crystal before hitting Al, so they're effectively much slower to get around to the further channels. In other words, the initial diffusive cloud is dense and local and the ballistic guys are thinner and all over.
In order to gain more clarity, we can remake this plot but use the shortest azimuthal distance to each channel instead of the distance to the center. i.e we'll assume the phonon signal starts to rise as soon as the first wave of phonons reaches the edge of the channel. This will shorten up the distances and maybe give a better sense of the speeds involved.
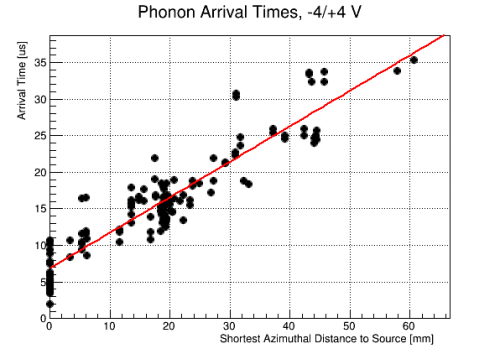 |
| Phonon arrival times as a function of azimuthal distance from source to nearest channel edge |
|---|
Now much of the short distance behavior is collapsed to distance 0, when the source is directly above, or adjacent to, a channel. The overall trend is giving a speed of 1/(0.485088 +/- 0.0172278) km/s = 2.0–2.1 km/s.
TODO: Surface NTL phonons from h+ are more diffusive/less ballistic than from e-. (Pyle p188) Bulk NTL are ballistic. Can we use this to see diffusive arrival times at nearby phonon sensors and ballistic at far away? Consider arrival times for sides separately?