Run 71 Relative Phonon Calibration
The phonon channels for this iZIP detector were balanced using data during the F-position in the S1/S2 = +4/-4 V mode. The data was originally fit along the entire length of the channel band, but was re-scaled and re-fit for the lower energy events that should be closer to the 60 keV peak which is our region of interest for this run.
The series used are as follows:
TString seriesF[]={"07191115_1458","07191115_1835","07191115_2036","07191115_2238","07191116_0039","07191116_2043","07191116_2245","07191117_0047","07191117_0249"}
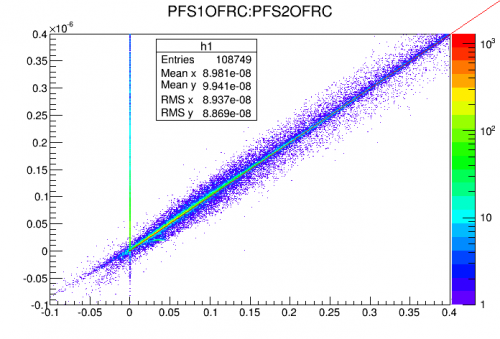
NOTE: Some of the series used had a railed PFS2 for the duration of the data but some of it was fine. This should not affect the overall calibration as the railed series simply won't contribute to the calibration plot.
| Figure 0: PFS2 plot with some railed data |
|---|
 |
The calibration was done by plotting all channels on side two and side one against pF side 1 using the optimal filter algorithm. The channels were balanced based on a linear higher density “blue” area of data near low energy. This linear area was set to have a slop of one for all channels. These initial relative calibrations were then normalized and checked again for consistency. Some representative figures are shown below.
| Figure 1a: PFS1:PAS1 before re-fit | Figure 1b: PFS1:PAS1 after re-fit |
|---|---|
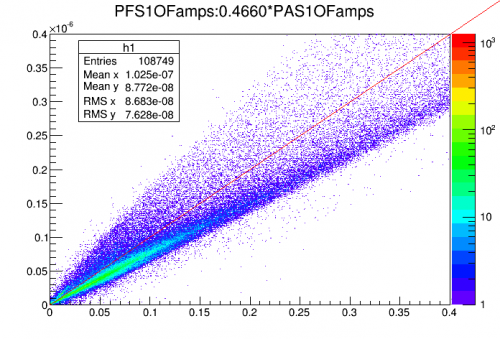 | 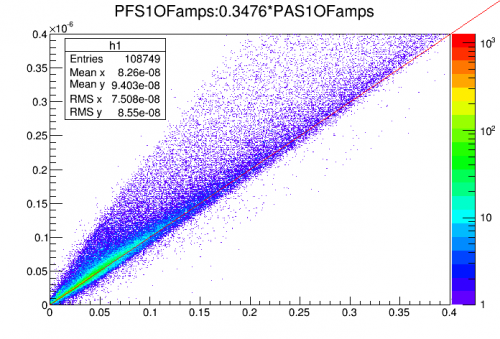 |
| rc pre-normalization: 0.4660 | rc pre-normalization: 0.3476 |
The relative calibrations for each channel were normalized and a representative plot is shown below.
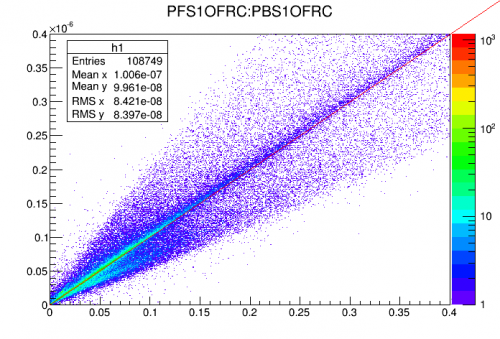
It also appears that the channel above, PA isn't very symmetric, so PA on side two is also plotted for comparison. It appears that on both sides of the detector PA lacks the same symmetry that the remaining channels (represented by figure 3b) present. It's likely due to the different geometry of the channels since PA is the only ring channel in this arrangement and it's the outermost channel which also likely has some influence on the phonon physics and collection in that area.
| Figure 2a: PFS1:PAS1 Normalized | Figure 2b: PFS1:PAS2 Normalized |
|---|---|
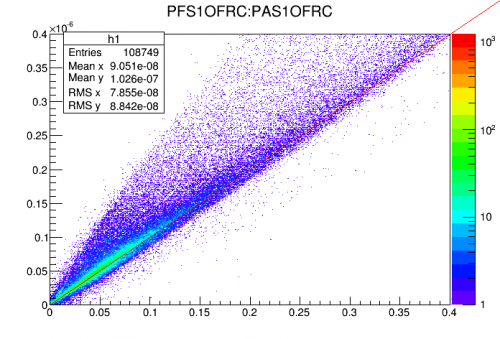 | 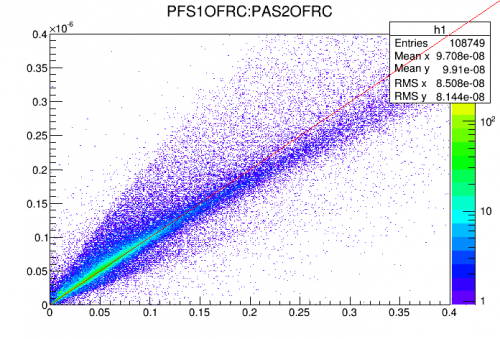 |
Both of the above figures shows a series of events that appear to be mainly PF indicated by the small tail near the upper edge of center trailing near the y-axis. There appears to be a lack of a second series that would be mainly PA, instead just a secondary blob of events. It's not totally clear why this is, but the best guess is that it's a channel with a different geometry and location than any of the other channels. This appears to persist with other channel combinations as well, not just when compared to PFS1.
| Figure 3a: PFS1:PAS1 Normalized | Figure 3b: PFS1:PBS1 Normalized |
|---|---|
| |  |
With the normalized values, they can be loaded into the data to construct the appropriate value of pSum as follows:
Double_t rc[]={0.4057,1.3015,1.4006,0.7625,0.8622,1.1672,0.8622,1.3502,0.7290,1.1731,0.7768,1.2077} //ordered as PAS1,PBS1,PCS1,...
TString names[]={"PAS1","PBS1","PCS1","PDS1","PES1","PFS1","PAS2","PBS2","PCS2","PDS2","PES2","PFS2"}
for(i=0;i<12;i++)z0->SetAlias(Form("%sOFRC",names[i].Data()),Form("%f*%sOFamps",rc[i],names[i].Data())) //construct individual relative calibrations
z0->SetAlias("PSum","PAS1OFRC+PBS1OFRC+PCS1OFRC+PDS1OFRC+PES1OFRC+PFS1OFRC+PAS2OFRC+PBS2OFRC+PCS2OFRC+PDS2OFRC+PES2OFRC+PFS2OFRC") //construct PSum