Table of Contents
R70 SQUID Temperature
We modified a SQUID on an unused channel so as to short out the TES branch. This should give us a way to study the resistance or wirebonds at the SQUID and the SQUID temperature. The relevant part of the circuit is shown below with wirebonds marked as resistance R_B (really, each R_B is a pair of wirebonds in parallel). This assumes that wirebonds are the only source of parasitic resistance on the SQUID chip and all wirebonds have equal resistance.
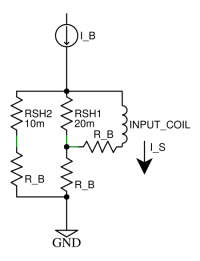 |
| Fig 1: Shorted TES loop circuit |
|---|
I_B/I_S
This circuit gives the following I_B/I_S relationship:
 .
Note that this circuit is linear, so the result also holds for dI_B/dI_S. We will measure I_B/I_S and calculate R_B. The above expression can be rearranged to a quadratic of R_B.
 .
Given a measured value of I_B/I_S and assumptions for the shunt resistor values, R_B is easily calculated easily.
Noise and Temperature
The only noise source in this circuit should be the thermal Johnson noise of the resistors. This is a voltage noise of
 which drives a current signal that is read out by the SQUID amplifier. Here we are using the resistance of the TES/Rsh loop as seen by the input coil,

As described in Note 39 the inductance of the input coil attenuates this signal above  , but the low frequency noise spectrum should approach the value
 which is then relates to the SQUID temperature as

Data
Ib/Is data was taken on 2019/05/25 and 2019/06/05 on the shorted SQUID channel. The formulae above allow a bond resistance to be estimated. As can be seen in the table below, the inferred bond resistance is unchanged across two orders of magnitude in MC temperature. This is strong evidence that the Al wirebonds have not gone superconducting and thus must be >1.2 K.
| Tower | Vo/Ib (mV/uA) | Ib/Is | R_B (mΩ) |
|---|---|---|---|
| 4.7 K | -16.9 | 1.53 | 3.0 |
| 3.1-2.5 K | -17.1 | 1.51 | 2.9 |
| 47 mK | -16.9 | 1.53 | 3.0 |
Note that the R_B calculation assumes values for the shunt resistances. Here we use values that are 25% higher than the nominal values. This is informed by 4-wire measurements done at Berkeley, which indicate some may be as much as 40% higher than nominal values, with the measured value for ZC13pB (the currently shorted channel) being 25 mΩ.
Noise data was also collected for the shorted SQUID channel as well as for a SQUID channel with an open TES loop. The SQUID noise from the open loop channel was subtracted from the total noise on the shorted channel, and the remaining passive Johnson noise level was measured. Using the inferred R_B values, the temperature of the SQUID card was then calculated.
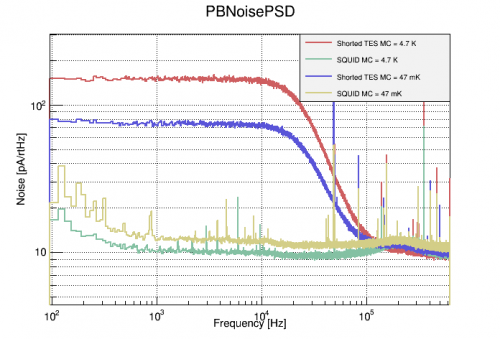 |
| Fig 2: Shorted TES loop noise psds |
|---|
| Tower | I_PJN (pA) | T_SQUID |
|---|---|---|
| 4.7 K | 138.3 | 4.72 K |
| 47 mK | 61.3 | 928 mK |
The temperatures thus obtained are consistent with our understanding of the fridge components in their various states. However, there is a contradiction, for if the SQUID card were truly <1.2 K, then the Al wirebonds should be superconducting, and R_B→0. This temperature calculation is strongly dependent on the noise level measured, to the extent that the subtraction of the SQUID noise brings T_SQUID down from 1.35 K to the 928 mK reported above. The uncertainty on these values must be better understood to put a realistic uncertainty on T_SQUID.
One-Shot
At the end of the run, we took a one-shot to cool the still and MC. We logged the Still temp and took data with a small test signal on the shorted SQUID channel to evaluate dIb/dIs. We also played with the Still heater to move through the Al superconducting temperature. The trending plots are shown in the figure below.
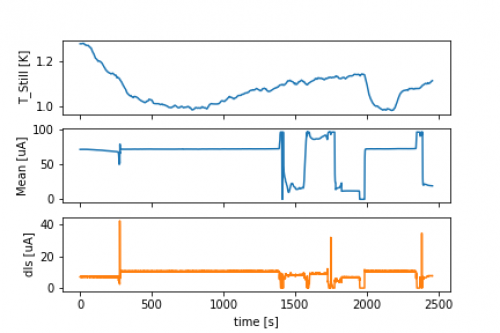 |
| Trending plots during a one-shot with Still heating |
|---|
The dIs was monitored for a fixed dIb. The figure below shows the peak-to-peak dIs values as a function of temperature. There are 2 clear regimes with a transition near the Al SC transition. The transition occurs when the Still thermometer reads ~1.125K. At lower temperatures, the wirebonds have gone SC and most of the current runs through the input coil, so dIs increases.
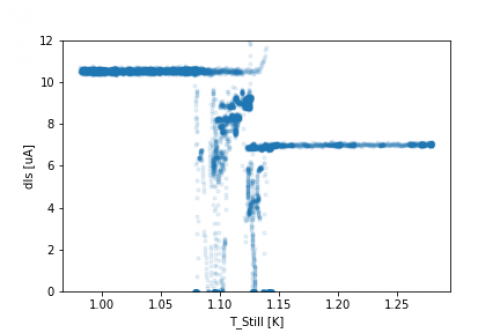 |
| dIs as a function of Still temp |
|---|
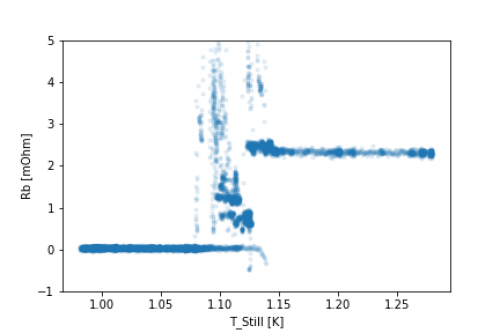
Using the expression above to relate Ib/Is (or dIb/dIs) to Rb, we can extract the wirebond resistance as a function of temperature. This is shown in the figure below.
 |
| Inferred wirebond resistance as a function of Still temp |
|---|
The mean inferred wirebond resistances are:
| T_Still | Rb (mOhm) |
|---|---|
| <1.05 K | 0.037 +/- 0.023 |
| >1.2 K | 2.315 +/- 0.045 |
These values assume the nominal Rsh resistances of 20 mOhm and 10 mOhm. As stated above, these may be different by as much as 50%There are also two meta-stable areas in the transition region which have resistances of around 0.75 mOhm and 1.23 mOhm. These may be the result of bonds going SC one at a time. Calculations of the expected signal when one or two bonds go SC are consistent with these observations, though it is not possible to tell with certainty the specific order in which they transition.
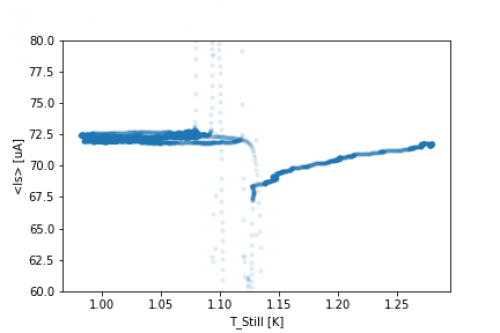
There were periods of SQUID instability near the transition as indicated by the mean Is values measured. It appeared like the SQUID would transition between phases or move through unstable parts of the v-phi curve at certain temperatures. This can be monitored by the average Is in each trace as a function of temperature. This is not yet understood. The SQUID behavior should be stable, even if wirebonds on the SQUID bias and feedback are changing resistance by ~mOhm.
 |
| Mean Is as a function of Still temp |
|---|