Table of Contents
Rate/Livetime
I. Event Rate
Rate calculations have been done preliminarily for a set of runs from background data, PuBe data, and Na22 data. The original idea was to create a series of histograms, extract the first non-random bin and the final bin and use those to calculate total collection time. That has proven to be too complex and to cause Root to SegFault randomly. Moving on, instead, each individual series was separated into a tree which was built into an array of trees. From there run time and rates were calculated.
This method seems to work fine but I seem to be having some issue with the cut that I believe arises from the background subtraction algorithm I used (based on Nicks previous baseline correction work). When the algorithm is not used a I chose a manual baseline point and “hit” threshold I get something close to a 24Hz rate. Using the algorithm I get a rate of 2-5Hz.
Below I have included some plots for each of the scenarios of bkg, PuBe, and Na22 using a hit cut threshold of 0.05E-6 to define a hit (this cut is placed so that it is just above the noise wall). From here I calculated what I believe to be the true event rate above this threshold.
| Fig. I.1 PuBe Randoms Event Rate |
|---|
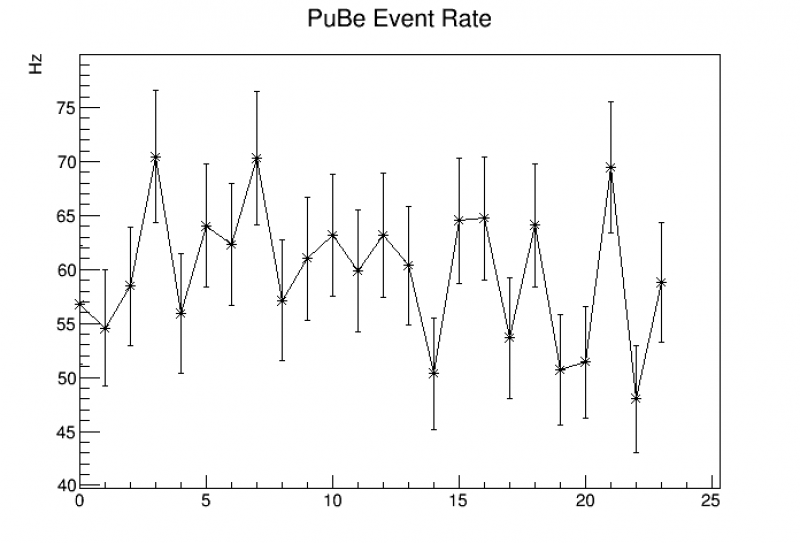 |
AVG Rate = 59.7 Hz.
| Fig. I.2 BKG Randoms Event Rate |
|---|
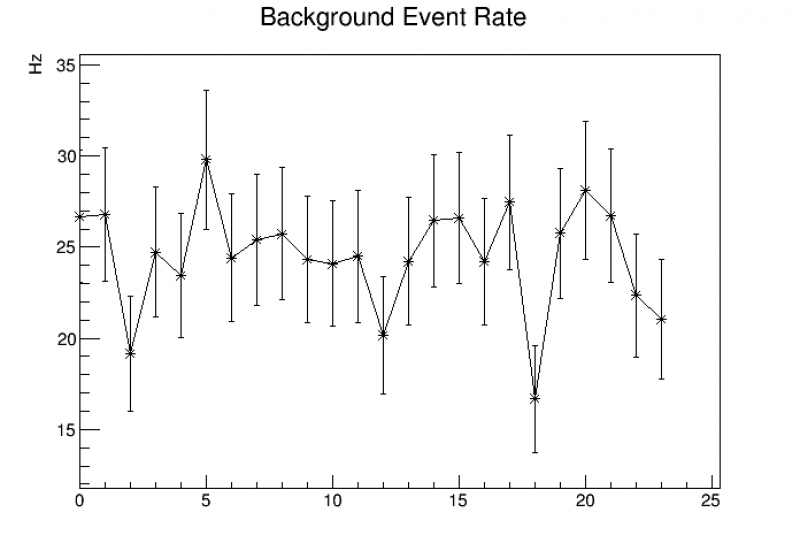 |
AVG Rate = 24.5 Hz.
Pube Rate = 59.7 - 24.5 = 35.2 Hz
| Fig. I.3 Na22 Randoms Event Rate |
|---|
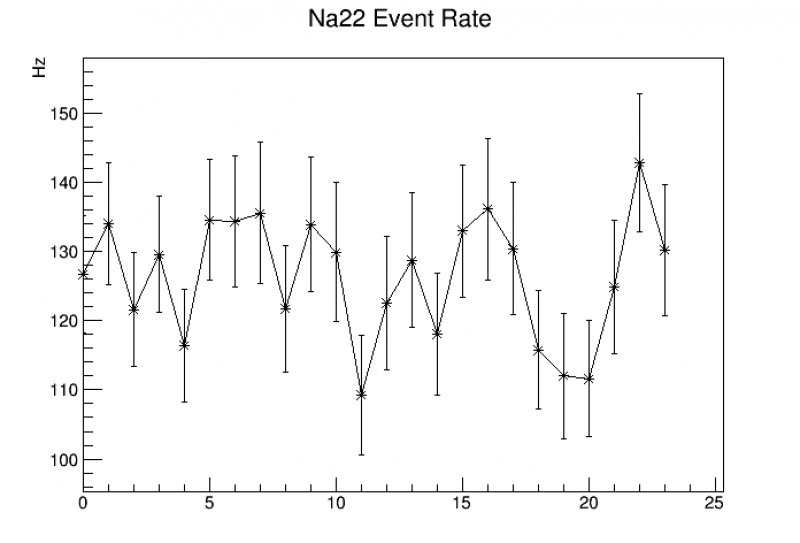 |
AVG Rate = 126.4 Hz
Note on Na-22 event rate(Matt): this rate is pretty high, so I checked the run diary to see if this agrees with what we observed at the time. I don't think we ever did a count of the rate in lab, but there's a note on September 13 when we started using the Na-22 source in its standard position (lowered to the bottom of the shield base at the NW corner inside the lead/poly shield) stating that we could run that way “without too much pileup”. As I recall we looked at a bunch of traces and judged that pileup was infrequent enough to be accessible.
With the above event rate, and given a “pileup window” of 3.2768 - 0.4 = 2.8768 μs (the trace length after the pulse start time), the rate of pileup in Na-22 data should be 30.5%
Note on PuBe event rate: After further analysis and expanding to sets of 64 series the new average rate seems to be 58.4 +/- 1 Hz
II. Low Energy Rate
A population of events with energy below 200eVee were found to occur occasionally in bursts of a few seconds. They were initially noticed because of especially high PC partitions and some observations were made on the Fiducialization page. While the source of these bursts remains unknown, they were able to be identified and removed based on the increased trigger rate during the few seconds the events were occurring. Fig. II.1 shows an example of the low energy trigger burst identification for a single series. The upper panel shows PTOFamps as a function of event time for events less than 500 eVee. There are several vertical streaks of trigger bursts. The lower panel shows the rate of events between 50-200 eVee for each 1s time window. All times are based on the “EventTime” rq, which has a 1s resolution based on the DAQ CPU clock time. In the lower panel, this event rate is clearly elevated from the norm during trigger burst periods.
| Fig. II.1 Low energy trigger bursts |
|---|
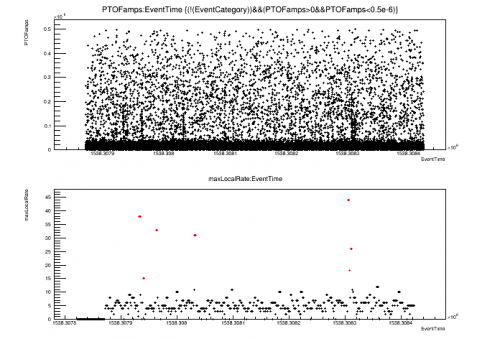 |
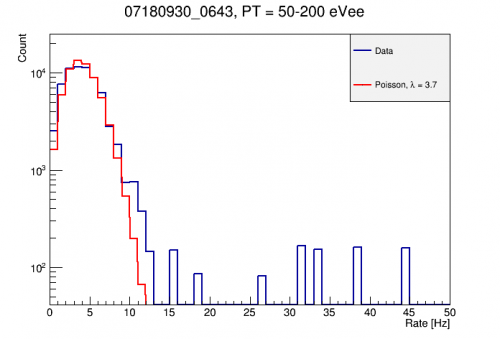
Figure II.2 below shows the distribution of low energy trigger rates for a single PuBe series. Although the main distribution is not quite Poisson, there are several clear outliers which can be easily removed. To easily access these trigger rates and use them in cuts, it is desired to create “rateTree” objects for each series which can be friended to the rq tree at analysis time. A piece of code to build these trees has been written and is located at:
/home/mast/cdms/run068/rateTree/buildRateTree
| Fig. II.2 Low energy trigger rate distribution, single PuBe series |
|---|
 |
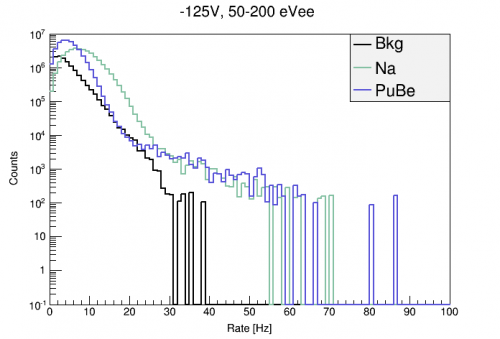
After creating Rate trees for all r68_n125 data, we can look at the distribution of low energy trigger rates for the 3 data types. These are shown in Fig. II.3 below. These distributions are of the rateTrigPTOF_50nA200nA quantity using only a randoms cut and weighted by 1/rate. That makes these histograms of the number of triggered events saved in data in each second (as measured by EventTime). If the DAQ is able to keep up with the DCRCs (unclear if/when this is true), these would be the the low energy trigger rate distributions.
| Fig. II.3 Low energy trigger rate distributions |
|---|
 |
The following e-notes show the development of a cut to remove bursts of low energy events. [Note 52] [Note 55]
III. Read Efficiency
To follow up, I am now moving to calculate the rates and read efficiency of triggered data. To do this, I first need to find the cut efficiencies of the two cuts that I am using on the triggered data, the background cut and a Standard Deviation cut. This should help eliminate events with weird backgrounds and tails as well as events which double trigger without eliminating pile up events (we still want to include those in the total efficiency). I found the following cut efficiencies from randoms data:
| Table III.1 Cut Efficiencies | |||
|---|---|---|---|
| Cut Type | Background | PuBe | Na22 |
| Baseline Cut (%) | 88.6 +/- 0.21 | 82.3 +/- .25 | 69.2 +/- 0.30 |
| Stddev (%) | 99.2 | 98.2 | 97.8 |
Using these cut efficiencies I calculate a read rate, “hit” rate and finally the read efficiency for the three data type. To do this, I first need to define what it means to be hit in the triggered portion of the data, this will be a threshold set in PFWKmax. After looking through some PuBe data I chose TCut chitt = “PFWKmax>0.2e-6” to be my threshold as this was above the noise wall by a few standard deviations and didn't seem to remove to much of PFWKmax as a whole.
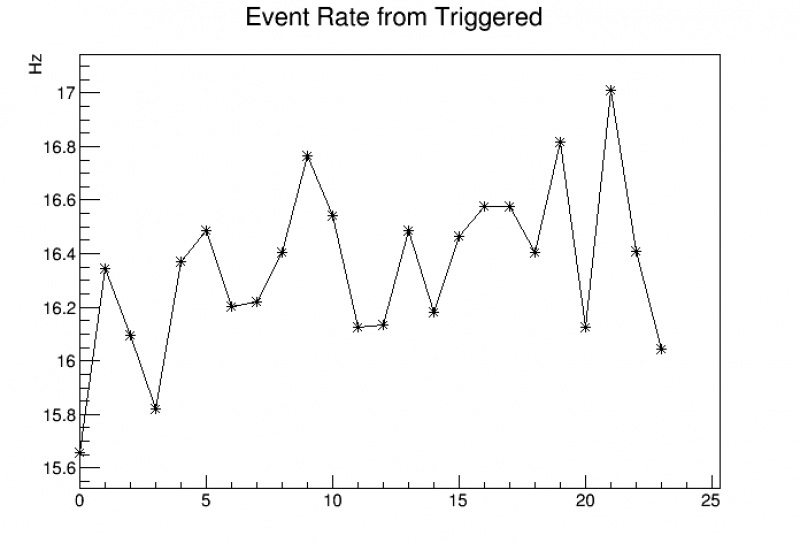
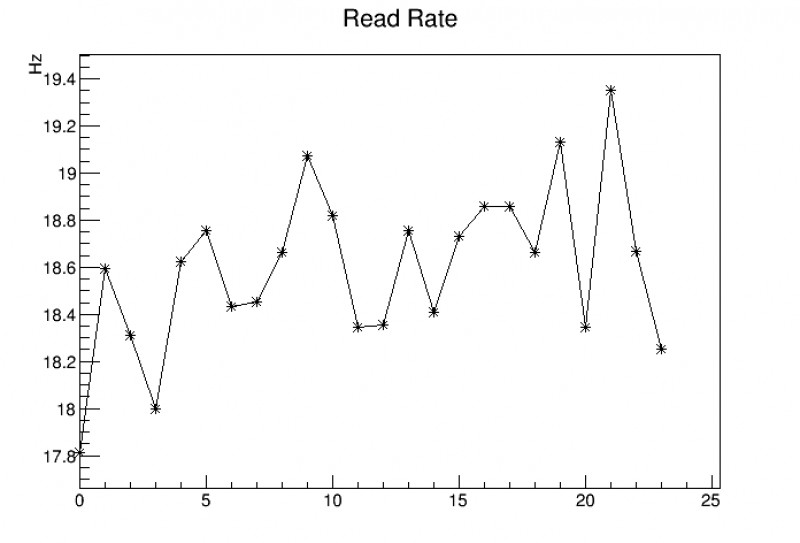
Once this cut is set, the event rate can be calculated by simply totalling the amount of hits above this threshold and dividing by a the time elapsed (either a single series if done in a series by series basis, or a set of series). Once a trigger rate is found, the read rate is calculated by dividing off the cut efficiencies to give a more true rate read by the DAQ. The trigger efficiency is then calculated from the read rate by dividing off the the “true rate” of events from randoms.
| Fig. III.1 BKG Triggered Event Rate |
|---|
 |
| Fig. III.2 BKG Read Rate |
 |
| Fig. III.3 BKG Read Efficiency |
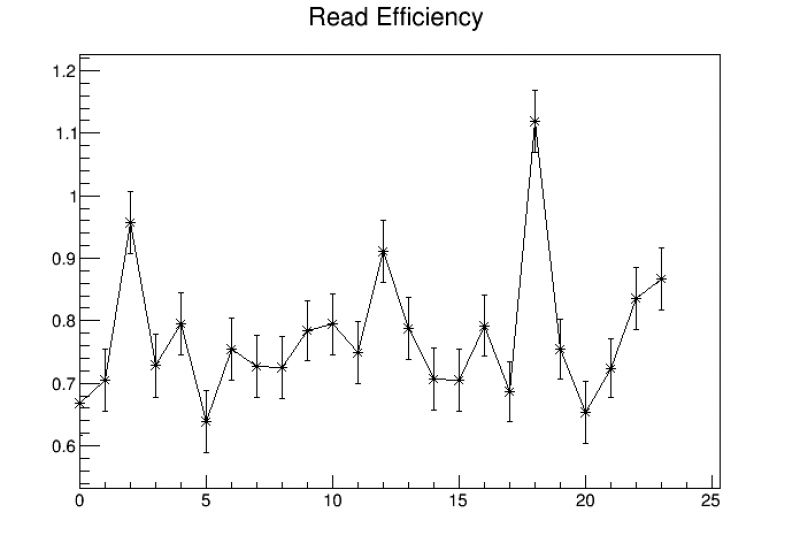 |
Trigger Rate is 122 Hz.
Analysis of PuBe
Note This is all of the PuBe data analysed at once, it has been pointed out that the last sequence of data taken had some in run randoms included in the data taking process, this will change the possible trigger and event rate based on how I calculated them I am looking to change the algorithm to include the use of possible in-run randoms and to recalculate the trigger rates for the four individual chunks of PuBe data and the rate for the whole which I will append to the end of this note.
In order to calculate the PuBe read efficiency I used the above method and assuming that the total run time and the cut efficiencies remain mostly constant. The things that seemed the most readily fluctuating would be the overall rate from randoms and the rate from triggered data. After looking at block of 64 series (10% of the total series) I noticed the rate from randoms is mostly consistent throughout with an average of 58.4 Hz. The rate from triggered data was mostly constant near 35 Hz, with the exception of the first 64 and the final 64 sets which appeared to have an overall lower rate closer to 28 Hz. Interestingly, these also appeared to have slightly shorter average run times. In any case, I omitted the first and last 64 obtaining an average read rate (including the cut efficiencies of 43.7 Hz and consequently a read efficiency of 74.8%
With this estimate of read efficiency and a total run time of 97.9 Hrs, we can obtain a total livetime by first including the cut efficiencies. Doing so gives a run time with cut efficiencies of ~70 hours. Implementing the above read efficiency gives us a total livetime of 59.2 Hrs.
Calculating total triggered event rate
| Fig. III.4 PuBe Total Triggered Event Rate |
|---|
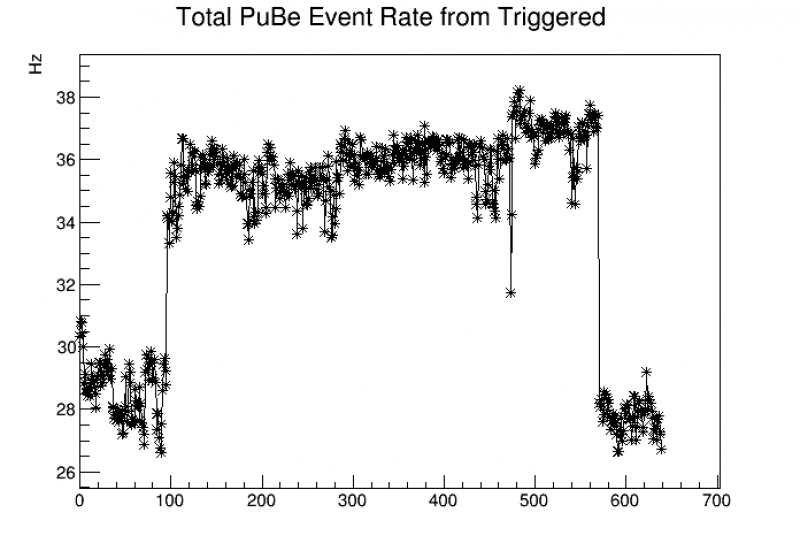 |
My next estimation is to calculate the total triggered event rate, i.e. counting the total number of hits in the entire run and dividing by the total run time cited above. Doing this you obtain an unmodified rate of 33.9 Hz. Modifying this by the above cut efficiencies gives a read rate of 42 Hz and the finally a read efficiency of 71.9. Using this data, and the above calculation you get an overall live time of 50.33 hours, much different than my above estimate.
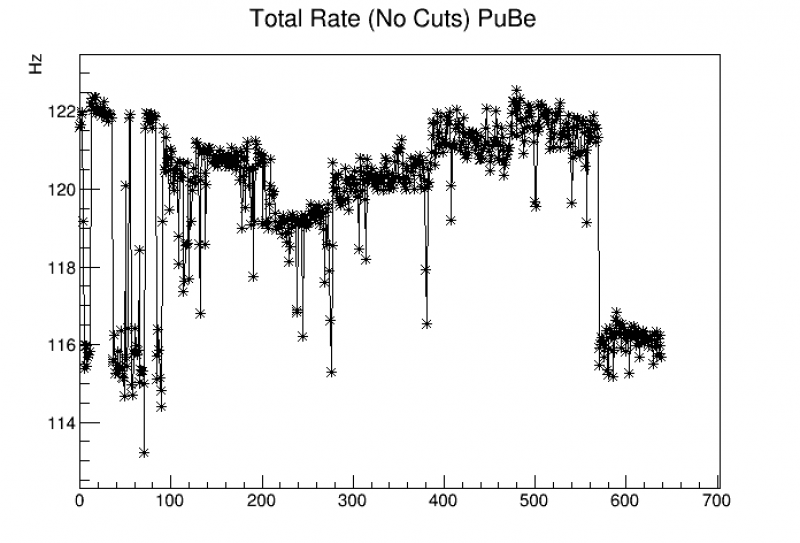
In order to get a better idea with how the total efficiency would change per series, we decided to calculate to the total PuBe rate per series with no cuts applied except for no randoms. This leads to the following figure:
| Fig. III.5 PuBe Total Triggered Event Rate (No Cuts) |
|---|
 |
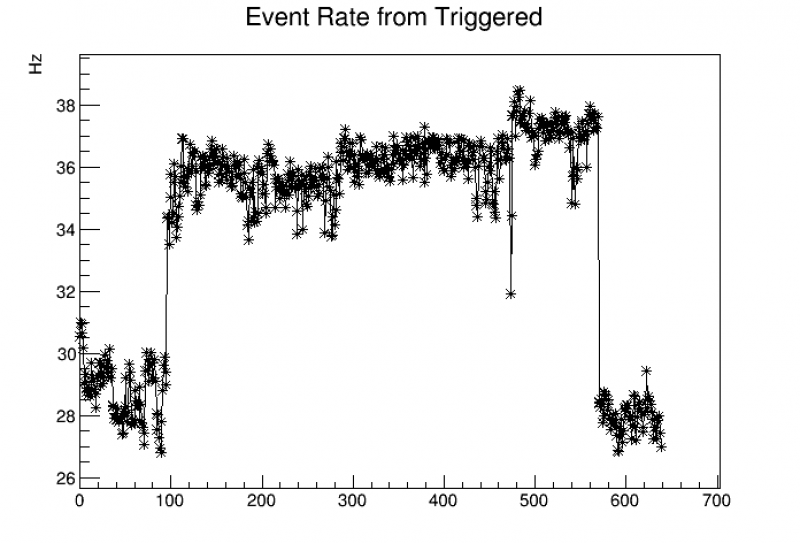
Update 3/31 Following the above two figures, there was a wonder about the consistency of the plots when switching to a different hit cut, so I calculated the same figures from above using TCut chitt = “PTWKmax>0.5e-6”. The resulting figures are as follows:
| Fig. III.6A PuBe Total Triggered Event Rate (PT) | Fig. III.6B PuBe Total Triggered Event Rate (Copied for III.4) | |
|---|---|---|
 | |
|
There is very little difference between the two figures, so it appears that the overall rate above threshold is consistent through different channels.
IV. Rate Recalculation and Updates (as of 190912)
This section is a recalculation of the above rates for the 4 different PuBe data sets named PuBe1, Pube2, PuBe3, and PuBe4 as well as the total rate for all PuBe data combined. I will summarize the data used to complete the entire process of calculating the efficiency of the total data set as well as the subsets marked by Matt's cuts on low, mid, and high series sets. The steps used are as follows:
- Use randoms to calculate “True Hit Rate”
- Calculate rate of hits in triggered data
- Use above cut efficiencies to find read rate as hit rate/cut efficiencies
- Calculate read efficiency as read rate/true event rate
I will first begin by recalculating overall read efficiency of the total data set. I begin with the true hit rate from randoms which is plotted below.
| Figure IV.1 PuBe True Hit Rate from Randoms, All 125V Data |
|---|
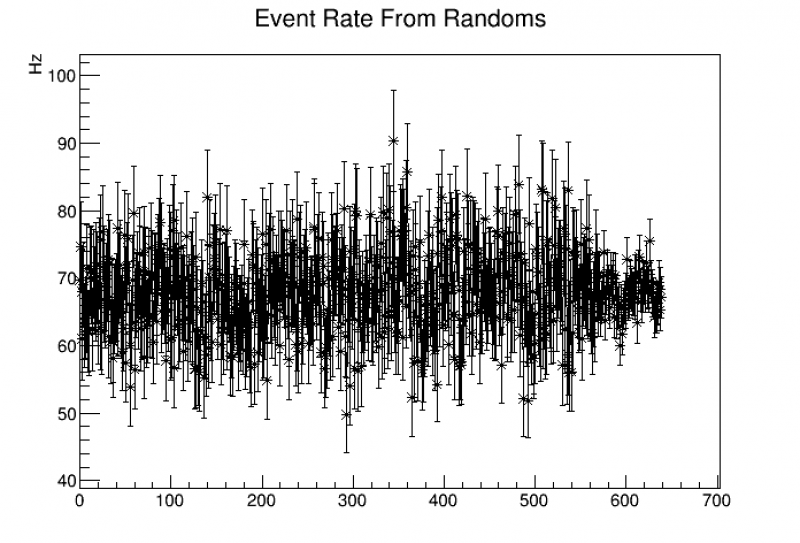 |
Average True Rate: 67.8 Hz
| Figure IV.2 PuBe Event Rate from Triggered, All 125V Data |
|---|
| |
Average Event Rate: 33.6 Hz if you ignore the beginning and end sections you obtain 34.7 Hz
| Figure IV.3 PuBe Read Efficiency, All 125V Data |
|---|
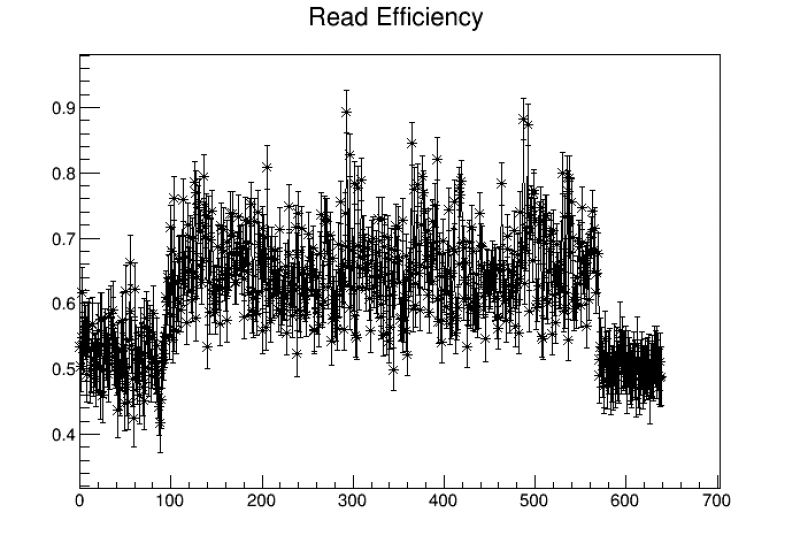 |
Average Read Efficiency = 61.7 +/- 0.4% if you ignore the beginning and end section it is 68.4%
From here we have a total data time of 3.523e5 seconds or 5871.8 minutes or 97.9 hours. Using the Average read efficiency over all PuBe data sets we obtain a livetime of 2.174e5 seconds or 3622.9 seconds or 60.4 hours. This comes to a livetime of 2.52 days.
On The Low Rate Sections
There are two low rate sections corresponding to nearly all of PuBe Series set 1 (1-108) and the end of PuBe Series set 4 (560-640). At this point it is still unclear what is causing the low rate at the start of the PuBe data set, but PuBe 4 corresponds to a period of time where in run randoms were left on. This should decrease the trigger efficiency on real events causing an overall decrease in read rate from missing more triggered pulses.
Background Livetime
| Figure IV.4 BKG True Hit Rate from Randoms, All 125V Data |
|---|
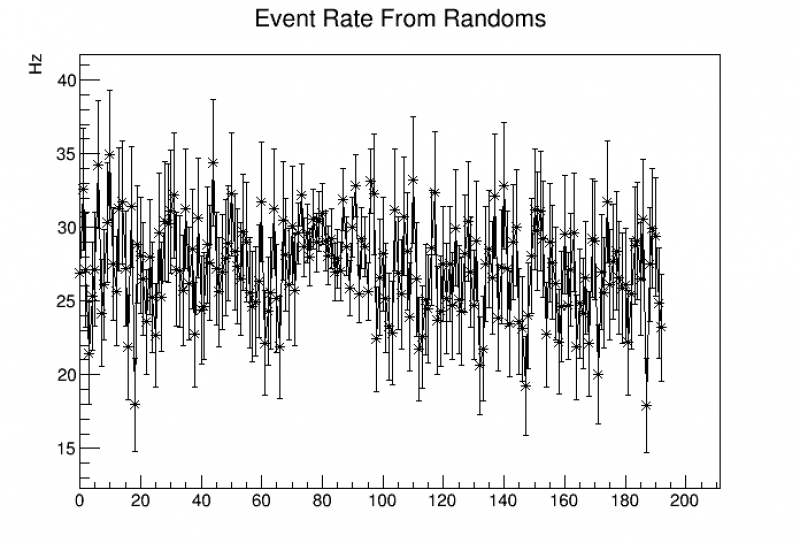 |
Average True Rate: 27.2 Hz
| Figure IV.5 BKG Event Rate from Triggered, All 125V Data |
|---|
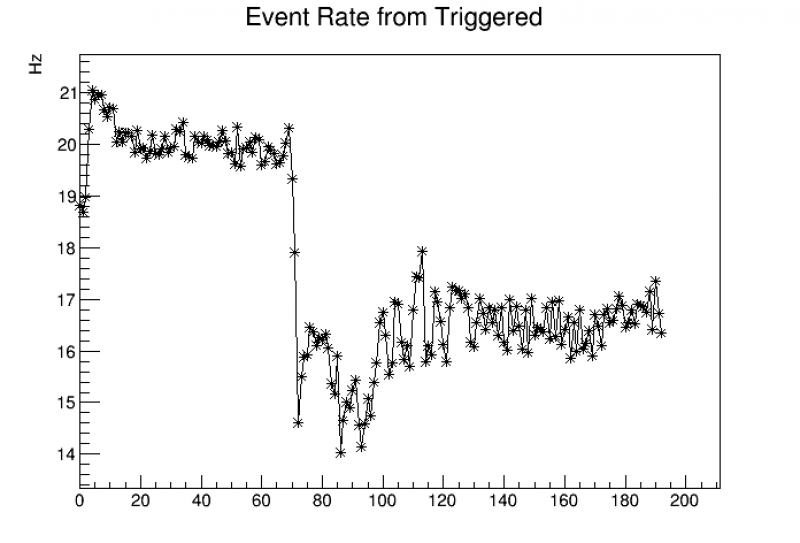 |
Average Event Rate: 17.7 Hz There are two different sections with average rates of 19.7 Hz and 16.3 Hz
| Figure IV.6 BKG Read Efficiency, All 125V Data |
|---|
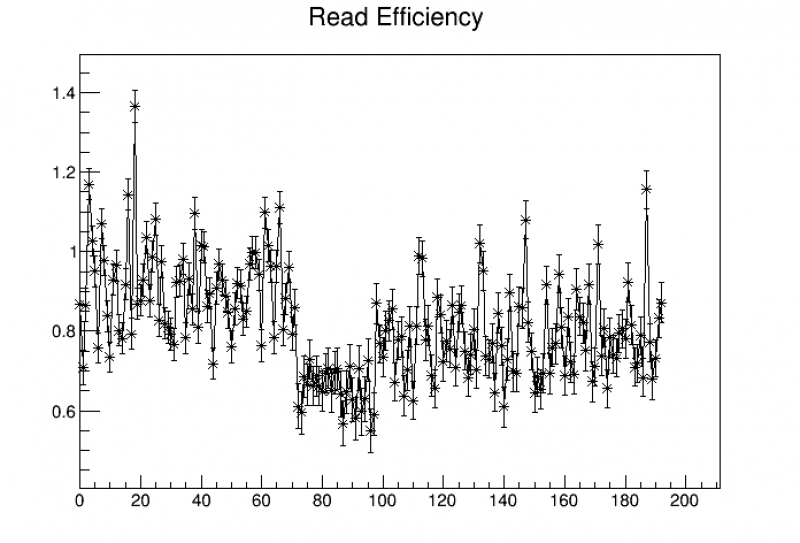 |
Average Read Efficiency = 81.5%
Using a calculated run time of 1.063e5 seconds or 29.5 hours the read efficiency gives a lifetime of 8.661e4 seconds or 24.1 hours which corresponds to basically a day of background data.