Table of Contents
Initial -125V Analysis Efforts
This documents some of the initial analysis efforts and cut development for the R68 -125V data sets. The final analysis on reprocessed data is documented on this page.
First Look
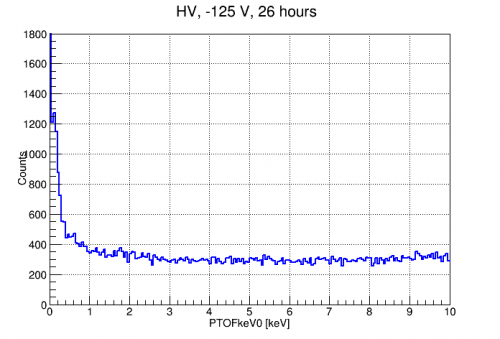
It was found late in the run that the optimal SNR was achieved around -125V. The spectrum was mostly flat below 10keV as shown on the left. On the right is the HV spectrum below 1 keV. The signal hump appears in the expected place and the noise width is 7.9eVee.
 | 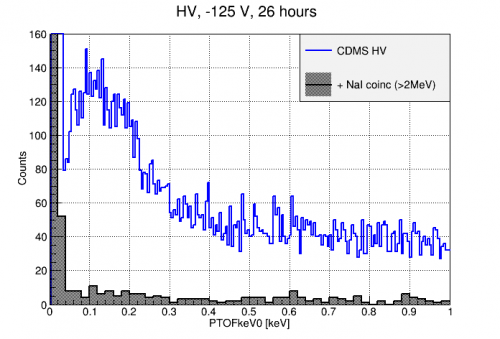 |
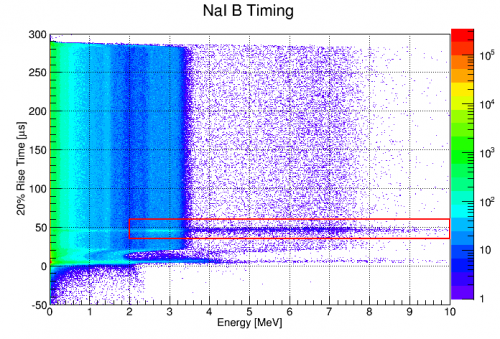
A spectrum is also shown which includes a cut for coincident NaI events with energy >2MeV. This selection region can be seen below in a plot of NaI 20% rise time versus calibrated energy.
 |
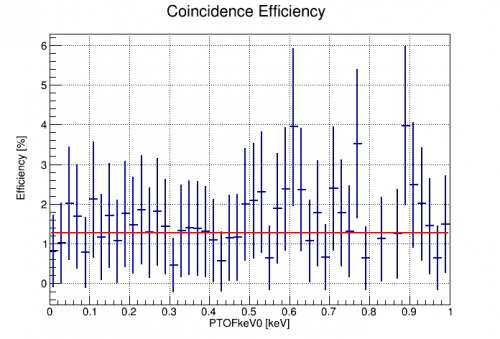
The ratio of the HV spectrum with and without the NaI coincidence cut gives the efficiency of that cut (given all the other applied quality cuts). This is found to be relatively flat in energy with an average of 1.28%. The flatness of this efficiency indicates these events in our signal hump are not more likely to have a coincident trigger than other events nearby in energy.
 |
Further Analysis
An analysis of all available -125V PuBe and background data was performed. The following datasets were included:
- n125_bkg_1
- n125_PuBe_1
- n125_PuBe_2
- n125_PuBe_3
- n125_PuBe_4
A series of standard cuts were performed on both the PuBe and background data to remove bad events. They are each described below.
OF/INT consistency cut
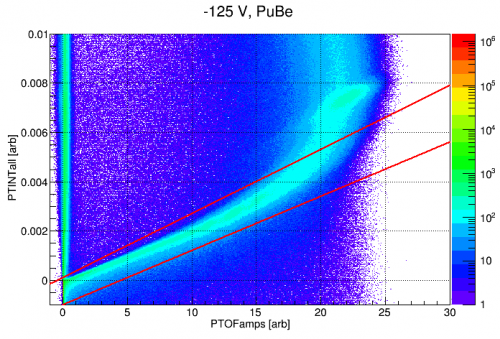
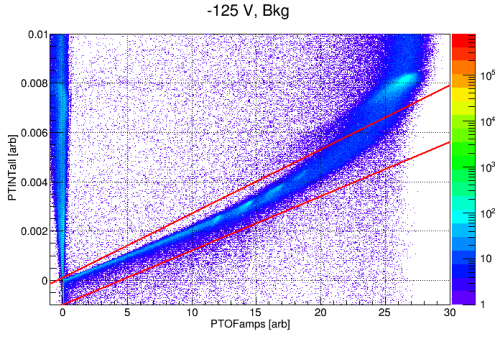
A loose linear cut was made on the ratio of OFamps to OFINTall. This removes pileup and some mis-triggered events as well as some which are poorly fit by OF due to excessive noise or baseline slopes. This also cuts off high energy events which exhibit significant saturation and OF-Integral non-linearity. Events outside of the lines are removed.
TCut cofint = "PTINTall<260+1e-4*PTOFamps&&PTINTall>(220*PTOFamps-1e-3)"
 |  |
OF0/OF consistency cut
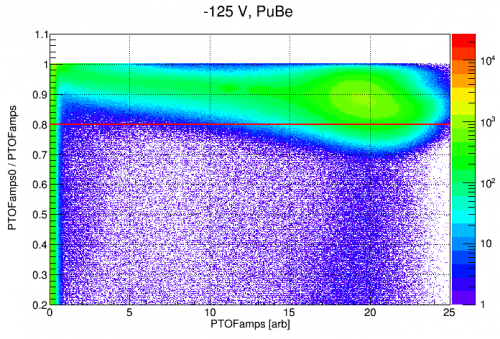
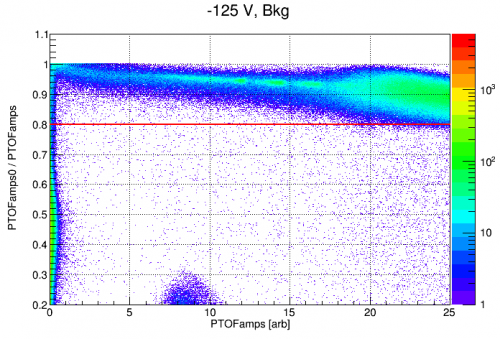
A cut was also made to ensure the consistency of PTOFamps and PTOFamps0. This will remove events for which the delay and associated amplitude found with OFamps differs significantly from the fixed delay quantity OFamps0. This can occur for very high events where the pulse shape is saturated and the template is too narrow, or for low energy triggers on noise fluctuations. All events below the line are removed.
TCut cofconsist="PTOFamps0/PTOFamps > 0.8"
 |  |
Tail cut
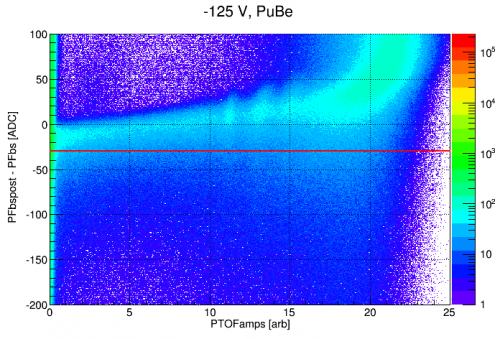
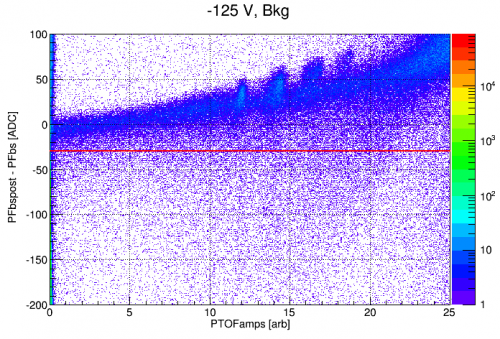
Events which fall on the tails of muons or larger events will have reduced amplification because the TESs are not in the same place in transition. A cut on the baseline slope of the center channel is made to remove such events. Events below the line are removed
TCut ctail = "PFbspost-PFbs<-30"
 |  |
PT chi-squared cut
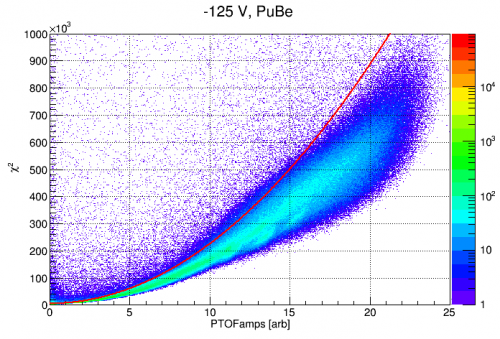
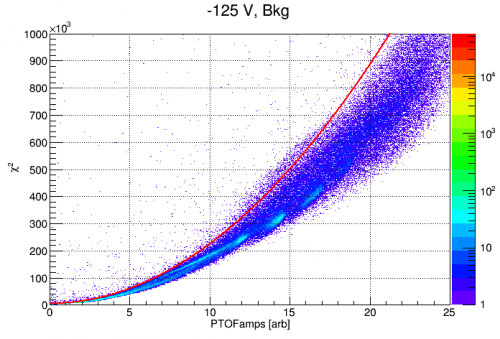
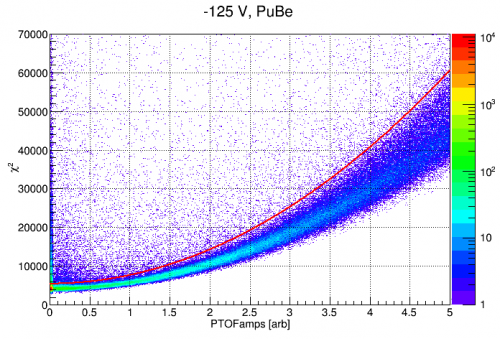
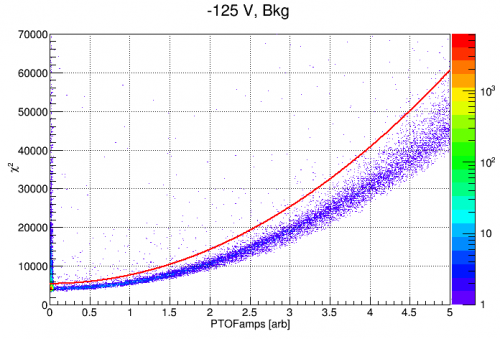
A cut was also made to remove events with poor PTOF fit by cutting on the <m>\chi^2</m> quantity. Events above the line are removed. The top row of plots shows the cut out to ~30keV, the lower row shows the cut in the range of ~few keV |
TCut cchit = "PTOFchisq<5.5e3+2.2e15*PTOFamps**2"
 |  |
 |  |
PF selection
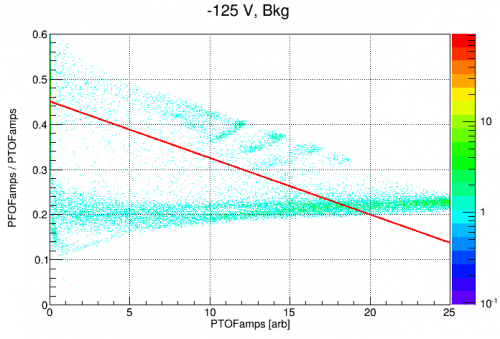
Events centrally located in the detector were sometimes selected using a PF partition cut. This was especially useful for calibrating to the 241Am lines which were centrally located. Events above the line were considered “in” channel F.
TCut cF = "PFOFamps/PTOFamps>0.45-PTOFamps*(0.45-0.2)/(20e-6)"
 |  |
Calibration and Energy Spectra
The above cuts were used to select good events in channel F. Then, the energy spectrum was calibrated using the 14 and 18 keV 241Am peaks and 0. This was done for 4 different energy quantities: PTOFamps, PTOFamps0, PsumOFamps, and PsumOFamps0. PsumOF(0) amps is a weighted sum of the individual channels OFamps(0) quantities. The weighting is based on a coarse balancing of the lower band in P*OF/PTOF partition vs. event energy plots. The position of those bands for channels A-F were (0.07, 0.08, 0.17, 0.09, 0.12, 0.19). The inverse of these values were then used as the channel weights to define PsumOFamps(0).
The spectra were scaled to event rates using a naive measure of 9 min 10 sec livetime per series. Each series is 10 min long, with 50 sec of randoms at the beginning. As can be inferred from relative 241Am rates in the plots below, this is likely incorrect.
| 0-1 keV | 0-10 keV | 0-20keV | |
|---|---|---|---|
| PTOFamps | 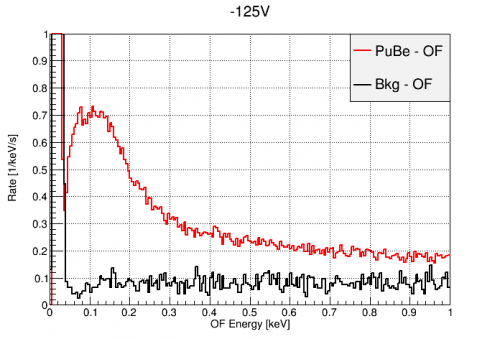 | 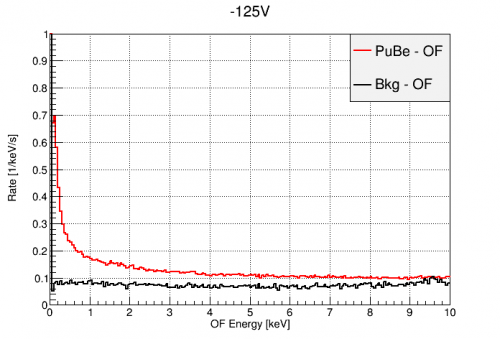 | 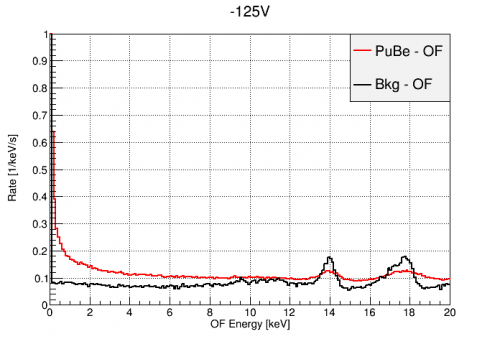 |
| PTOFamps0 | 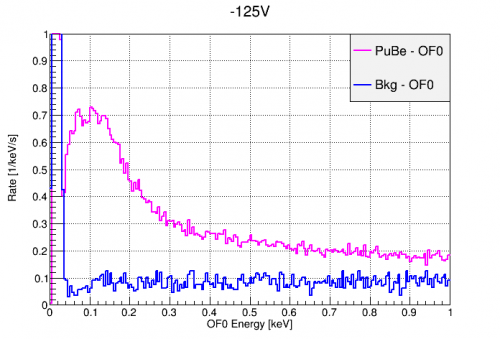 | 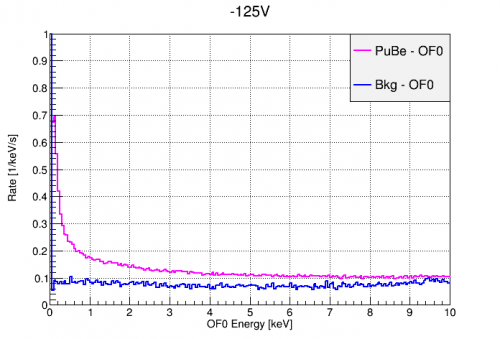 | 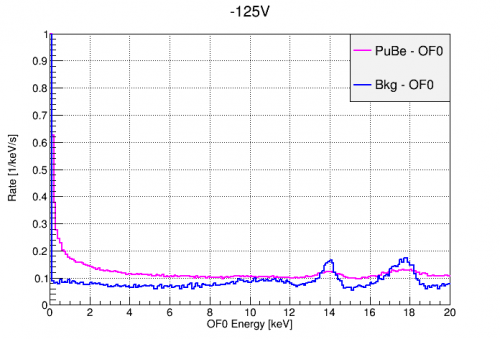 |
| PsumOFamps |  | 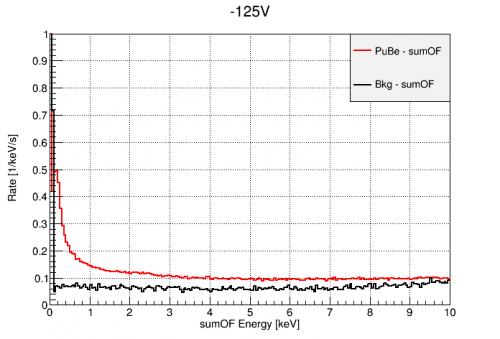 | 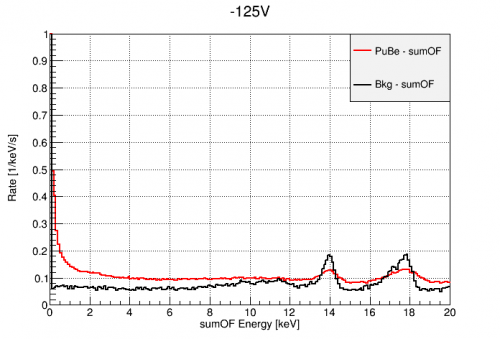 |
| PsumOFamps0 |  | 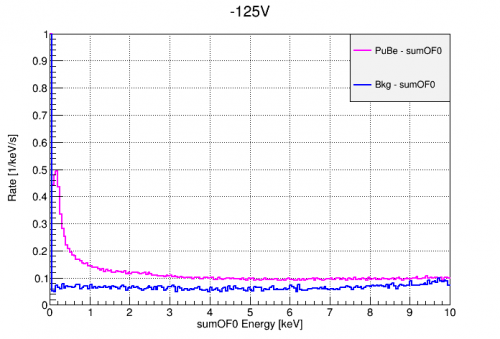 | 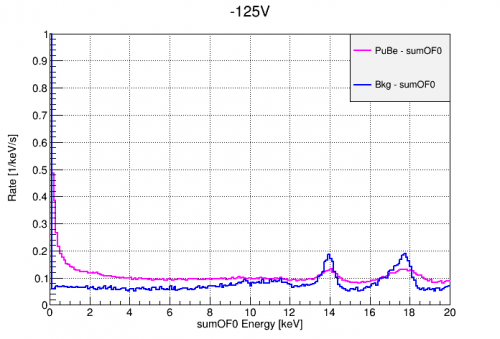 |
Rough Yield
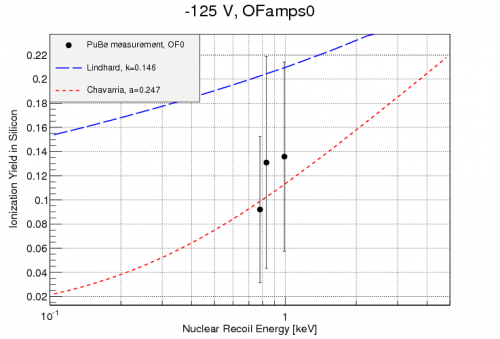
In the energy ROI, the background spectra appear quite flat until the trigger threshold starts to reduce them at around 100eVee. The neutron capture signal peak is clear in all of the above plots. There may even be some substructure visible in the OF0 spectrum. Assuming these are the three highest capture lines, we can make a rough estimate of the nuclear recoil yield for each peak. This is has been done in the plot below.
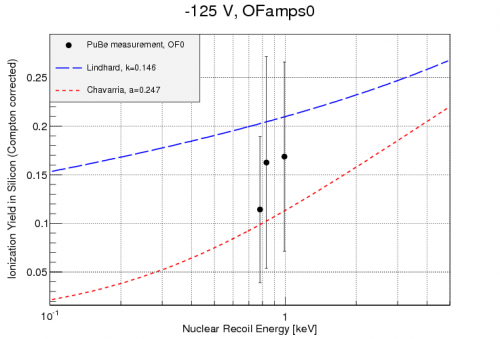
There is significant fitting error, but the measurements are in agreement with the parameterization of the measurements of Chavarria (see CDMSII NR paper). These calibrations are based on the 241Am 12,18 keV lines. Based on the position of the 22Na Compton step in PTOF0, the PTOFkeV0 energy scale could be low by as ~25% in this region. Correcting the energy scale by the ratio of the measured step to the accepted value gives the plot on the right below.
 |  |
Fiducial Volume
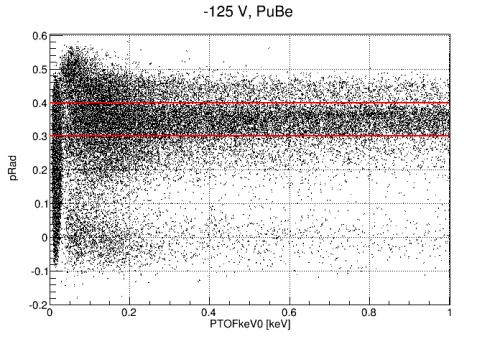
Events at high radius can have reduced NTL gain due to field fringing. A radial quantity was constructed from the individual channel OF amplitudes, each corrected by the same factor used to build Psum as described above.
double partBandOF[]={0.07, 0.08, 0.17, 0.09, 0.12, 0.19}
z->SetAlias("pRad",Form("(1*(PAOFamps/%e+PBOFamps/%e)+0.5/3*(PCOFamps/%e+PDOFamps/%e+PEOFamps/%e)-1*PFOFamps/%e)/PsumOFamps",partBandOF[0], partBandOF[1], partBandOF[2], partBandOF[3], partBandOF[4], partBandOF[5]))
The distributions of this radial quantity pRad with energy are shown below. The two lines are believed to separate events in the outer rings (A,B), the inner segments (C,D,E), and the inner channel (F).
 | 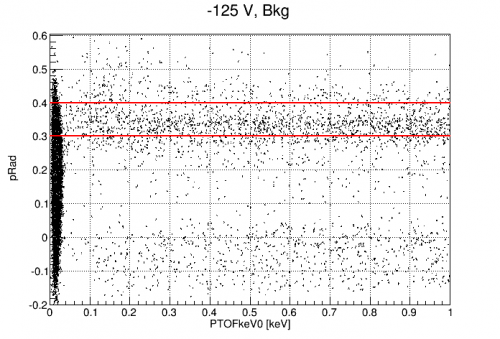 |
Several cuts were used to try and remove high radius. Each was used applied to create an energy spectrum using PTOFkeV0. The hard cut on cF events changes the signal spectrum somewhat, leaving preferentially lower energy events. The radial partition cuts preserve much of the full spectrum, including some of the possible substructure.
| Cut | Spectrum |
|---|---|
| cF (defined in pF selection above) | 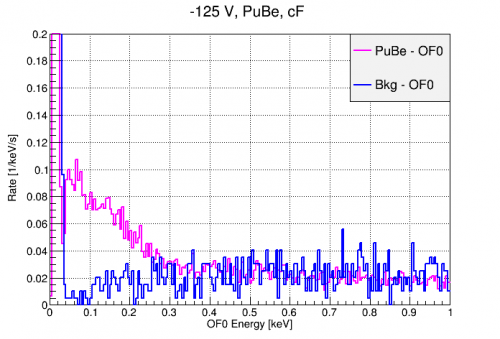 |
| pRad<0.4 | 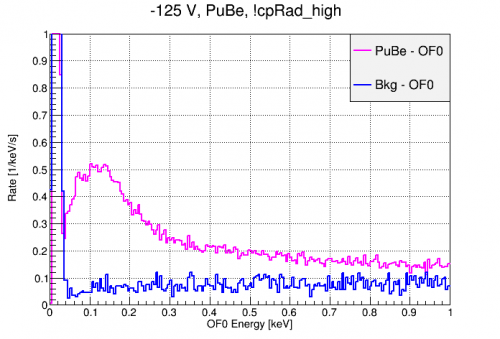 |
| pRad<0.3 | 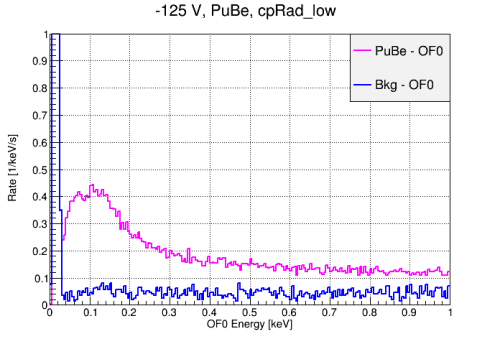 |
Understanding the OF0/OF cut
The least understood cut used above is the ofconsist cut, which requires OFamps and OFamps0 to agree within 20%. This means that OF and OF0 are finding different pulse amplitudes. The OF0/OF ratio did not appear correlated with baseline or baseline slope. There was a small population of events with very high, flat baselines which reconstructed to 0-0.5keV these are likely parts of long muon tails and were easily removed from consideration. There were also a population of events with large pulses long (>500us) after the trigger time. These yielded discrepancies in OF and OF0. But were also usually removed with the other standard cuts such at the OF/INT cut.
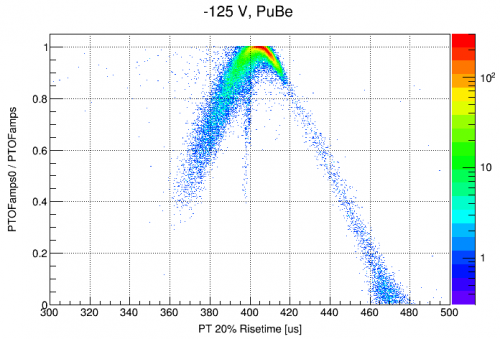
A correlation between OF0/OF and pulse start time was found in the energy ROI. The first plot below shows that the OF0/OF discrepancy grows as pulse start time moves away from trigger time (400us). This is not surprising, as OF0 will give a reduced amplitude if the pulse peak is not aligned with the template peak.
 |
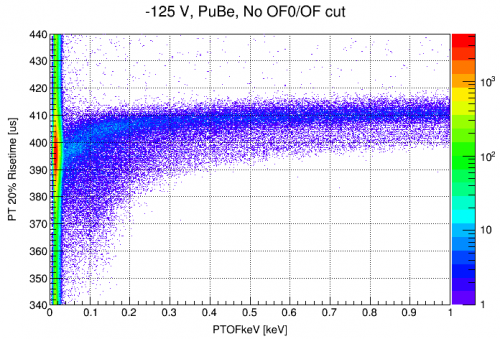
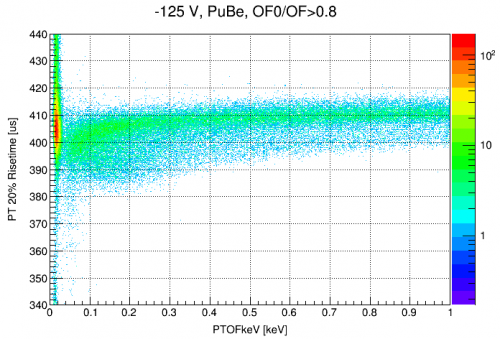
Unfortunately, pulse trigger time is also correlated with amplitude near trigger threshold. The figure below on the left shows that low-energy pulses have 20% risetimes earlier relative to trigger time because the threshold trigger is tripped later in the pulse shape. The plot on the left includes all quality cuts except the OF0/OF consistency cut. The plot on the right shows the result of applying the OF0/OF consistency cut. It seems that this cut is biased to remove near-trigger-threshold events.
 |  |
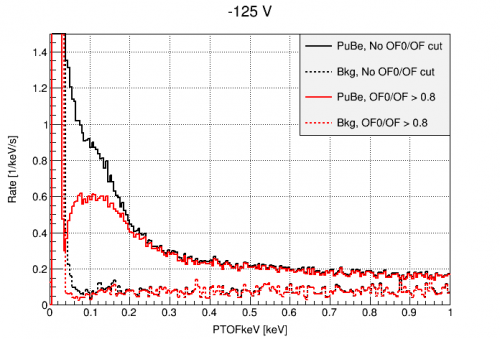
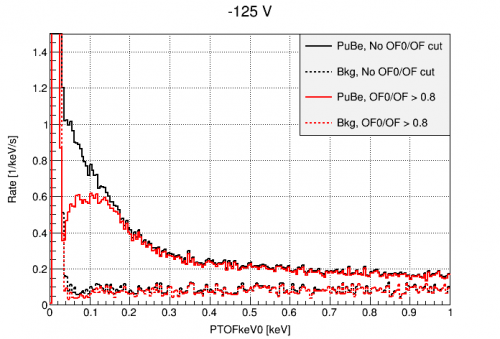
The result of this cut on the energy spectra, given the other quality cuts, is shown below. The left figure is OFkeV, and the right is OFkeV0. This cut strongly suppresses events near trigger threshold, right in our energy ROI. Without the OF0/Of cut, the possible peak structures are still visible, but they sit atop a quasi exponential background (probably low energy nuclear recoils).
 |  |
Cut Development on 22Na Data
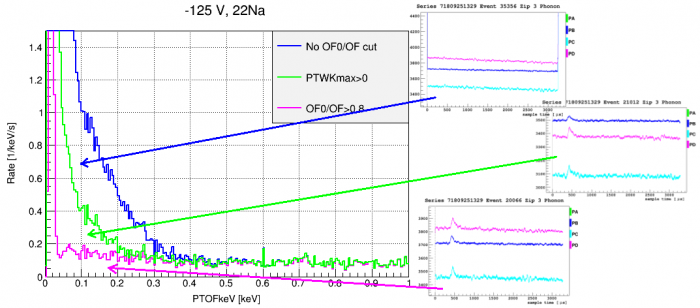
Another worrisome finding was that the -125V, 22Na data seems to have a noise component similar to the neutron capture “signal”. As seen below, the 22Na data has a spectrum which looks much like the PuBe “signal” near threshold. However, the OF0/OF cut almost completely eliminates them. Some of these events contain no pulse, but reconstruct to a small energy due to a sloped baseline. They also have a large pulse in the last few bins, which thwarts the current baseline slope cut. They are eliminated here with the requirement that PTWKmax>0. However, there is still a population of seemingly “good” events which fail the OF0/OF cut in this data.
 |
This motivated the need to use the -125V 22Na data to develop quality cuts which can then be applied to the PuBe data. It may be that the higher rate of events in the PuBe and 22Na data present some different classes of events from the Bkg data.
Randoms and Tail Cut
The first cuts applied to the 22Na data were the randoms cut and tail slope cut. These seemed robust and non-controversial.
TCut crand = "EventCategory"
TCut ctail = "PFbspost-PFbs<-30"
Muon tail cut
Next, a cut was made to remove some muon tail events. These are part of the long, flat tail of a muon pulse and are relatively flat, but at a very high amplitude. This is a relatively loose cut on such events.
TCut cBShi="PFbs>9e3"
OF/INT cut
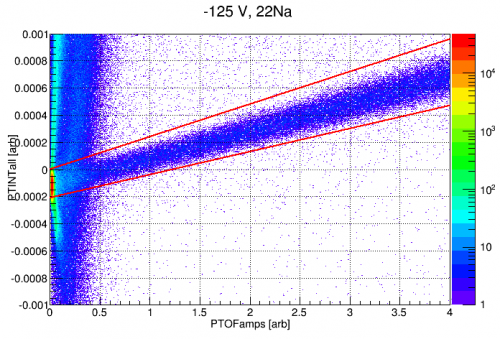
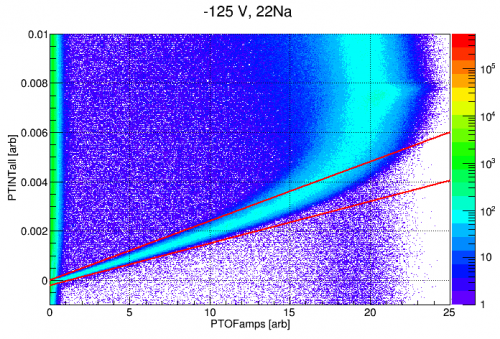
An OF/INT consistency cut is then applied. This is similar to the OF/INT consistency cut discussed above, but it is made stricter at low energies. This primarily removes pile-up events.
TCut cofint = "PTINTall<260*PTOFamps&&PTINTall>(190*PTOFamps-2.1e-4)"
 |  |
WKmax/OF cut
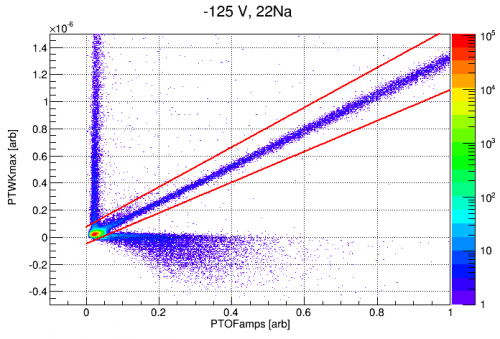
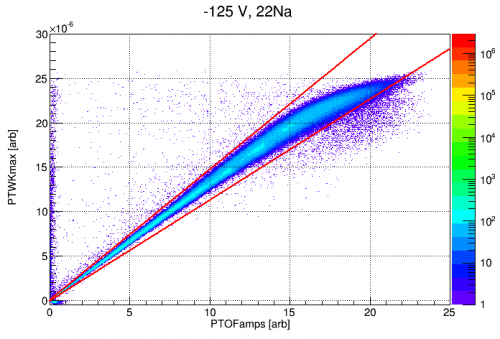
Next, this cut was added to remove events which have a discrepancy between OF and WKmax. This catches sloped baseline events which evaded the tail cut due to a late pulse as described at the start of this section. It also removes events with large pulses outside the OF search window. This can occur if there is pileup or a noise trigger some time before a pulse. In the later case, the next event is usually triggered on the pulse, so the true event is retained.
TCut cofmax = "PTWKmax<7.8e-8+22./15*PTOFamps&&PTWKmax>-5e-8+17./15*PTOFamps&&PTWKmax"
 |  |
Chisq
Again, similar to the chisq cut used in the PuBe data above.
TCut cchit = "PTOFchisq<5.5e3+2.2e15*PTOFamps**2"
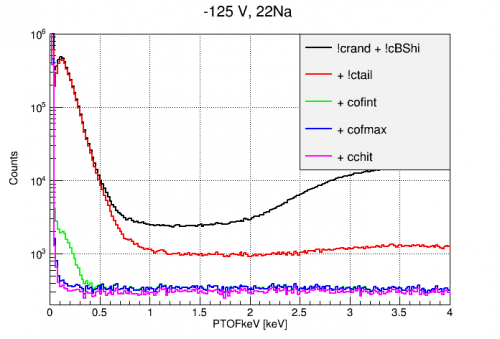
The effect of each cut on the calibrated 22Na spectrum can be seen below. The OF/INT consistency has the largest effect by far.
 |  |
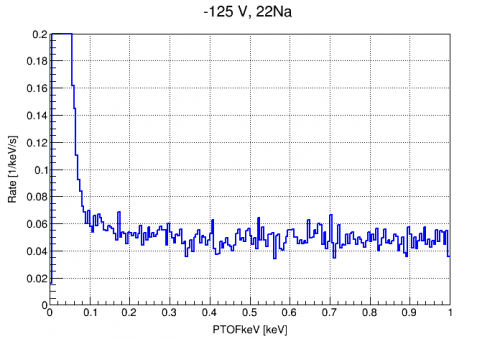
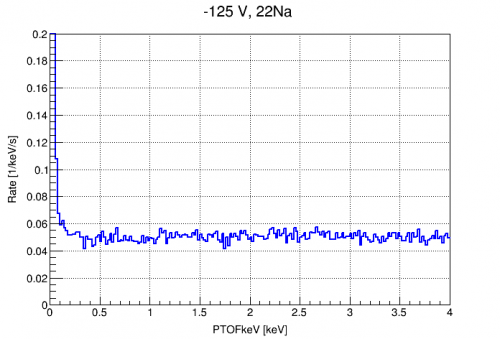
The final spectrum is shown below with a naive livetime scaling. The Compton step (1.839 keV) is not clearly resolved here.
 |  |