Zero volt Si background data pulse analysis: Searching for the Americium
These may in fact be the peaks, try to adjust down the 50 volt data using both Luke gain and resolution.
Original 50V work can be found Here
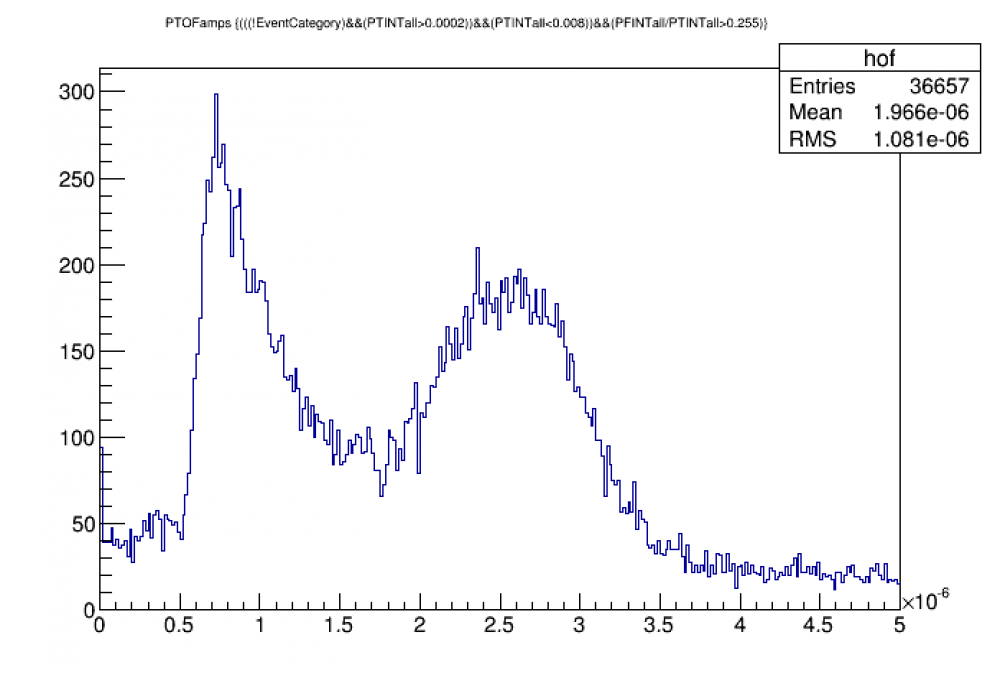
I tried calculating the effects of the Luke Gain on the 60keV peak using the standard luke gain equation for an electron recoil with recoil energy 60keV, eV/pair production of 3.8 (for Si), and solving for the total energy. Since PTOF should be proportional to the total energy, taking a ratio between the 0 volt energy and the 50 volt energy should tell me where the peak moves to. Doing so, I obtain the following:
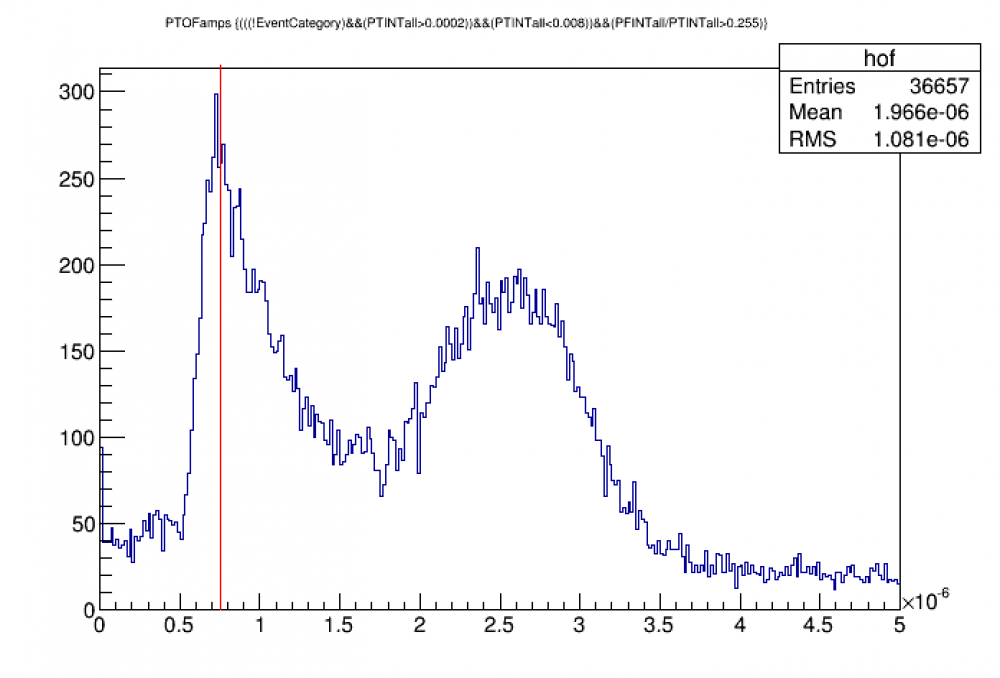
This implies that the lower peak near PTOF or 0.75E-6 is actually the 60keV peak, if that is true, it now begs the question of what exactly is the bump at higher PTOF that looks roughly gaussian? Could it be extra events the cuts failed to take out, or something totally different? In either case, the next step is going to be to try a resolution analysis.
Upon closer inspection, this peak seems to just be a result of my cuts and not actually anything real, I may have to try a different set of zero volt data or figure out a way to actually find out what is happening here (the PTOF and PTINTall look very different which shouldn't be the case).
Whelp, it turns out this is all CO57 data, guess I have try this again with actual Am data
Most of the zero volt data was nearly impossible to calibrate except for a series of 2 sided data. I have begun analysing some of that data Here