HV = 30V
- data taken Dec 6.
- One flash at the beginning, prebias to 35 V for 5 minutes
- HV current only 1-1.8 mV, detector voltage 29.2 V
- The plots below represent the first 6 hours
- pA (outer channel) not used, too much 60Hz noise
- pD (one of the inner ring sectors) railed
| pF OF spectrum (center channel), no-tails cut and loose chisquare cut |
|---|
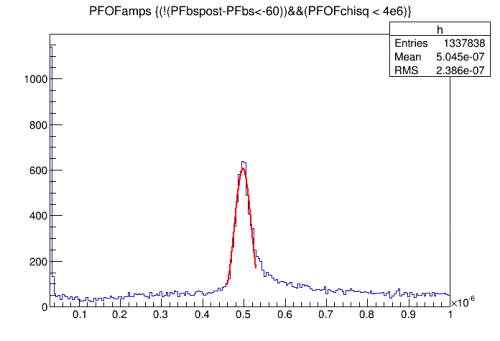 |
| Peak is identified as 10keV, based on comparing PF integral to 10keV peak in 0V data resolution much better here, about 4% (sigma/mean), half the width of the 0V peak |
| No clear sign of 1keV peak |
| pT OF versus pF OF, no-tails cut and loose chisquare cut |
|---|
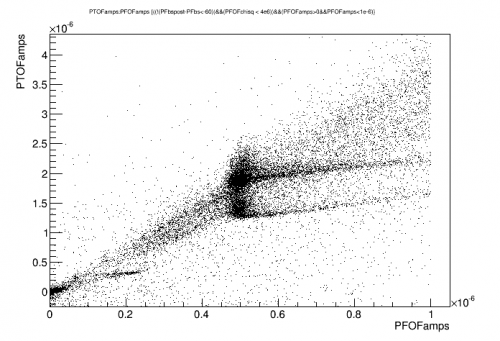 |
| In pT the 10keV peak has “structure” - maybe this is due to strong position dependence and a lack of relative calibration |
| In lower left can see 1keV peak, well-resolved in pT but not in pF |
| pT OF spectrum , no-tails cut and loose chisquare cut |
|---|
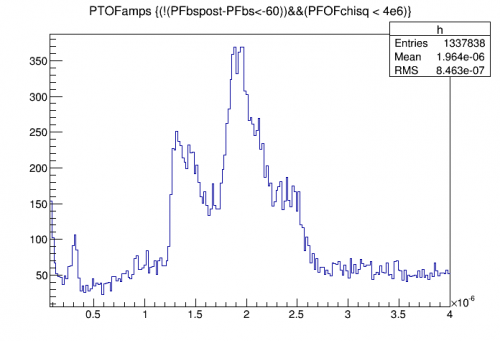 |
| Large feature is 10keV peak |
| 1keV peak visible too |
Neutralization hold time
| 10keV peak in PFOF | |
|---|---|
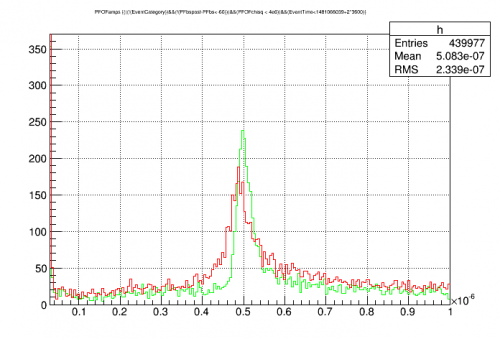 | 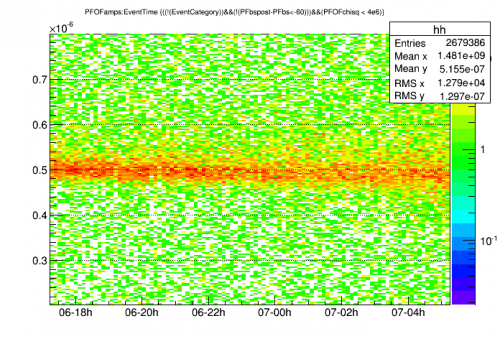 |
| Green = 0-2 hours, Red = 10-12 hours | |